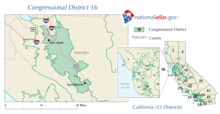
California's 16th congressional district
| California's 16th congressional district | |||
|---|---|---|---|
 California's 16th congressional district - since January 3, 2013. | |||
| Representative |
| ||
| Population (2019) | 753,152 | ||
| Median household income | $50,401[1] | ||
| Ethnicity |
| ||
| Cook PVI | D+9[2] | ||
California's 16th congressional district is a congressional district in the U.S. state of California, located in the central San Joaquin Valley.
The district is currently represented by Democrat Jim Costa. Currently, the district includes Merced County, most of Madera County, and part of Fresno County. Cities in the district include Los Banos, Madera, Merced, and most of Fresno.
From 1993 to 2013, the 16th district covered part of Santa Clara County, and included much of central San Jose. Much of that district is now the 19th district.
Recent election results from statewide races[]
| Year | Office | Results |
|---|---|---|
| 1992 | U.S. President | Clinton (D) 52.4 – 27.1% |
| U.S. Senator | Boxer (D) 54.4 – 34.0% | |
| U.S. Senator | Feinstein (D) 63.8 – 28.4% | |
| 1994 | Governor | [data unknown/missing] |
| U.S. Senator | [data unknown/missing] | |
| 1996 | U.S. President | [data unknown/missing] |
| 1998 | Governor | [data unknown/missing] |
| U.S. Senator | [data unknown/missing] | |
| 2000 | U.S. President[3] | Gore (D) 64.2 – 31.7% |
| U.S. Senator[4] | Feinstein (D) 64.4 – 30.2% | |
| 2002 | Governor[5] | Davis (D) 56.3 – 31.3% |
| 2003 | Recall[6][7] | No 57.3 – 42.7% |
| Bustamante (D) 41.2 – 38.7% | ||
| 2004 | U.S. President[8] | Kerry (D) 63.4 – 35.5% |
| U.S. Senator[9] | Boxer (D) 67.0 – 28.5% | |
| 2006 | Governor[10] | Schwarzenegger (R) 49.6 – 46.1% |
| U.S. Senator[11] | Feinstein (D) 70.2 – 24.6% | |
| 2008 | U.S. President[12] | Obama (D) 69.6 – 28.8% |
| 2010 | Governor | Brown (D) 62.3 – 33.4% |
| U.S. Senator | Boxer (D) 64.3 – 30.8% | |
| 2012 | U.S. President | Obama (D) 58.6 – 39.4% |
| U.S. Senator | Feinstein (D) 59.3 - 40.7% | |
| 2014 | Governor | Brown (D) 54.4 - 45.6% |
| 2016 | U.S. President | Clinton (D) 58.0 – 36.4% |
| U.S. Senator | Sanchez (D) 51.2 - 48.8% | |
| 2018 | Governor | Newsom (D) 56.1 - 43.9% |
| U.S. Senator | de Leon (D) 51.9 - 48.1% | |
| 2020 | U.S. President | Biden (D) 58.8 – 38.9% |
List of members representing the district[]
| Representative | Party | Dates | Cong ress(es) |
Electoral history | Counties |
|---|---|---|---|---|---|
| District created on March 4, 1933 | |||||
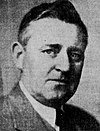
 John F. Dockweiler |
Democratic | March 4, 1933 – January 3, 1939 |
73rd 74th 75th |
Elected in 1932. Re-elected in 1934. Re-elected in 1936. Lost re-election as an independent candidate after running for governor |
[data unknown/missing] |
 Leland M. Ford |
Republican | January 3, 1939 – January 3, 1943 |
76th 77th |
Elected in 1938. Re-elected in 1940. Lost re-election. |
[data unknown/missing] |
 Will Rogers Jr. |
Democratic | January 3, 1943 – May 23, 1944 |
78th | Elected in 1942. Resigned to return to active duty in the Army |
[data unknown/missing] |
| Vacant | May 23, 1944 – January 3, 1945 |
78th | |||
 Ellis E. Patterson |
Democratic | January 3, 1945 – January 3, 1947 |
79th | Elected in 1944. Lost re-nomination |
[data unknown/missing] |
 Donald L. Jackson |
Republican | January 3, 1947 – January 3, 1961 |
80th 81st 82nd 83rd 84th 85th 86th |
Elected in 1946. Re-elected in 1948. Re-elected in 1950. Re-elected in 1952. Re-elected in 1954. Re-elected in 1956. Re-elected in 1958. Retired. |
[data unknown/missing] |
 Alphonzo E. Bell Jr. |
Republican | January 3, 1961 – January 3, 1963 |
87th | Elected in 1960. Redistricted to the 28th district |
[data unknown/missing] |
 B. F. Sisk |
Democratic | January 3, 1963 – January 3, 1967 |
88th 89th |
Redistricted from the 12th district and re-elected in 1962. Re-elected in 1964. |
Fresno, Madera, Merced |
| January 3, 1967 – January 3, 1975 |
90th 91st 92nd 93rd |
Re-elected in 1966. Re-elected in 1968. Re-elected in 1970. Re-elected in 1972. Redistricted to the 15th district. |
Fresno, Merced | ||
 Burt Talcott |
Republican | January 3, 1975 – January 3, 1977 |
94th | Redistricted from the 12th district and re-elected in 1974. Lost re-election. |
Western Monterey, San Benito, northern San Luis Obispo, Santa Cruz |
 Leon Panetta |
Democratic | January 3, 1977 – January 3, 1983 |
95th 96th 97th |
Elected in 1976. Re-elected in 1978. Re-elected in 1980. | |
| January 3, 1983 – January 3, 1993 |
98th 99th 100th 101st 102nd |
Re-elected in 1982. Re-elected in 1984. Re-elected in 1986. Re-elected in 1988. Re-elected in 1990. Redistricted to the 17th district |
Monterey, San Benito, northern San Luis Obispo, southern Santa Cruz | ||
 Don Edwards |
Democratic | January 3, 1993 – January 3, 1995 |
103rd | Redistricted from the 10th district and re-elected in 1992. Retired |
Santa Clara |
 Zoe Lofgren |
Democratic | January 3, 1995 – January 3, 2003 |
104th 105th 106th 107th |
Elected in 1994. Re-elected in 1996. Re-elected in 1998. Re-elected in 2000. | |
| January 3, 2003 – January 3, 2013 |
108th 109th 110th 111th 112th |
Re-elected in 2002. Re-elected in 2004. Re-elected in 2006. Re-elected in 2008. Re-elected in 2010. Redistricted to the 19th district |
 2003 - 2013 Santa Clara (San Jose) | ||
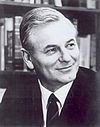
 Jim Costa |
Democratic | January 3, 2013 – present |
113th 114th 115th 116th 117th |
Redistricted from the 20th district and re-elected in 2012. Re-elected in 2014. Re-elected in 2016. Re-elected in 2018. Re-elected in 2020. |
 2013 - 2023 Central Valley including Fresno and Merced |
Election results[]
|
1932 • 1934 • 1936 • 1938 • 1940 • 1942 • 1944 • 1946 • 1948 • 1950 • 1952 • 1954 • 1956 • 1958 • 1960 • 1962 • 1964 • 1966 • 1968 • 1970 • 1972 • 1974 • 1976 • 1978 • 1980 • 1982 • 1984 • 1986 • 1988 • 1990 • 1992 • 1994 • 1996 • 1998 • 2000 • 2002 • 2004 • 2006 • 2008 • 2010 • 2012 • 2014 • 2016 • 2018 • 2020 |
1932[]
| Party | Candidate | Votes | % | ||
|---|---|---|---|---|---|
| Democratic | John F. Dockweiler | 70,333 | 54.9 | ||
| Republican | Clyde Woodworth | 57,718 | 45.1 | ||
| Total votes | 128,051 | 100.0 | |||
| Turnout | |||||
| Democratic win (new seat) | |||||
1934[]
| Party | Candidate | Votes | % | |
|---|---|---|---|---|
| Democratic | John F. Dockweiler (inc.) | 119,332 | 100.0 | |
| Turnout | ||||
| Democratic hold | ||||
1936[]
| Party | Candidate | Votes | % | |
|---|---|---|---|---|
| Democratic | John F. Dockweiler (inc.) | 90,986 | 57.7 | |
| Republican | Raymond V. Darby | 66,583 | 42.3 | |
| Total votes | 157,569 | 100.0 | ||
| Turnout | ||||
| Democratic hold | ||||
1938[]
| Party | Candidate | Votes | % | |||
|---|---|---|---|---|---|---|
| Republican | Leland M. Ford | 97,407 | 62.8 | |||
| Democratic | John F. Dockweiler (write-in) | 32,863 | 21.2 | |||
| Townsend | Ted E. Felt | 16,045 | 10.3 | |||
| Progressive | J. Barton Huthins | 6,643 | 4.3 | |||
| Communist | La Rue McCormick | 2,070 | 1.3 | |||
| Total votes | 155,028 | 100.0 | ||||
| Turnout | ||||||
| Republican gain from Democratic | ||||||
1940[]
| Party | Candidate | Votes | % | |||
|---|---|---|---|---|---|---|
| Republican | Leland M. Ford | 188,049 | 96.4 | |||
| Communist | George C. Sandy | 7,017 | 3.6 | |||
| Total votes | 195,066 | 100.0 | ||||
| Turnout | ||||||
| Republican gain from Democratic | ||||||
1942[]
| Party | Candidate | Votes | % | |||
|---|---|---|---|---|---|---|
| Democratic | Will Rogers Jr. | 61,437 | 53.7 | |||
| Republican | Leland M. Ford (incumbent) | 52,023 | 45.4 | |||
| Communist | Allen L. Ryan | 1,043 | 0.9 | |||
| Total votes | 114,503 | 100.0 | ||||
| Turnout | ||||||
| Democratic gain from Republican | ||||||
1944[]
| Party | Candidate | Votes | % | |
|---|---|---|---|---|
| Democratic | Ellis E. Patterson (inc.) | 105,835 | 54.1 | |
| Republican | Jesse Randolph Kellems | 89,700 | 45.9 | |
| Total votes | 195,535 | 100.0 | ||
| Turnout | ||||
| Democratic hold | ||||
1946[]
| Party | Candidate | Votes | % | |||
|---|---|---|---|---|---|---|
| Republican | Donald L. Jackson | 78,264 | 53.9 | |||
| Democratic | Harold Harby | 45,951 | 31.7 | |||
| Democratic | Ellis E. Patterson (write-in) | 20,945 | 14.4 | |||
| Total votes | 145,160 | 100.0 | ||||
| Turnout | ||||||
| Republican gain from Democratic | ||||||
1948[]
| Party | Candidate | Votes | % | |
|---|---|---|---|---|
| Republican | Donald L. Jackson (inc.) | 121,198 | 57 | |
| Democratic | Ellis E. Patterson | 91,268 | 43 | |
| Total votes | 212,466 | 100 | ||
| Turnout | ||||
| Republican hold | ||||
1950[]
| Party | Candidate | Votes | % | |
|---|---|---|---|---|
| Republican | Donald L. Jackson (inc.) | 115,970 | 59.3 | |
| Democratic | S. Mark Hogue | 79,744 | 40.7 | |
| Total votes | 195,714 | 100.0 | ||
| Turnout | ||||
| Republican hold | ||||
1952[]
| Party | Candidate | Votes | % | |
|---|---|---|---|---|
| Republican | Donald L. Jackson (inc.) | 79,127 | 59.7 | |
| Democratic | S. Mark Hogue | 53,337 | 40.3 | |
| Total votes | 132,464 | 100.0 | ||
| Turnout | ||||
| Republican hold | ||||
1954[]
| Party | Candidate | Votes | % | |
|---|---|---|---|---|
| Republican | Donald L. Jackson (inc.) | 63,124 | 60.8 | |
| Democratic | S. Mark Hogue | 40,659 | 39.2 | |
| Total votes | 103,783 | 100.0 | ||
| Turnout | ||||
| Republican hold | ||||
1956[]
| Party | Candidate | Votes | % | |
|---|---|---|---|---|
| Republican | Donald L. Jackson (inc.) | 84,050 | 60.8 | |
| Democratic | G. Robert "Bob" Fleming | 53,624 | 39.2 | |
| Total votes | 137,674 | 100.0 | ||
| Turnout | ||||
| Republican hold | ||||
1958[]
| Party | Candidate | Votes | % | |
|---|---|---|---|---|
| Republican | Donald L. Jackson (inc.) | 70,724 | 57.8 | |
| Democratic | Melvin Lennard | 51,616 | 42.2 | |
| Total votes | 122,340 | 100.0 | ||
| Turnout | ||||
| Republican hold | ||||
1960[]
| Party | Candidate | Votes | % | |
|---|---|---|---|---|
| Republican | Alphonzo E. Bell Jr. | 83,601 | 55.4 | |
| Democratic | Jerry Pacht | 67,318 | 44.6 | |
| Total votes | 150,919 | 100.0 | ||
| Turnout | ||||
| Republican hold | ||||
1962[]
| Party | Candidate | Votes | % | |
|---|---|---|---|---|
| Democratic | Bernice F. Sisk (incumbent) | 108,339 | 71.8 | |
| Republican | Arthur L. Selland | 42,401 | 28.2 | |
| Total votes | 150,740 | 100.0 | ||
| Turnout | ||||
| Democratic hold | ||||
1964[]
| Party | Candidate | Votes | % | |
|---|---|---|---|---|
| Democratic | Bernice F. Sisk (incumbent) | 117,727 | 66.8 | |
| Republican | David T. Harris | 58,604 | 33.2 | |
| Total votes | 176,331 | 100.0 | ||
| Turnout | ||||
| Democratic hold | ||||
1966[]
| Party | Candidate | Votes | % | |
|---|---|---|---|---|
| Democratic | Bernice F. Sisk (incumbent) | 118,063 | 71.4 | |
| Republican | Cecil F. White | 47,329 | 28.6 | |
| Total votes | 165,392 | 100.0 | ||
| Turnout | ||||
| Democratic hold | ||||
1968[]
| Party | Candidate | Votes | % | |
|---|---|---|---|---|
| Democratic | Bernice F. Sisk (incumbent) | 97,473 | 62.5 | |
| Republican | Dave Harris | 55,192 | 35.4 | |
| American Independent | John P. Carroll | 3,390 | 2.2 | |
| Total votes | 156,055 | 100.0 | ||
| Turnout | ||||
| Democratic hold | ||||
1970[]
| Party | Candidate | Votes | % | |
|---|---|---|---|---|
| Democratic | Bernice F. Sisk (incumbent) | 95,118 | 66.4 | |
| Republican | Phillip V. Sanchez | 43,843 | 30.6 | |
| American Independent | James W. Scott | 4,237 | 3.0 | |
| Total votes | 143,198 | 100.0 | ||
| Turnout | ||||
| Democratic hold | ||||
1972[]
| Party | Candidate | Votes | % | |
|---|---|---|---|---|
| Democratic | Bernice F. Sisk (incumbent) | 134,079 | 79.1 | |
| Republican | Carol Harner | 35,384 | 20.9 | |
| Total votes | 169,463 | 100.0 | ||
| Turnout | ||||
| Democratic hold | ||||
1974[]
| Party | Candidate | Votes | % | |
|---|---|---|---|---|
| Republican | Burt L. Talcott (incumbent) | 76,084 | 49.2 | |
| Democratic | Julian Camacho | 74,018 | 47.8 | |
| American Independent | D. Jeff Mauro | 4,576 | 3.0 | |
| Total votes | 154,678 | 100.0 | ||
| Turnout | ||||
| Republican hold | ||||
1976[]
| Party | Candidate | Votes | % | |||
|---|---|---|---|---|---|---|
| Democratic | Leon Panetta | 104,545 | 53.4 | |||
| Republican | Burt L. Talcott (incumbent) | 91,160 | 46.6 | |||
| Total votes | 195,705 | 100.0 | ||||
| Turnout | ||||||
| Democratic gain from Republican | ||||||
1978[]
| Party | Candidate | Votes | % | |
|---|---|---|---|---|
| Democratic | Leon Panetta (incumbent) | 104,550 | 61.4 | |
| Republican | Eric Seastrand | 65,808 | 38.6 | |
| Total votes | 170,358 | 100.0 | ||
| Turnout | ||||
| Democratic hold | ||||
1980[]
| Party | Candidate | Votes | % | |
|---|---|---|---|---|
| Democratic | Leon Panetta (incumbent) | 158,360 | 71.0 | |
| Republican | W. A. "Jack" Roth | 54,675 | 24.5 | |
| Libertarian | Kenton H. Bowers | 6,802 | 3.0 | |
| Peace and Freedom | D. Jeff Mauro | 3,198 | 1.4 | |
| Total votes | 223,035 | 100.0 | ||
| Turnout | ||||
| Democratic hold | ||||
1982[]
| Party | Candidate | Votes | % | |
|---|---|---|---|---|
| Democratic | Leon Panetta (incumbent) | 142,630 | 85.4 | |
| Republican | Gary Richard Arnold | 24,448 | 14.6 | |
| Total votes | 167,078 | 100.0 | ||
| Turnout | ||||
| Democratic hold | ||||
1984[]
| Party | Candidate | Votes | % | |
|---|---|---|---|---|
| Democratic | Leon Panetta (incumbent) | 153,377 | 70.8 | |
| Republican | Patricia Smith Ramsey | 60,065 | 27.7 | |
| Libertarian | Bill Anderson | 3,245 | 1.5 | |
| Total votes | 216,687 | 100.0 | ||
| Turnout | ||||
| Democratic hold | ||||
1986[]
| Party | Candidate | Votes | % | |
|---|---|---|---|---|
| Democratic | Leon Panetta (incumbent) | 128,151 | 78.4 | |
| Republican | Louis Darrigo | 31,386 | 19.2 | |
| Peace and Freedom | Ron Wright | 2,017 | 1.2 | |
| Libertarian | Bill Anderson | 1,944 | 1.2 | |
| Total votes | 163,498 | 100.0 | ||
| Turnout | ||||
| Democratic hold | ||||
1988[]
| Party | Candidate | Votes | % | |
|---|---|---|---|---|
| Democratic | Leon Panetta (incumbent) | 177,452 | 78.6 | |
| Republican | Stanley K. Monteith | 48,375 | 21.4 | |
| Total votes | 225,827 | 100.0 | ||
| Turnout | ||||
| Democratic hold | ||||
1990[]
| Party | Candidate | Votes | % | |
|---|---|---|---|---|
| Democratic | Leon Panetta (incumbent) | 134,236 | 74.2 | |
| Republican | Jerry M. Reiss | 39,885 | 22.0 | |
| Libertarian | Brian H. Tucker | 6,881 | 3.8 | |
| Total votes | 181,002 | 100.0 | ||
| Turnout | ||||
| Democratic hold | ||||
1992[]
| Party | Candidate | Votes | % | |
|---|---|---|---|---|
| Democratic | Don Edwards (incumbent) | 96,661 | 62 | |
| Republican | Ted Bundesen | 49,843 | 32 | |
| Peace and Freedom | Amani S. Kummba | 9,370 | 6 | |
| No party | Hunt (write-in) | 5 | 0 | |
| No party | Loeber (write-in) | 3 | 0 | |
| No party | James (write-in) | 1 | 0 | |
| Total votes | 155,883 | 100.0 | ||
| Turnout | ||||
| Democratic hold | ||||
1994[]
| Party | Candidate | Votes | % | |
|---|---|---|---|---|
| Democratic | Zoe Lofgren | 74,935 | 64.96 | |
| Republican | Lyle J. Smith | 40,409 | 35.03 | |
| No party | Barraza (write-in) | 8 | 0.01 | |
| Total votes | 115,352 | 100.0 | ||
| Turnout | ||||
| Democratic hold | ||||
1996[]
| Party | Candidate | Votes | % | |
|---|---|---|---|---|
| Democratic | Zoe Lofgren (incumbent) | 94,020 | 65.7 | |
| Republican | Chuck Wojslaw | 43,197 | 30.2 | |
| Libertarian | David Bonino | 4,124 | 2.8 | |
| Natural Law | Abaan Abu-Shumays | 1,866 | 1.3 | |
| Total votes | 143,207 | 100.0 | ||
| Turnout | ||||
| Democratic hold | ||||
1998[]
| Party | Candidate | Votes | % | |
|---|---|---|---|---|
| Democratic | Zoe Lofgren (incumbent) | 85,503 | 72.82 | |
| Republican | Horace Eugene Thayn | 27,494 | 23.42 | |
| Natural Law | John H. Black | 4,417 | 3.76 | |
| Total votes | 117,414 | 100.0 | ||
| Turnout | ||||
| Democratic hold | ||||
2000[]
| Party | Candidate | Votes | % | |
|---|---|---|---|---|
| Democratic | Zoe Lofgren (incumbent) | 115,118 | 72.1 | |
| Republican | Horace "Gene" Thayn | 37,213 | 23.3 | |
| Libertarian | Dennis Michael Umphress | 4,742 | 3.0 | |
| Natural Law | Edward J. Klein | 2,673 | 1.6 | |
| Total votes | 159,746 | 100.0 | ||
| Turnout | ||||
| Democratic hold | ||||
2002[]
| Party | Candidate | Votes | % | |
|---|---|---|---|---|
| Democratic | Zoe Lofgren (incumbent) | 72,370 | 67.1 | |
| Republican | Douglas Adams McNea | 32,182 | 29.8 | |
| Libertarian | Dennis Michael Umphress | 3,434 | 3.1 | |
| Total votes | 104,556 | 100.0 | ||
| Turnout | ||||
| Democratic hold | ||||
2004[]
| Party | Candidate | Votes | % | |
|---|---|---|---|---|
| Democratic | Zoe Lofgren (incumbent) | 129,222 | 70.9 | |
| Republican | Lawrence R. Wiesner | 47,992 | 26.4 | |
| Libertarian | Markus Welch | 5,067 | 2.7 | |
| Total votes | 182,281 | 100.0 | ||
| Turnout | ||||
| Democratic hold | ||||
2006[]
| Party | Candidate | Votes | % | |
|---|---|---|---|---|
| Democratic | Zoe Lofgren (incumbent) | 98,929 | 72.8 | |
| Republican | Charel Winston | 37,130 | 27.2 | |
| Total votes | 136,059 | 100.0 | ||
| Turnout | ||||
| Democratic hold | ||||
2008[]
| Party | Candidate | Votes | % | |
|---|---|---|---|---|
| Democratic | Zoe Lofgren (incumbent) | 146,481 | 71.3 | |
| Republican | Charel Winston | 49,399 | 24.1 | |
| Libertarian | Steven Wells | 9,447 | 4.6 | |
| Total votes | 205,327 | 100.0 | ||
| Turnout | ||||
| Democratic hold | ||||
2010[]
| Party | Candidate | Votes | % | |
|---|---|---|---|---|
| Democratic | Zoe Lofgren (incumbent) | 105,841 | 67.82 | |
| Republican | Daniel Sahagun | 37,913 | 24.29 | |
| Libertarian | Edward Gonzalez | 12,304 | 7.89 | |
| Total votes | 156,058 | 100.00 | ||
| Turnout | ||||
| Democratic hold | ||||
2012[]
| Party | Candidate | Votes | % | |
|---|---|---|---|---|
| Democratic | Jim Costa (incumbent) | 84,649 | 57% | |
| Republican | Brian Daniel Whelan | 62,801 | 43% | |
| Total votes | 147,450 | 100.0% | ||
| Democratic hold | ||||
2014[]
| Party | Candidate | Votes | % | |
|---|---|---|---|---|
| Democratic | Jim Costa (incumbent) | 46,277 | 51% | |
| Republican | Johnny Tacherra | 44,943 | 49% | |
| Total votes | 91,220 | 100.0% | ||
| Democratic hold | ||||
2016[]
| Party | Candidate | Votes | % | |
|---|---|---|---|---|
| Democratic | Jim Costa (incumbent) | 97,473 | 58% | |
| Republican | Johnny Tacherra | 70,483 | 42% | |
| Total votes | 167,956 | 100.0% | ||
| Democratic hold | ||||
2018[]
| Party | Candidate | Votes | % | |
|---|---|---|---|---|
| Democratic | Jim Costa (incumbent) | 82,266 | 58% | |
| Republican | Elizabeth Heng | 60,693 | 42% | |
| Total votes | 142,959 | 100.0% | ||
| Democratic hold | ||||
2020[]
| Party | Candidate | Votes | % | |
|---|---|---|---|---|
| Democratic | Jim Costa (incumbent) | 128,690 | 59.4 | |
| Republican | Kevin Cookingham | 88,039 | 40.6 | |
| Total votes | 216,729 | 100.0 | ||
| Democratic hold | ||||
Historical district boundaries[]
See also[]
References[]
- ^ https://www.census.gov/mycd/?st=06&cd=16
- ^ "Partisan Voting Index – Districts of the 115th Congress" (PDF). The Cook Political Report. April 7, 2017. Retrieved April 7, 2017.
- ^ Statement of Vote (2000 President) Archived May 20, 2011, at the Wayback Machine
- ^ Statement of Vote (2000 Senator) Archived May 20, 2011, at the Wayback Machine
- ^ Statement of Vote (2002 Governor) Archived November 11, 2010, at the Wayback Machine
- ^ Statement of Vote (2003 Recall Question) Archived May 20, 2011, at the Wayback Machine
- ^ Statement of Vote (2003 Governor) Archived May 20, 2011, at the Wayback Machine
- ^ Statement of Vote (2004 President) Archived May 20, 2011, at the Wayback Machine
- ^ Statement of Vote (2004 Senator) Archived August 10, 2011, at the Wayback Machine
- ^ Statement of Vote (2006 Governor) Archived August 10, 2011, at the Wayback Machine
- ^ Statement of Vote (2006 Senator) Archived August 10, 2011, at the Wayback Machine
- ^ (2008 President) Archived 2009-02-14 at the Wayback Machine
- ^ 1932 election results
- ^ 1934 election results
- ^ 1936 election results
- ^ 1938 election results
- ^ 1940 election results
- ^ 1942 election results
- ^ 1944 election results
- ^ 1946 election results
- ^ 1948 election results
- ^ 1950 election results
- ^ 1952 election results
- ^ 1954 election results
- ^ 1956 election results
- ^ 1958 election results
- ^ 1960 election results
- ^ 1962 election results
- ^ 1964 election results
- ^ 1966 election results
- ^ 1968 election results
- ^ 1970 election results
- ^ 1972 election results
- ^ 1974 election results
- ^ 1976 election results
- ^ 1978 election results
- ^ 1980 election results
- ^ 1982 election results
- ^ 1984 election results
- ^ 1986 election results
- ^ 1988 election results
- ^ 1990 election results
- ^ 1992 election results
- ^ 1994 election results
- ^ 1996 election results
- ^ 1998 election results
- ^ 2000 election results
- ^ 2002 general election results Archived February 3, 2009, at the Wayback Machine
- ^ 2004 general election results[dead link]
- ^ 2006 general election results Archived November 27, 2008, at the Wayback Machine
- ^ 2006 Office of the Clerk of the United States House of Representatives[permanent dead link] "Statistics of the Congressional Election of November 4, 2008" (retrieved on August 8th, 2009).
- ^ 2010 Office of the Clerk of the United States House of Representatives[permanent dead link] "Statistics of the Congressional Election of November 2, 2010" (retrieved on March 24th, 2011).
- ^ 2012 general election results Archived October 19, 2013, at the Wayback Machine
- ^ U.S. House of Representatives District 16 - Districtwide Results Archived 2014-12-21 at the Wayback Machine
External links[]
- GovTrack.us: California's 16th congressional district
- RAND California Election Returns: District Definitions
- California Voter Foundation map - CD16
| Authority control |
|
|---|
Coordinates: 37°06′34″N 120°31′18″W / 37.10944°N 120.52167°W

- Congressional districts of California
- Government of Fresno County, California
- Government of Madera County, California
- Government of Merced County, California
- Fresno, California
- Los Banos, California
- Merced, California
- Madera, California
- San Joaquin Valley
- Constituencies established in 1933
- 1933 establishments in California