California's 10th congressional district
| California's 10th congressional district | |||
|---|---|---|---|
 California's 10th congressional district since January 3, 2013 | |||
| Representative |
| ||
| Population (2019) | 764,859 | ||
| Median household income | $69,647[1] | ||
| Ethnicity |
| ||
| Cook PVI | EVEN[2] | ||
California's 10th congressional district is a congressional district in the U.S. state of California. Currently, the 10th district encompasses part of the northern San Joaquin Valley. It is currently represented by Democrat Josh Harder.
Harder defeated incumbent Republican Jeff Denham in the 2018 midterm elections.
The district includes all of Stanislaus County and part of San Joaquin County. It is centered on Modesto. Cities in the district include Oakdale, Manteca, Modesto, Tracy, and Turlock.[3]
History[]
Until 2012[]
Prior to redistricting by the California Citizens Redistricting Commission going into effect in 2012, the 10th district stretched from Livermore to Dixon and the outskirts of Vacaville. It consisted of portions of Alameda, Contra Costa, Sacramento, and Solano Counties.

Following redistricting in 1992, the 10th district was based in the East Bay, and included parts of Alameda and Contra Costa counties. It received national attention in 1996 when Democrat Ellen Tauscher defeated incumbent Republican Bill Baker in what was considered an upset.[4]
In the 2002 redistricting of California, all seats were made safe[5] for the parties of incumbent officeholders. The district boundaries were extended to include parts of Solano County, southwestern Sacramento County, eastern Contra Costa County and El Cerrito in western Contra Costa County. Although much of the suburban Tri-Valley region was shifted to the 11th congressional district, the city of Livermore remained in the 10th at Tauscher's request (as a member of the U.S. House Committee on Energy and Commerce, she had some oversight responsibilities over the U.S. Department of Energy, and hence indirectly of Lawrence Livermore National Laboratory).
On June 26, 2009, Tauscher resigned her seat to be sworn in as Undersecretary of State for Arms Control and International Security.[6][7][8] In the ensuing special election held on November 3, 2009, former Democratic Lieutenant Governor John Garamendi won the seat over Republican David Harmer 53.0% to 42.7%. Immediately following redistricting, Garamendi successfully ran for re-election in California's 3rd congressional district, which shares many municipalities with the 2002 version of the 10th district (e.g. Vacaville and Fairfield), but lies significantly northwest of the current 10th district.
2012 – 2022[]
The 10th congressional district starting with the election of 2012 and lasting through the election of 2020 included all of Stanislaus County (including Ceres, Oakdale, Modesto, Riverbank, and Turlock) and the southern portion of San Joaquin County (including Tracy and Manteca).[3]
This went into effect in 2012, as the result of redistricting by the California Citizens Redistricting Commission. This version of the 10th included much of the core of the old 18th district (Modesto, Ceres, and the southwestern half of Stanislaus County), though the 18th also included a substantial portion of Stockton. It also shares much of the northwestern portion of the old 19th district (Turlock, Riverbank, Oakdale, and the rest of northeastern Stanislaus County).
Republican Jeff Denham transferred from the prior 19th district to the newer 10th. He held it for three terms until being defeated in 2018 by Democrat Josh Harder, who won reelection in 2020, and is presently representing this district (as of this writing in 2022).
After 2022[]
The 10th district was redrawn in time for the 2022 election, being divided up between California's 5th congressional district (which now includes eastern portions of Modesto and eastern portions of Turlock), California's 9th congressional district (which is centered on Stockton, California and includes Tracy), and California's 13th congressional district (which includes western Modesto and western Turlock) .[9] Current 10th district incumbent Josh Harder is running for reelection in the new version of California's 9th congressional district.
Election results from statewide races[]
1992 – 2020[]
| Year | Office | Results |
|---|---|---|
| 1992 | President | Clinton 42.4 - 35.6% |
| Senator | Boxer 48.0 - 42.5% | |
| Senator | Feinstein 56.9 - 37.7% | |
| 1994 | Governor[10] | Wilson 59.7 - 37.1% |
| Senator[11] | Feinstein 52.3 - 42.0% | |
| 1996 | President[12] | Clinton 48.2 - 42.6% |
| 1998 | Governor[13] | Davis 56.0 - 41.3% |
| Senator[14] | Boxer 50.2 - 46.8% | |
| 2000 | President[15] | Gore 51.3 - 44.8% |
| Senator[16] | Feinstein 55.8 - 40.0% | |
| 2002 | Governor[17] | Davis 49.9 - 39.1% |
| 2003 | Recall[18][19] | |
| Schwarzenegger 42.2 - 34.7% | ||
| 2004 | President[20] | Kerry 58.5 - 40.4% |
| Senator[21] | Boxer 60.1 - 36.6% | |
| 2006 | Governor[22] | Schwarzenegger 56.2 - 38.7% |
| Senator[23] | Feinstein 65.5 - 30.0% | |
| 2008 | President[24] | Obama 64.7 - 33.1% |
| 2010 | Governor | Brown 57.4 - 38.7% |
| Senator | Boxer 56.0 - 39.4% | |
| 2012 | President | Obama 50.6 - 47.0% |
| Senator[25] | Feinstein 52.1 - 47.9% | |
| 2014 | Governor[26] | Brown 51.7 - 48.3% |
| 2016 | President | Clinton 48.5 - 45.5% |
| Senator[27] | Harris 57.1 - 42.9% | |
| 2018 | Governor[28] | Cox 50.5 - 49.5% |
| Senator[29] | de Leon 56.9 - 43.1% | |
| 2020 | President | Biden 50.3 - 47.4% |
Competitiveness[]
Voter Registration Statistics[]
The California Secretary of State publishes reports on California voter registration on a regular basis. Before the 2018 primary election, they published a report dating May 21, 2018.
| Date | Democratic | Republican | American Independent | Green | Libertarian | No Party Preference |
|---|---|---|---|---|---|---|
| May 21, 2018[30] | 127,878 | 117,900 | 10,011 | 959 | 2,484 | 70,251 |
List of members representing the district[]
| Member | Party | Dates | Cong ress |
Electoral history | Counties |
|---|---|---|---|---|---|
| District created on March 4, 1913 | |||||
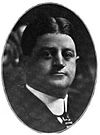
 William Stephens |
Progressive | March 4, 1913 – July 22, 1916 |
63rd 64th |
Redistricted from the 7th district and re-elected in 1912. Re-elected in 1914. Resigned to become Lieutenant Governor of California. |
1913–1933 Los Angeles (Los Angeles) |
| Vacant | July 22, 1916 – November 7, 1916 |
64th | |||
 Henry S. Benedict |
Republican | November 7, 1916 – March 3, 1917 |
Elected to finish Stephens's term. Ran for the next term as a Progressive but withdrew. | ||
 Henry Z. Osborne |
Republican | March 4, 1917 – February 8, 1923 |
65th 66th 67th |
Elected in 1916. Re-elected in 1918. Re-elected in 1920. Re-elected in 1922 but died. | |
| Vacant | February 8, 1923 – May 1, 1923 |
67th 68th | |||
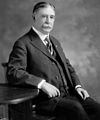
 John D. Fredericks |
Republican | May 1, 1923 – March 3, 1927 |
68th 69th |
Elected to finish Osborne's term. Re-elected in 1924. Retired. | |
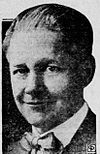 Joe Crail |
Republican | March 4, 1927 – March 3, 1933 |
70th 71st 72nd |
Elected in 1926. Re-elected in 1928. Re-elected in 1930. Retired. | |
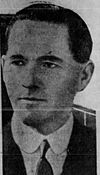 Henry E. Stubbs |
Democratic | March 4, 1933 – February 28, 1937 |
73rd 74th 75th |
Elected in 1932. Re-elected in 1934. Re-elected in 1936. Died. |
1933–1943 Kern, San Luis Obispo, Santa Barbara, Tulare, Ventura |
| Vacant | February 28, 1937 – May 4, 1937 |
75th | |||
 Alfred J. Elliott |
Democratic | May 4, 1937 – January 3, 1949 |
75th 76th 77th 78th 79th 80th |
Elected to finish Stubbs's term. Re-elected in 1938. Re-elected in 1940. Re-elected in 1942. Re-elected in 1944. Re-elected in 1946. Retired. | |
| 1943–1953 Kern, Kings, Tulare | |||||
 Thomas H. Werdel |
Republican | January 3, 1949 – January 3, 1953 |
81st 82nd |
Elected in 1948. Re-elected in 1950. Redistricted to the 14th district. Lost re-election. | |
 Charles Gubser |
Republican | January 3, 1953 – December 31, 1974 |
83rd 84th 85th 86th 87th 88th 89th 90th 91st 92nd 93rd |
Elected in 1952. Re-elected in 1954. Re-elected in 1956. Re-elected in 1958. Re-elected in 1960. Re-elected in 1962. Re-elected in 1964. Re-elected in 1966. Re-elected in 1968. Re-elected in 1970. Re-elected in 1972. Retired and resigned. |
1953–1963 San Benito, Santa Clara, Santa Cruz |
| 1963–1967 San Benito, western Santa Clara | |||||
| 1967–1973 Western Santa Clara | |||||
| 1973–1975 Most of Santa Clara | |||||
| Vacant | December 31, 1974 – January 3, 1975 |
93rd | |||
 Don Edwards |
Democratic | January 3, 1975 – January 3, 1993 |
94th 95th 96th 97th 98th 99th 100th 101st 102nd |
Redistricted from the 9th district and re-elected in 1974. Re-elected in 1976. Re-elected in 1978. Re-elected in 1980. Re-elected in 1982. Re-elected in 1984. Re-elected in 1986. Re-elected in 1988. Re-elected in 1990. Redistricted to the 16th district. |
1975–1983 Southwest Alameda, northern Santa Clara |
| 1983–1993 SW Alameda, Santa Clara (eastern San Jose) | |||||
 Bill Baker |
Republican | January 3, 1993 – January 3, 1997 |
103rd 104th |
Elected in 1992. Re-elected in 1994. Lost re-election. |
1993–2003 Eastern Alameda, eastern Contra Costa |
 Ellen Tauscher |
Democratic | January 3, 1997 – June 26, 2009 |
105th 106th 107th 108th 109th 110th 111th |
Elected in 1996. Re-elected in 1998. Re-elected in 2000. Re-elected in 2002. Re-elected in 2004. Re-elected in 2006. Re-elected in 2008. Resigned to become Undersecretary of State for Arms Control and International Security. | |
| 2003–2013 Southeast Alameda, most of Contra Costa, southwest Sacramento, most of Solano 
| |||||
| Vacant | June 26, 2009 – November 3, 2009 |
111th | |||
 John Garamendi |
Democratic | November 3, 2009 – January 3, 2013 |
111th 112th |
Elected to finish Tauscher's term. Re-elected in 2010. Redistricted to the 3rd district. | |
 Jeff Denham |
Republican | January 3, 2013 – January 3, 2019 |
113th 114th 115th |
Redistricted from the 19th district and re-elected in 2012. Re-elected in 2014. Re-elected in 2016. Lost re-election. |
2013–present Central Valley including Modesto and Tracy |
 Josh Harder |
Democratic | January 3, 2019 – present |
116th 117th |
Elected in 2018. Re-elected in 2020. Redistricted to the 13th district. | |
Election results for representatives[]
1912[]
| Party | Candidate | Votes | % | |
|---|---|---|---|---|
| Progressive | William Stephens (Incumbent) | 43,637 | 53.4 | |
| Democratic | George Ringo | 17,890 | 21.9 | |
| Socialist | Fred C. Wheeler | 17,126 | 21.0 | |
| Prohibition | Emory D. Martindale | 2,995 | 3.7 | |
| Total votes | 81,648 | 100.0 | ||
| Turnout | ||||
| Progressive hold | ||||
1914[]
| Party | Candidate | Votes | % | |
|---|---|---|---|---|
| Progressive | William Stephens (Incumbent) | 44,141 | 38.4 | |
| Republican | Henry Z. Osborne | 33,172 | 28.9 | |
| Democratic | Nathan Newby | 17,810 | 15.5 | |
| Socialist | Ralph L. Criswell | 14,900 | 13.0 | |
| Prohibition | Henry Clay Needham | 4,903 | 4.3 | |
| Total votes | 70,926 | 100.0 | ||
| Turnout | ||||
| Progressive hold | ||||
1916 (Special)[]
| Party | Candidate | Votes | % | |
|---|---|---|---|---|
| Progressive | Henry S. Benedict (write-in) | 19,062 | 62.82 | |
| Independent | Joy Clark (write-in) | 7,149 | 23.59 | |
| Prohibition | Henry Clay Needham (write-in) | 1,310 | 4.32 | |
| Unknown | George Clark (write-in) | 1,073 | 3.54 | |
| Socialist | James H. Ryckman (write-in) | 911 | 3.01 | |
| Democratic | Rufus V. Bowden (write-in) | 553 | 1.83 | |
| Unknown | John C. Wray (write-in) | 270 | 0.89 | |
| Total votes | 30,328 | 100.0 | ||
| Turnout | ||||
| Progressive hold | ||||
1916[]
| Party | Candidate | Votes | % | |
|---|---|---|---|---|
| Republican | Henry Z. Osborne | 63,913 | 49.5 | |
| Democratic | Rufus W. Bowden | 33,225 | 25.7 | |
| Progressive | Henry Stanley Benedict | 14,305 | 11.1 | |
| Socialist | James H. Ryckman | 9,000 | 7.0 | |
| Prohibition | Henry Clay Needham | 8,781 | 6.8 | |
| Total votes | 129,224 | 100.0 | ||
| Turnout | ||||
| Republican hold | ||||
1918[]
| Party | Candidate | Votes | % | |
|---|---|---|---|---|
| Republican | Henry Z. Osborne (Incumbent) | 72,773 | 88.2 | |
| Socialist | James H. Ryckman | 9,725 | 11.8 | |
| Total votes | 82,498 | 100.0 | ||
| Turnout | ||||
| Republican hold | ||||
1920[]
| Party | Candidate | Votes | % | |
|---|---|---|---|---|
| Republican | Henry Z. Osborne (Incumbent) | 97,469 | 82.7 | |
| Socialist | Upton Sinclair | 20,439 | 17.3 | |
| Total votes | 117,908 | 100.0 | ||
| Turnout | ||||
| Republican hold | ||||
1922[]
| Party | Candidate | Votes | % | |
|---|---|---|---|---|
| Republican | Henry Z. Osborne (Incumbent) | 98,739 | 100.0 | |
| Turnout | 98,739 | 100 | ||
| Republican hold | ||||
1923 (Special)[]
Republican John D. Fredericks won the special election to replace fellow Republican Henry Z. Osborne, who died in office.[34]
| Party | Candidate | Votes | % | |
|---|---|---|---|---|
| Republican | John D. Fredericks | 28,084 | 36.16 | |
| Republican | Henry Z. Osborne Jr. | 18,103 | 23.31 | |
| Democratic | Lloy Galphin | 13,748 | 17.70 | |
| Republican | Alfred L. Bartlett | 8,857 | 11.40 | |
| Republican | Frank A. McDonald | 5,884 | 7.58 | |
| Prohibition | John C. Bell | 1,875 | 2.41 | |
| Independent | Upton Sinclair | 1,113 | 1.43 | |
| Total votes | 77,664 | 100 | ||
| Turnout | ||||
| Republican hold | ||||
1924[]
| Party | Candidate | Votes | % | |
|---|---|---|---|---|
| Republican | John D. Fredericks (Incumbent) | 133,780 | 62.3 | |
| Democratic | Robert W. Richardson | 80,870 | 37.7 | |
| Total votes | 214,650 | 100.0 | ||
| Turnout | ||||
| Republican hold | ||||
1926[]
| Party | Candidate | Votes | % | |
|---|---|---|---|---|
| Republican | Joe Crail (Incumbent) | 144,677 | 86.8 | |
| Socialist | N. Jackson Wright | 21,997 | 13.2 | |
| Total votes | 166,674 | 100.0 | ||
| Turnout | ||||
| Republican hold | ||||
1928[]
| Party | Candidate | Votes | % | |
|---|---|---|---|---|
| Republican | Joe Crail (Incumbent) | 301,028 | 93.9 | |
| Democratic | Harry Sherr | 19,659 | 6.1 | |
| Total votes | 320,687 | 100.0 | ||
| Turnout | ||||
| Republican hold | ||||
1930[]
| Party | Candidate | Votes | % | |
|---|---|---|---|---|
| Republican | Joe Crail (Incumbent) | 162,502 | 75.0 | |
| Democratic | John F. Dockweiler | 54,231 | 25.0 | |
| Total votes | 216,733 | 100 | ||
| Turnout | ||||
| Republican hold | ||||
1932[]
| Party | Candidate | Votes | % | |||
|---|---|---|---|---|---|---|
| Democratic | Henry E. Stubbs | 50,390 | 55.3 | |||
| Republican | Arthur S. Crites | 40,794 | 44.7 | |||
| Total votes | 91,184 | 100.0 | ||||
| Turnout | ||||||
| Democratic gain from Republican | ||||||
1934[]
| Party | Candidate | Votes | % | |
|---|---|---|---|---|
| Democratic | Henry E. Stubbs (Incumbent) | 68,475 | 64.4 | |
| Republican | George R. Bliss | 37,860 | 35.6 | |
| Total votes | 106,335 | 100.0 | ||
| Turnout | ||||
| Democratic hold | ||||
1936[]
| Party | Candidate | Votes | % | |
|---|---|---|---|---|
| Democratic | Henry E. Stubbs (Incumbent) | 72,476 | 69.6 | |
| Republican | George R. Bliss | 31,700 | 30.4 | |
| Total votes | 104,176 | 100.0 | ||
| Turnout | ||||
| Democratic hold | ||||
1937 (Special)[]
Democrat Alfred J. Elliott won the special election to replace fellow Democrat Henry E. Stubbs, who died in office.[43]
| Party | Candidate | Votes | % | |
|---|---|---|---|---|
| Democratic | Alfred J. Elliott | 22,321 | 48.91 | |
| Republican | Harry A. Hopkins | 17,678 | 38.74 | |
| Progressive | Al Sessions | 5,638 | 12.35 | |
| Total votes | 45,637 | 100 | ||
| Turnout | ||||
| Democratic hold | ||||
1938[]
| Party | Candidate | Votes | % | |
|---|---|---|---|---|
| Democratic | Alfred J. Elliott (Incumbent) | 84,791 | 67.3 | |
| Republican | F. Fred Hoelscher | 41,194 | 32.7 | |
| Total votes | 125,985 | 100.0 | ||
| Turnout | ||||
| Democratic hold | ||||
1940[]
| Party | Candidate | Votes | % | |
|---|---|---|---|---|
| Democratic | Alfred J. Elliott (Incumbent) | 125,845 | 97.0 | |
| Communist | Louretta Adams | 3,826 | 3.0 | |
| Total votes | 129,671 | 100 | ||
| Turnout | ||||
| Democratic hold | ||||
1942[]
| Party | Candidate | Votes | % | |
|---|---|---|---|---|
| Democratic | Alfred J. Elliott (Incumbent) | 43,864 | 100.0 | |
| Turnout | 43,864 | 100 | ||
| Democratic hold | ||||
1944[]
| Party | Candidate | Votes | % | |
|---|---|---|---|---|
| Democratic | Alfred J. Elliott (Incumbent) | 60,001 | 100.0 | |
| Turnout | 60,001 | 100 | ||
| Democratic hold | ||||
1946[]
| Party | Candidate | Votes | % | |
|---|---|---|---|---|
| Democratic | Alfred J. Elliott (Incumbent) | 51,843 | 100.0 | |
| Turnout | 100 | |||
| Democratic hold | ||||
1948[]
| Party | Candidate | Votes | % | |||
|---|---|---|---|---|---|---|
| Republican | Thomas H. Werdel | 67,448 | 71.3 | |||
| Progressive | Sam James Miller | 27,168 | 28.7 | |||
| Total votes | 94,616 | 100.0 | ||||
| Turnout | ||||||
| Republican gain from Democratic | ||||||
1950[]
| Party | Candidate | Votes | % | |
|---|---|---|---|---|
| Republican | Thomas H. Werdel (Incumbent) | 59,313 | 53.6 | |
| Democratic | Harlan Hagen | 51,409 | 46.4 | |
| Total votes | 110,722 | 100.0 | ||
| Turnout | ||||
| Republican hold | ||||
1952[]
| Party | Candidate | Votes | % | |
|---|---|---|---|---|
| Republican | Charles S. Gubser | 106,375 | 59.2 | |
| Democratic | Arthur L. Johnson | 70,271 | 39.1 | |
| Progressive | Betsey K. Fisher | 2,939 | 1.7 | |
| Total votes | 179,585 | 100.0 | ||
| Turnout | ||||
| Republican hold | ||||
1954[]
| Party | Candidate | Votes | % | |
|---|---|---|---|---|
| Republican | Charles S. Gubser (Incumbent) | 94,418 | 61.2 | |
| Democratic | Paul V. Birmingham | 59,843 | 38.8 | |
| Total votes | 154,261 | 100.0 | ||
| Turnout | ||||
| Republican hold | ||||
1956[]
| Party | Candidate | Votes | % | |
|---|---|---|---|---|
| Republican | Charles S. Gubser (Incumbent) | 128,891 | 60.7 | |
| Democratic | William H. Vatcher | 83,586 | 39.3 | |
| Total votes | 212,477 | 100.0 | ||
| Turnout | ||||
| Republican hold | ||||
1958[]
| Party | Candidate | Votes | % | |
|---|---|---|---|---|
| Republican | Charles S. Gubser (Incumbent) | 118,715 | 54.6 | |
| Democratic | Russell B. Bryan | 98,894 | 45.4 | |
| Total votes | 217,609 | 100.0 | ||
| Turnout | ||||
| Republican hold | ||||
1960[]
| Party | Candidate | Votes | % | |
|---|---|---|---|---|
| Republican | Charles S. Gubser (Incumbent) | 170,063 | 58.9 | |
| Democratic | Russell B. Bryan | 118,520 | 41.1 | |
| Total votes | 288,583 | 100.0 | ||
| Turnout | ||||
| Republican hold | ||||
1962[]
| Party | Candidate | Votes | % | |
|---|---|---|---|---|
| Republican | Charles S. Gubser (Incumbent) | 106,419 | 57.4 | |
| Democratic | James P. Thurber Jr. | 68,885 | 42.6 | |
| Total votes | 175,304 | 100.0 | ||
| Turnout | ||||
| Republican hold | ||||
1964[]
| Party | Candidate | Votes | % | |
|---|---|---|---|---|
| Republican | Charles S. Gubser (Incumbent) | 151,027 | 63.1 | |
| Democratic | E. Day Carman | 88,240 | 36.9 | |
| Total votes | 239,267 | 100.0 | ||
| Turnout | ||||
| Republican hold | ||||
1966[]
| Party | Candidate | Votes | % | |
|---|---|---|---|---|
| Republican | Charles S. Gubser (Incumbent) | 156,549 | 69.1 | |
| Democratic | George Leppert | 70,013 | 30.9 | |
| Total votes | 226,562 | 100.0 | ||
| Turnout | ||||
| Republican hold | ||||
1968[]
| Party | Candidate | Votes | % | |
|---|---|---|---|---|
| Republican | Charles S. Gubser (Incumbent) | 160,204 | 67.3 | |
| Democratic | Grayson S. Taketa | 73,530 | 30.9 | |
| Peace and Freedom | Martin L. Primach | 4,276 | 1.8 | |
| Total votes | 238,010 | 100.0 | ||
| Turnout | ||||
| Republican hold | ||||
1970[]
| Party | Candidate | Votes | % | |
|---|---|---|---|---|
| Republican | Charles S. Gubser (Incumbent) | 135,864 | 62.0 | |
| Democratic | Stuart. D. McLean | 80,530 | 36.8 | |
| American Independent | Joyce W. Stancliffe | 2,651 | 1.2 | |
| Total votes | 219,045 | 100.0 | ||
| Turnout | ||||
| Republican hold | ||||
1972[]
| Party | Candidate | Votes | % | |
|---|---|---|---|---|
| Republican | Charles S. Gubser (Incumbent) | 139,850 | 64.6 | |
| Democratic | B. Frank Gillette | 76,597 | 35.4 | |
| Total votes | 216,447 | 100.0 | ||
| Turnout | ||||
| Republican hold | ||||
1974[]
| Party | Candidate | Votes | % | |||
|---|---|---|---|---|---|---|
| Democratic | Don Edwards (Incumbent) | 86,014 | 77.0 | |||
| Republican | Herb Smith | 25,678 | 23.0 | |||
| Total votes | 111,692 | 100 | ||||
| Turnout | ||||||
| Democratic gain from Republican | ||||||
1976[]
| Party | Candidate | Votes | % | |
|---|---|---|---|---|
| Democratic | Don Edwards (Incumbent) | 111,992 | 72.0 | |
| Republican | Herb Smith | 38,088 | 24.5 | |
| American Independent | Edmon V. Kaiser | 5,363 | 3.5 | |
| Total votes | 155,443 | 100.0 | ||
| Turnout | ||||
| Democratic hold | ||||
1978[]
| Party | Candidate | Votes | % | |
|---|---|---|---|---|
| Democratic | Don Edwards (Incumbent) | 84,488 | 67.1 | |
| Republican | Rudy Hansen | 41,374 | 32.9 | |
| Total votes | 125,862 | 100.0 | ||
| Turnout | ||||
| Democratic hold | ||||
1980[]
| Party | Candidate | Votes | % | |
|---|---|---|---|---|
| Democratic | Don Edwards (Incumbent) | 102,231 | 62.1 | |
| Republican | Joseph M. Lutton | 45,987 | 27.9 | |
| Libertarian | Joseph Fuhrig | 11,904 | 7.2 | |
| American Independent | Edmon V. Kaiser | 4,421 | 2.7 | |
| Total votes | 164,543 | 100.0 | ||
| Turnout | ||||
| Democratic hold | ||||
1982[]
| Party | Candidate | Votes | % | |
|---|---|---|---|---|
| Democratic | Don Edwards (Incumbent) | 77,263 | 62.7 | |
| Republican | Bob Herriott | 41,506 | 33.7 | |
| Libertarian | Dale Burrow | 2,403 | 1.9 | |
| American Independent | Edmon V. Kaiser | 2,109 | 1.7 | |
| Total votes | 123,281 | 100.0 | ||
| Turnout | ||||
| Democratic hold | ||||
1984[]
| Party | Candidate | Votes | % | |
|---|---|---|---|---|
| Democratic | Don Edwards (Incumbent) | 102,469 | 62.4 | |
| Republican | Bob Herriott | 56,256 | 34.3 | |
| Libertarian | Perr Cardestam | 2,789 | 1.7 | |
| American Independent | Edmon V. Kaiser | 2,663 | 1.6 | |
| Total votes | 164,177 | 100.0 | ||
| Turnout | ||||
| Democratic hold | ||||
1986[]
| Party | Candidate | Votes | % | |
|---|---|---|---|---|
| Democratic | Don Edwards (Incumbent) | 84,240 | 70.5 | |
| Republican | Michael R. La Crone | 31,826 | 26.6 | |
| Libertarian | Perr Cardestam | 1,797 | 1.5 | |
| Peace and Freedom | Bradley L. Mayer | 1,701 | 1.4 | |
| Total votes | 119,564 | 100.0 | ||
| Turnout | ||||
| Democratic hold | ||||
1988[]
| Party | Candidate | Votes | % | |
|---|---|---|---|---|
| Democratic | Don Edwards (Incumbent) | 142,500 | 86.2 | |
| Libertarian | Kennita Watson | 22,801 | 13.8 | |
| Total votes | 165,301 | 100.0 | ||
| Turnout | ||||
| Democratic hold | ||||
1990[]
| Party | Candidate | Votes | % | |
|---|---|---|---|---|
| Democratic | Don Edwards (Incumbent) | 81,875 | 62.7 | |
| Republican | Mark Patrosso | 48,747 | 37.3 | |
| No party | James (write-in) | 15 | 0.0 | |
| Total votes | 130,637 | 100.0 | ||
| Turnout | ||||
| Democratic hold | ||||
1992[]
| Party | Candidate | Votes | % | ||
|---|---|---|---|---|---|
| Republican | Bill Baker | 145,702 | 52.0 | ||
| Democratic | Wendell H. Williams | 134,635 | 48.0 | ||
| No party | Williams (write-in) | 55 | 0.0 | ||
| No party | Janloia (write-in) | 37 | 0.0 | ||
| Total votes | 280,429 | 100 | |||
| Turnout | |||||
| Republican win (new seat) | |||||
1994[]
| Party | Candidate | Votes | % | |
|---|---|---|---|---|
| Republican | Bill Baker (Incumbent) | 138,916 | 59.30 | |
| Democratic | 90,523 | 38.65 | ||
| Peace and Freedom | Craig W. Cooper | 4,802 | 2.05 | |
| Total votes | 234,241 | 100.0 | ||
| Turnout | ||||
| Republican hold | ||||
1996[]
| Party | Candidate | Votes | % | |||
|---|---|---|---|---|---|---|
| Democratic | Ellen Tauscher | 137,726 | 48.7 | |||
| Republican | Bill Baker (Incumbent) | 133,633 | 47.2 | |||
| Reform | John Place | 6,354 | 2.3 | |||
| Natural Law | Valerie Janlois | 3,047 | 1.0 | |||
| Libertarian | Gregory Lyon | 2,423 | 0.8 | |||
| Total votes | 283,183 | 100.0 | ||||
| Turnout | ||||||
| Democratic gain from Republican | ||||||
1998[]
| Party | Candidate | Votes | % | |
|---|---|---|---|---|
| Democratic | Ellen Tauscher (Incumbent) | 127,134 | 53.46 | |
| Republican | Charles Ball | 103,299 | 43.44 | |
| Natural Law | Valerie Janlois | 3,941 | 1.66 | |
| Reform | John Place | 3,435 | 1.44 | |
| Total votes | 237,809 | 100.0 | ||
| Turnout | ||||
| Democratic hold | ||||
2000[]
| Party | Candidate | Votes | % | |
|---|---|---|---|---|
| Democratic | Ellen Tauscher (Incumbent) | 160,429 | 52.7 | |
| Republican | Claude B. Hutchison Jr. | 134,863 | 44.2 | |
| Natural Law | Valerie Janlois | 9,527 | 3.1 | |
| Total votes | 304,819 | 100.0 | ||
| Turnout | ||||
| Democratic hold | ||||
2002[]
| Party | Candidate | Votes | % | |
|---|---|---|---|---|
| Democratic | Ellen Tauscher (Incumbent) | 123,481 | 75.6 | |
| Libertarian | Sonia E. Alonso Harden | 39,858 | 24.4 | |
| Total votes | 163,339 | 100.0 | ||
| Turnout | ||||
| Democratic hold | ||||
2004[]
| Party | Candidate | Votes | % | |
|---|---|---|---|---|
| Democratic | Ellen Tauscher (Incumbent) | 182,750 | 65.8 | |
| Republican | Jeff Ketelson | 95,349 | 34.2 | |
| Total votes | 278,099 | 100.0 | ||
| Turnout | ||||
| Democratic hold | ||||
2006[]
| Party | Candidate | Votes | % | |
|---|---|---|---|---|
| Democratic | Ellen Tauscher (Incumbent) | 130,859 | 66.5 | |
| Republican | Darcy Linn | 66,069 | 33.5 | |
| Republican | Jeff Ketelson (write-in) | 50 | 0.0 | |
| Total votes | 196,978 | 100.0 | ||
| Turnout | ||||
| Democratic hold | ||||
2008[]
| Party | Candidate | Votes | % | |
|---|---|---|---|---|
| Democratic | Ellen Tauscher (Incumbent) | 192,226 | 65.2 | |
| Republican | Nicholas Gerber | 91,877 | 31.1 | |
| Peace and Freedom | Eugene E. Ruyle | 11,062 | 3.7 | |
| Total votes | 295,165 | 100.0 | ||
| Turnout | ||||
| Democratic hold | ||||
2009 (Special)[]
| Party | Candidate | Votes | % | |
|---|---|---|---|---|
| Democratic | John Garamendi | 72,817 | 52.85 | |
| Republican | David Harmer | 59,017 | 42.83 | |
| Green | Jeremy Cloward | 2,515 | 1.83 | |
| Peace and Freedom | Mary McIlroy | 1,846 | 1.34 | |
| American Independent | Jerome Denham | 1,591 | 1.15 | |
| Total votes | 137,786 | 100.00 | ||
| Turnout | 35.33 | |||
| Democratic hold | ||||
2010[]
| Party | Candidate | Votes | % | |
|---|---|---|---|---|
| Democratic | John Garamendi (Incumbent) | 137,578 | 58.9 | |
| Republican | Gary Clift | 88,512 | 37.8 | |
| Green | Jeremy Cloward | 7,716 | 3.3 | |
| Total votes | 233,806 | 100.0 | ||
| Turnout | ||||
| Democratic hold | ||||
2012[]
| Party | Candidate | Votes | % | |
|---|---|---|---|---|
| Republican | Jeff Denham | 110,265 | 52.7 | |
| Democratic | José M. Hernández | 98,934 | 47.3 | |
| Total votes | 209,199 | 100.0 | ||
| Turnout | ||||
| Republican hold | ||||
2014[]
| Party | Candidate | Votes | % | |
|---|---|---|---|---|
| Republican | Jeff Denham (Incumbent) | 70,582 | 56% | |
| Democratic | Michael Eggman | 55,123 | 44% | |
| Total votes | 125,705 | 100.0% | ||
| Turnout | ||||
| Republican hold | ||||
2016[]
| Party | Candidate | Votes | % | |
|---|---|---|---|---|
| Republican | Jeff Denham (Incumbent) | 124,671 | 51.7 | |
| Democratic | Michael Eggman | 116,470 | 48.3 | |
| Total votes | 241,141 | 100.0 | ||
| Republican hold | ||||
2018[]
| Primary election | ||||
|---|---|---|---|---|
| Party | Candidate | Votes | % | |
| Republican | Jeff Denham (Incumbent) | 45,719 | 37.5 | |
| Democratic | Josh Harder | 20,742 | 17.0 | |
| Republican | Ted D. Howze | 17,723 | 14.6 | |
| Democratic | Michael Eggman | 12,446 | 10.2 | |
| Democratic | Virginia Madueño | 11,178 | 9.2 | |
| Democratic | Sue Zwahlen | 9,945 | 8.2 | |
| Democratic | Michael J. "Mike" Barkley | 2,904 | 2.4 | |
| Democratic | Dotty Nygard (withdrawn) | 1,100 | 0.9 | |
| Total votes | 121,757 | 100.0 | ||
| General election | ||||
| Democratic | Josh Harder | 115,945 | 52.3 | |
| Republican | Jeff Denham (Incumbent) | 105,955 | 47.7 | |
| Total votes | 221,900 | 100.0 | ||
| Democratic gain from Republican | ||||
2020[]
| Party | Candidate | Votes | % | |
|---|---|---|---|---|
| Democratic | Josh Harder (Incumbent) | 166,865 | 55.2 | |
| Republican | Ted Howze | 135,629 | 44.8 | |
| Total votes | 302,494 | 100.0 | ||
| Democratic hold | ||||
See also[]
- List of United States congressional districts
References[]
- ^ Center for New Media & Promotion (CNMP), US Census Bureau. "My Congressional District". www.census.gov.
- ^ "Introducing the 2021 Cook Political Report Partisan Voter Index". The Cook Political Report. April 15, 2021. Retrieved April 15, 2021.
- ^ a b "Maps: Final Congressional Districts". Citizens Redistricting Commission. Archived from the original on March 10, 2013. Retrieved February 24, 2013.
- ^ "Ellen Tauscher is the Grand Dame of CD-10". May 18, 2015. Archived from the original on May 18, 2015.
- ^ See Politics of California#Bi-partisan gerrymandering
- ^ "Tauscher accepts State Department post". March 18, 2009.
- ^ "Archived copy". Archived from the original on April 10, 2009. Retrieved June 14, 2009.
{{cite web}}: CS1 maint: archived copy as title (link) - ^ Stannard, Matthew (June 25, 2009). "Rep. Tauscher new U.S. arms control chief". San Francisco Chronicle. Retrieved June 25, 2009.
- ^ "Map Viewer". We Draw the Lines CA. Retrieved January 22, 2022.
- ^ https://elections.cdn.sos.ca.gov/sov/1994-general/ssov/governor-congress-district.pdf
- ^ https://elections.cdn.sos.ca.gov/sov/1994-general/ssov/us-senate-congress-district.pdf
- ^ https://elections.cdn.sos.ca.gov/sov/1996-general/ssov/president-congress-district.pdf
- ^ (PDF). September 29, 2011 https://web.archive.org/web/20110929224728/http://www.sos.ca.gov/elections/sov/1998-general/ssov/gov-cd.pdf#. Archived from the original (PDF) on September 29, 2011.
{{cite web}}: Missing or empty|title=(help) - ^ (PDF). September 29, 2011 https://web.archive.org/web/20110929224732/http://www.sos.ca.gov/elections/sov/1998-general/ssov/sen-cd.pdf#. Archived from the original (PDF) on September 29, 2011.
{{cite web}}: Missing or empty|title=(help) - ^ "Statement of Vote (2000 President)" (PDF). Archived from the original (PDF) on June 11, 2007.
- ^ "Statement of Vote (2000 Senator)" (PDF). Archived from the original (PDF) on June 11, 2007.
- ^ "Statement of Vote (2002 Governor)" (PDF). Archived from the original (PDF) on November 11, 2010.
- ^ "Statement of Vote (2003 Recall Question)" (PDF). Archived from the original (PDF) on May 20, 2011.
- ^ "Statement of Vote (2003 Governor)" (PDF). Archived from the original (PDF) on May 20, 2011.
- ^ "Statement of Vote (2004 President)" (PDF). Archived from the original (PDF) on August 1, 2010.
- ^ "Statement of Vote (2004 Senator)" (PDF). Archived from the original (PDF) on August 10, 2011.
- ^ "Statement of Vote (2006 Governor)" (PDF). Archived from the original (PDF) on August 10, 2011.
- ^ "Statement of Vote (2006 Senator)" (PDF). Archived from the original (PDF) on August 10, 2011.
- ^ "(2008 President)". Archived from the original on February 11, 2009.
- ^ Supplement to the Statement of Vote - Counties by Congressional Districts for United States Senator
- ^ Supplement to the Statement of Vote - Counties by Congressional Districts for Governor
- ^ Supplement to the Statement of Vote - Counties by Congressional Districts for United States Senator
- ^ J. Miles Coleman. "California's 2018 statewide races by congressional district". twitter.com. Retrieved January 6, 2018.
- ^ Supplement to the Statement of Vote - Counties by Congressional Districts for United States Senator
- ^ California Secretary of State. Registration by US Congressional District, Report of Registration-May 21, 2018. https://www.sos.ca.gov/elections/report-registration/15day-primary-2018/
- ^ "CA District 10 - Special Election". Our Campaigns. Retrieved January 23, 2022.
- ^ "1920 election results" (PDF).
- ^ "1922 election results" (PDF).
- ^ "JoinCalifornia - 05-01-1923 Election". www.joincalifornia.com.
- ^ "CA District 10 - Special Election". Our Campaigns. Retrieved January 23, 2022.
- ^ "1924 election results" (PDF).
- ^ "1926 election results" (PDF).
- ^ "1928 election results" (PDF).
- ^ "1930 election results" (PDF).
- ^ "1932 election results" (PDF).
- ^ "1934 election results" (PDF).
- ^ "1936 election results" (PDF).
- ^ "JoinCalifornia - 05-04-1937 Election". www.joincalifornia.com.
- ^ "CA District 10 - Special Election". Our Campaigns. Retrieved January 23, 2022.
- ^ "1938 election results" (PDF).
- ^ "1940 election results" (PDF).
- ^ "1942 election results" (PDF).
- ^ "1944 election results" (PDF).
- ^ "1946 election results" (PDF).
- ^ "1948 election results" (PDF).
- ^ "1950 election results" (PDF).
- ^ "1952 election results" (PDF).
- ^ "1954 election results" (PDF).
- ^ "1956 election results" (PDF).
- ^ "1958 election results" (PDF).
- ^ "1960 election results" (PDF).
- ^ "1962 election results" (PDF).
- ^ "1964 election results" (PDF).
- ^ "1966 election results" (PDF).
- ^ "1968 election results" (PDF).
- ^ "1970 election results" (PDF).
- ^ "1972 election results" (PDF).
- ^ "1974 election results" (PDF).
- ^ "1976 election results" (PDF).
- ^ "1978 election results" (PDF).
- ^ "1980 election results" (PDF).
- ^ "1982 election results" (PDF).
- ^ "1984 election results" (PDF).
- ^ "1986 election results" (PDF).
- ^ "1988 election results" (PDF).
- ^ "1990 election results" (PDF).
- ^ "1992 election results" (PDF).
- ^ "1994 election results" (PDF).
- ^ "1996 election results" (PDF).
- ^ "1998 election results" (PDF).
- ^ "2000 election results" (PDF).
- ^ "2002 general election results" (PDF). Archived from the original (PDF) on February 3, 2009.
- ^ "2004 general election results" (PDF).
- ^ "2006 general election results" (PDF). Archived from the original (PDF) on November 27, 2008.
- ^ "2008 general election results" (PDF). Archived from the original (PDF) on December 21, 2008.
- ^ "Official Canvass: United States Representative 10th Congressional District Special General Election, November 3, 2009" (PDF). Secretary of State of California. November 16, 2009. Archived from the original (PDF) on November 19, 2009. Retrieved November 16, 2009.
- ^ "2010 general election results" (PDF). Archived from the original (PDF) on May 20, 2011.
- ^ a b "2012 general election results" (PDF). Archived from the original (PDF) on October 19, 2013.
- ^ "Election 2020 | California Secretary of State". www.sos.ca.gov.
External links[]
- GovTrack.us: California's 10th congressional district
- RAND California Election Returns: District Definitions (out of date)
- California Voter Foundation map - CD10 (out of date)
Coordinates: 37°36′N 121°00′W / 37.6°N 121.0°W

- Congressional districts of California
- Government of San Joaquin County, California
- Government of Stanislaus County, California
- San Joaquin Valley
- Ceres, California
- Modesto, California
- Oakdale, California
- Tracy, California
- Turlock, California
- Constituencies established in 1913
- 1913 establishments in California