California's 7th congressional district
| California's 7th congressional district | |||
|---|---|---|---|
 California's 7th congressional district since January 3, 2013 | |||
| Representative |
| ||
| Population (2019) | 756,668 | ||
| Median household income | $77,786[1] | ||
| Ethnicity |
| ||
| Cook PVI | D+5[2] | ||
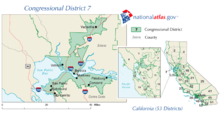
California's 7th congressional district is a United States congressional district in California.
Ami Bera, a Democrat, has represented the district since January 2013. Currently, it encompasses most of the eastern and southern suburbs of Sacramento, including Elk Grove, Folsom and Rancho Cordova. It is entirely within Sacramento County.
From 2003 to 2013, the 7th district encompassed the northwestern East Bay, Vacaville, and a lightly-populated strip connecting the two. It consisted of portions of Solano and Contra Costa counties. Since redistricting by the California Citizens Redistricting Commission in 2011, that territory is now split between the 5th, 11th, and 3rd districts. Meanwhile, most of the current 7th had been the 3rd district prior to 2013.
Competitiveness[]
The old 7th had been a solidly Democratic district, like most districts in the Bay Area. However, the new 7th is one of the more competitive districts in California. When it was created, it was rated "EVEN" by the Cook Partisan Voting Index.
Voter registration[]
Registered voter statistics comes from the California Secretary of State:
| Political Party | Registered Voter Percentage |
|---|---|
| American Independent | 3.20 |
| Democratic | 38.99 |
| Green | 0.43 |
| Libertarian | 0.95 |
| No Party Preference | 22.33 |
| Other | 0.18 |
| Peace and Freedom | 0.47 |
| Republican | 33.45 |
Election results from statewide races[]
| Year | Office | Results |
|---|---|---|
| 1992 | President | Clinton 60.8 - 22.3% |
| Senator | Boxer 63.2 - 27.4% | |
| Senator | Feinstein 70.0 - 23.7% | |
| 1994 | Governor | [data unknown/missing] |
| Senator | [data unknown/missing] | |
| 1996 | President | [data unknown/missing] |
| 1998 | Governor | [data unknown/missing] |
| Senator | [data unknown/missing] | |
| 2000 | President[3] | Gore 68.7 - 26.8% |
| Senator[4] | Feinstein 69.0 - 24.4% | |
| 2002 | Governor[5] | Davis 59.7 - 29.1% |
| 2003 | Recall[6][7] | No 60.8 - 39.2% |
| Bustamante 44.3 - 34.5% | ||
| 2004 | President[8] | Kerry 67.1 - 31.8% |
| Senator[9] | Boxer 69.3 - 26.9% | |
| 2006 | Governor[10] | Angelides 50.4 - 44.0% |
| Senator[11] | Feinstein 71.0 - 23.6% | |
| 2008 | President[12] | Obama 71.4 - 26.4% |
| 2010 | Governor | Brown 67.1 - 28.3% |
| Senator | Boxer 65.4 - 29.4% | |
| 2012 | President[13] | Obama 50.8 - 46.8% |
| Senator | Feinstein 53.5 - 46.5% | |
| 2014 | Governor | Brown 56.2 - 43.8% |
| 2016 | President | Clinton 52.3 - 40.9% |
| Senator | Harris 65.3 - 34.7% | |
| 2018 | Governor | Newsom 52.0 - 48.0% |
| Senator | Feinstein 50.7 - 49.3% | |
| 2020 | President | Biden 55.6 - 41.9% |
List of representatives[]
| Representative | Party | Dates | Cong ress(es) |
Notes | Counties |
|---|---|---|---|---|---|
| District created on March 4, 1893 | |||||
 William W. Bowers William W. Bowers
|
Republican | March 4, 1893 – March 3, 1897 |
53rd 54th |
Redistricted from the 6th district and re-elected in 1892. Re-elected in 1894. Lost re-election. |
Fresno, Kern, Kings, Madera, Merced, Orange, Riverside, San Benito, San Bernardino, San Diego, Stanislaus, Tulare |
 Curtis H. Castle Curtis H. Castle
|
Populist | March 4, 1897 – March 3, 1899 |
55th | Elected in 1896. Lost re-election.. | |
 James C. Needham James C. Needham
|
Republican | March 4, 1899 – March 3, 1903 |
56th 57th |
Elected in 1898. Re-elected in 1900. Redistricted to the 6th district. | |
 James McLachlan James McLachlan
|
Republican | March 4, 1903 – March 3, 1911 |
58th 59th 60th 61st |
Redistricted from the 6th district and re-elected in 1902. Re-elected in 1904. Re-elected in 1906. Re-elected in 1908. Lost renomination. |
Los Angeles County |
 William Stephens William Stephens
|
Republican | March 4, 1911 – March 3, 1913 |
62nd | Elected in 1910. Redistricted to the 10th district. | |
 Denver S. Church Denver S. Church
|
Democratic | March 4, 1913 – March 3, 1919 |
63rd 64th 65th |
Elected in 1912. Re-elected in 1914. Re-elected in 1916. Retired. |
Fresno, Kern, Kings, Madera, Merced, Stanislaus, Tulare |
 Henry E. Barbour Henry E. Barbour
|
Republican | March 4, 1919 – March 3, 1933 |
66th 67th 68th 69th 70th 71st 72nd |
Elected in 1918. Re-elected in 1920. Re-elected in 1922. Re-elected in 1924. Re-elected in 1926. Re-elected in 1928. Re-elected in 1930. Lost re-election. | |
 Ralph R. Eltse Ralph R. Eltse
|
Republican | March 4, 1933 – January 3, 1935 |
73rd | Elected in 1932. Lost re-election. |
Alameda, Contra Costa |
 John H. Tolan John H. Tolan
|
Democratic | January 3, 1935 – January 3, 1943 |
74th 75th 76th 77th |
Elected in 1934. Re-elected in 1936. Re-elected in 1938. Re-elected in 1940. Re-elected in 1942. Re-elected in 1944. | |
| January 3, 1943 – January 3, 1947 |
78th 79th |
Alameda (Oakland) | |||
 John J. Allen Jr. John J. Allen Jr.
|
Republican | January 3, 1947 – January 3, 1959 |
80th 81st 82nd 83rd 84th 85th |
Elected in 1946. Re-elected in 1948. Re-elected in 1950. Re-elected in 1952. Re-elected in 1954. Re-elected in 1956. Lost re-election. | |
 Jeffery Cohelan Jeffery Cohelan
|
Democratic | January 3, 1959 – January 3, 1971 |
86th 87th 88th 89th 90th 91st |
Elected in 1958. Re-elected in 1960. Re-elected in 1962. Re-elected in 1964. Re-elected in 1966. Re-elected in 1968. Lost re-nomination. | |
 Ron Dellums Ron Dellums
|
Democratic | January 3, 1971 – January 3, 1975 |
92nd 93rd |
Elected in 1970. Re-elected in 1972. Redistricted to the 8th district. | |
 George Miller George Miller
|
Democratic | January 3, 1975 – January 3, 1983 |
94th 95th 96th 97th |
Elected in 1974. Re-elected in 1976. Re-elected in 1978. Re-elected in 1980. |
Contra Costa |
| January 3, 1983 – January 3, 1993 |
98th 99th 100th 101st 102nd |
Re-elected in 1982. Re-elected in 1984. Re-elected in 1986. Re-elected in 1988. Re-elected in 1990. |
Most of Contra Costa | ||
| January 3, 1993 – January 3, 2003 |
103rd 104th 105th 106th 107th |
Re-elected in 1992. Re-elected in 1994. Re-elected in 1996. Re-elected in 1998. Re-elected in 2000. |
Northwest Contra Costa, southwest Solano | ||
| January 3, 2003 – January 3, 2013 |
108th 109th 110th 111th 112th |
Re-elected in 2002. Re-elected in 2004 Re-elected in 2006. Re-elected in 2008. Re-elected in 2010. Redistricted to the 11th district |
Northern Contra Costa, western Solano | ||
 Ami Bera Ami Bera
|
Democratic | January 3, 2013 – present |
113th 114th 115th 116th 117th |
Elected in 2012. Re-elected in 2014. Re-elected in 2016. Re-elected in 2018. Re-elected in 2020. |
Eastern Sacramento County |
Election results for representatives[]
|
1892 • 1894 • 1896 • 1898 • 1900 • 1902 • 1904 • 1906 • 1908 • 1910 • 1912 • 1914 • 1916 • 1918 • 1920 • 1922 • 1924 • 1926 • 1928 • 1930 • 1932 • 1934 • 1936 • 1938 • 1940 • 1942 • 1944 • 1946 • 1948 • 1950 • 1952 • 1954 • 1956 • 1958 • 1960 • 1962 • 1964 • 1966 • 1968 • 1970 • 1972 • 1974 • 1976 • 1978 • 1980 • 1982 • 1984 • 1986 • 1988 • 1990 • 1992 • 1994 • 1996 • 1998 • 2000 • 2002 • 2004 • 2006 • 2008 • 2010 • 2012 • 2014 • 2016 • 2018 • 2020 |
1892[]
| Party | Candidate | Votes | % | |
|---|---|---|---|---|
| Republican | William W. Bowers (inc.) | 15,856 | 41.6 | |
| Democratic | Olin Welborn | 14,869 | 39.0 | |
| Populist | Hiram Hamilton | 5,578 | 14.6 | |
| Prohibition | M. B. Harris | 1,844 | 4.8 | |
| Total votes | 38,147 | 100.0 | ||
| Turnout | ||||
| Republican hold | ||||
1894[]
| Party | Candidate | Votes | % | |
|---|---|---|---|---|
| Republican | William W. Bowers (inc.) | 18,434 | 42.9 | |
| Democratic | W. H. Alford | 12,111 | 28.2 | |
| Populist | J. L. Gilbert | 10,719 | 25.0 | |
| Prohibition | W. H. Somers | 1,669 | 3.9 | |
| Total votes | 42,933 | 100.0 | ||
| Turnout | ||||
| Republican hold | ||||
1896[]
| Party | Candidate | Votes | % | |||
|---|---|---|---|---|---|---|
| Populist | Curtis H. Castle | 19,183 | 46.7 | |||
| Republican | William W. Bowers (inc.) | 18,939 | 46.1 | |||
| Independent | William H. "Billy" Carlson | 2,139 | 5.2 | |||
| Prohibition | James W. Webb | 802 | 2.0 | |||
| Total votes | 41,063 | 100.0 | ||||
| Turnout | ||||||
| Populist gain from Republican | ||||||
1898[]
| Party | Candidate | Votes | % | |||
|---|---|---|---|---|---|---|
| Republican | James C. Needham | 20,793 | 50.1 | |||
| Populist | Curtis H. Castle (incumbent) | 20,680 | 49.9 | |||
| Total votes | 41,473 | 100.0 | ||||
| Turnout | ||||||
| Republican gain from Populist | ||||||
1900[]
| Party | Candidate | Votes | % | |
|---|---|---|---|---|
| Republican | James C. Needham (inc.) | 23,450 | 52.4 | |
| Democratic | W. D. Crichton | 18,981 | 42.4 | |
| Socialist | Noble A. Richardson | 1,385 | 3.1 | |
| Prohibition | A. H. Hensley | 919 | 2.1 | |
| Total votes | 44,735 | 100.0 | ||
| Turnout | ||||
| Republican hold | ||||
1902[]
| Party | Candidate | Votes | % | |
|---|---|---|---|---|
| Republican | James McLachlan (inc.) | 19,407 | 64.8 | |
| Democratic | Carl A. Johnson | 8,075 | 27.0 | |
| Socialist | George H. Hewes | 1,261 | 4.2 | |
| Prohibition | Frederick F. Wheeler | 1,195 | 4.0 | |
| Total votes | 30,638 | 100.0 | ||
| Turnout | ||||
| Republican hold | ||||
1904[]
| Party | Candidate | Votes | % | |
|---|---|---|---|---|
| Republican | James McLachlan (inc.) | 31,091 | 64.2 | |
| Democratic | W. O. Morton | 11,259 | 23.3 | |
| Socialist | F. I. Wheat | 3,594 | 7.4 | |
| Prohibition | John Sobieski | 2,467 | 5.1 | |
| Total votes | 48,411 | 100.0 | ||
| Turnout | ||||
| Republican hold | ||||
1906[]
| Party | Candidate | Votes | % | |
|---|---|---|---|---|
| Republican | James McLachlan (inc.) | 22,338 | 56.8 | |
| Democratic | Robert G. Laucks | 11,197 | 28.4 | |
| Socialist | Claude Riddle | 3,641 | 9.2 | |
| Prohibition | Levi D. Johnson | 2,189 | 5.6 | |
| Total votes | 39,365 | 100.0 | ||
| Turnout | ||||
| Republican hold | ||||
1908[]
| Party | Candidate | Votes | % | |
|---|---|---|---|---|
| Republican | James McLachlan (inc.) | 37,244 | 51.9 | |
| Democratic | Jud R. Rush | 25,445 | 35.4 | |
| Socialist | A. R. Holston | 4,432 | 6.2 | |
| Prohibition | Marshall W. Atwood | 3,899 | 5.4 | |
| Independence League | F. G. Hentig | 791 | 1.1 | |
| Total votes | 71,811 | 100.0 | ||
| Turnout | ||||
| Republican hold | ||||
1910[]
| Party | Candidate | Votes | % | |
|---|---|---|---|---|
| Republican | William Stephens (incumbent) | 36,435 | 58.7 | |
| Democratic | Lorin A. Handley | 13,340 | 21.5 | |
| Socialist | Thomas V. Williams | 10,305 | 16.6 | |
| Prohibition | C. V. LeFontaine | 1,990 | 3.2 | |
| Total votes | 62,070 | 100.0 | ||
| Turnout | ||||
| Republican hold | ||||
1912[]
| Party | Candidate | Votes | % | |
|---|---|---|---|---|
| Democratic | Denver S. Church (inc.) | 23,752 | 44.0 | |
| Republican | James C. Needham | 22,994 | 42.7 | |
| Socialist | J. S. Cato | 7,171 | 13.3 | |
| Total votes | 53,917 | 100.0 | ||
| Turnout | ||||
| Democratic hold | ||||
1914[]
| Party | Candidate | Votes | % | |
|---|---|---|---|---|
| Democratic | Denver S. Church (inc.) | 39,389 | 49.9 | |
| Republican | A. M. Drew | 25,106 | 31.8 | |
| Socialist | Harry M. McKee | 7,797 | 9.9 | |
| Prohibition | Don A. Allen | 6,573 | 8.3 | |
| Total votes | 78,865 | 100.0 | ||
| Turnout | ||||
| Democratic hold | ||||
1916[]
| Party | Candidate | Votes | % | |
|---|---|---|---|---|
| Democratic | Denver S. Church (inc.) | 38,787 | 51.0 | |
| Republican | W. W. Phillips | 27,676 | 36.4 | |
| Socialist | Harry M. McKee | 5,492 | 7.2 | |
| Prohibition | J. F. Butler | 4,042 | 5.3 | |
| Total votes | 75,997 | 100.0 | ||
| Turnout | ||||
| Democratic hold | ||||
1918[]
| Party | Candidate | Votes | % | |||
|---|---|---|---|---|---|---|
| Republican | Henry E. Barbour | 33,476 | 52.1 | |||
| Democratic | Henry Hawson | 30,745 | 47.9 | |||
| Total votes | 64,221 | 100.0 | ||||
| Turnout | ||||||
| Republican gain from Democratic | ||||||
1920[]
| Party | Candidate | Votes | % | |
|---|---|---|---|---|
| Republican | Henry E. Barbour (incumbent) | 57,647 | 87.2 | |
| Socialist | Harry M. McKee | 8,449 | 12.8 | |
| Total votes | 66,096 | 100.0 | ||
| Turnout | ||||
| Republican hold | ||||
1922[]
| Party | Candidate | Votes | % | |
|---|---|---|---|---|
| Republican | Henry E. Barbour (incumbent) | 67,000 | 100.0 | |
| Turnout | ||||
| Republican hold | ||||
1924[]
| Party | Candidate | Votes | % | |
|---|---|---|---|---|
| Republican | Henry E. Barbour (incumbent) | 65,740 | 100.0 | |
| Turnout | ||||
| Republican hold | ||||
1926[]
| Party | Candidate | Votes | % | |
|---|---|---|---|---|
| Republican | Henry E. Barbour (incumbent) | 73,271 | 100.0 | |
| Turnout | ||||
| Republican hold | ||||
1928[]
| Party | Candidate | Votes | % | |
|---|---|---|---|---|
| Republican | Henry E. Barbour (incumbent) | 71,195 | 100.0 | |
| Turnout | ||||
| Republican hold | ||||
1930[]
| Party | Candidate | Votes | % | |
|---|---|---|---|---|
| Republican | Henry E. Barbour (incumbent) | 79,041 | 100.0 | |
| Turnout | ||||
| Republican hold | ||||
1932[]
| Party | Candidate | Votes | % | ||
|---|---|---|---|---|---|
| Republican | Ralph R. Eltse | 45,944 | 45.5 | ||
| Democratic | Frank V. Cornish | 32,365 | 32.0 | ||
| Socialist | J. Stitt Wilson | 22,767 | 22.5 | ||
| Total votes | 101,076 | 100.0 | |||
| Turnout | |||||
| Republican win (new seat) | |||||
1934[]
| Party | Candidate | Votes | % | |||
|---|---|---|---|---|---|---|
| Democratic | John H. Tolan | 51,962 | 52.3 | |||
| Republican | Ralph R. Eltse (incumbent) | 47,414 | 47.7 | |||
| Total votes | 99,376 | 100.0 | ||||
| Turnout | ||||||
| Democratic gain from Republican | ||||||
1936[]
| Party | Candidate | Votes | % | |
|---|---|---|---|---|
| Democratic | John H. Tolan (incumbent) | 69,463 | 59.8 | |
| Republican | Charles W. Fisher | 46,647 | 40.2 | |
| Total votes | 116,110 | 100.0 | ||
| Turnout | ||||
| Democratic hold | ||||
1938[]
| Party | Candidate | Votes | % | |
|---|---|---|---|---|
| Democratic | John H. Tolan (incumbent) | 62,599 | 55.3 | |
| Republican | Charles W. Fisher | 50,504 | 44.7 | |
| Total votes | 113,103 | 100.0 | ||
| Turnout | ||||
| Democratic hold | ||||
1940[]
| Party | Candidate | Votes | % | |
|---|---|---|---|---|
| Democratic | John H. Tolan (incumbent) | 72,838 | 55.5 | |
| Republican | Ralph R. Eltse | 56,808 | 43.2 | |
| Communist | Alfred N. Johnson | 1,707 | 1.3 | |
| Total votes | 131,353 | 100.0 | ||
| Turnout | ||||
| Democratic hold | ||||
1942[]
| Party | Candidate | Votes | % | |
|---|---|---|---|---|
| Democratic | John H. Tolan (incumbent) | 77,292 | 100.0 | |
| Turnout | ||||
| Democratic hold | ||||
1944[]
| Party | Candidate | Votes | % | |||
|---|---|---|---|---|---|---|
| Democratic | John H. Tolan (incumbent) | 81,762 | 57.9 | |||
| Republican | Chelsey M. Walter | 59,360 | 42.1 | |||
| Total votes | 141,122 | 100.0 | ||||
| Turnout | ||||||
| Democratic gain from Republican | ||||||
1946[]
| Party | Candidate | Votes | % | |||
|---|---|---|---|---|---|---|
| Republican | John J. Allen, Jr. | 61,508 | 56.2 | |||
| Democratic | Patrick W. McDonough | 47,988 | 43.8 | |||
| Total votes | 109,496 | 100.0 | ||||
| Turnout | ||||||
| Republican gain from Democratic | ||||||
1948[]
| Party | Candidate | Votes | % | |
|---|---|---|---|---|
| Republican | John J. Allen, Jr. (incumbent) | 78,534 | 51.4 | |
| Democratic | Buell G. Gallagher | 74,318 | 48.6 | |
| Total votes | 152,852 | 100.0 | ||
| Turnout | ||||
| Republican hold | ||||
1950[]
| Party | Candidate | Votes | % | |
|---|---|---|---|---|
| Republican | John J. Allen, Jr. (incumbent) | 74,069 | 55.3 | |
| Democratic | Lyle E. Cook | 59,976 | 44.7 | |
| Total votes | 134,045 | 100.0 | ||
| Turnout | ||||
| Republican hold | ||||
1952[]
| Party | Candidate | Votes | % | |
|---|---|---|---|---|
| Republican | John J. Allen, Jr. (incumbent) | 120,666 | 84.3 | |
| Progressive | John Allen Johnson | 22,408 | 15.7 | |
| Total votes | 142,074 | 100.0 | ||
| Turnout | ||||
| Republican hold | ||||
1954[]
| Party | Candidate | Votes | % | |
|---|---|---|---|---|
| Republican | John J. Allen, Jr. (incumbent) | 64,083 | 53 | |
| Democratic | Stanley K. Crook | 56,807 | 47 | |
| Total votes | 120,890 | 100 | ||
| Turnout | ||||
| Republican hold | ||||
1956[]
| Party | Candidate | Votes | % | |
|---|---|---|---|---|
| Republican | John J. Allen, Jr. (incumbent) | 75,932 | 52.8 | |
| Democratic | Laurance L. Cross | 67,931 | 47.2 | |
| Total votes | 143,863 | 100.0 | ||
| Turnout | ||||
| Republican hold | ||||
1958[]
| Party | Candidate | Votes | % | |||
|---|---|---|---|---|---|---|
| Democratic | Jeffery Cohelan | 65,699 | 50.9 | |||
| Republican | John J. Allen, Jr. (incumbent) | 63,270 | 49.1 | |||
| Total votes | 128,969 | 100.0 | ||||
| Turnout | ||||||
| Democratic gain from Republican | ||||||
1960[]
| Party | Candidate | Votes | % | |
|---|---|---|---|---|
| Democratic | Jeffery Cohelan (incumbent) | 79,776 | 57.1 | |
| Republican | Lewis F. Sherman | 60,065 | 42.9 | |
| Total votes | 139,841 | 100.0 | ||
| Turnout | ||||
| Democratic hold | ||||
1962[]
| Party | Candidate | Votes | % | |
|---|---|---|---|---|
| Democratic | Jeffery Cohelan (incumbent) | 86,215 | 64.5 | |
| Republican | Leonard L. Cantando | 47,409 | 35.5 | |
| Total votes | 133,624 | 100.0 | ||
| Turnout | ||||
| Democratic hold | ||||
1964[]
| Party | Candidate | Votes | % | |
|---|---|---|---|---|
| Democratic | Jeffery Cohelan (incumbent) | 100,901 | 66.1 | |
| Republican | Lawrence E. McNutt | 51,675 | 33.9 | |
| Total votes | 192,576 | 100.0 | ||
| Turnout | ||||
| Democratic hold | ||||
1966[]
| Party | Candidate | Votes | % | |
|---|---|---|---|---|
| Democratic | Jeffery Cohelan (incumbent) | 84,644 | 64.4 | |
| Republican | Malcolm M. Champlin | 46,763 | 35.6 | |
| Total votes | 131,407 | 100.0 | ||
| Turnout | ||||
| Democratic hold | ||||
1968[]
| Party | Candidate | Votes | % | |
|---|---|---|---|---|
| Democratic | Jeffery Cohelan (incumbent) | 102,108 | 62.9 | |
| Republican | Barney E. Hilburn | 48,133 | 29.6 | |
| Peace and Freedom | Huey P. Newton | 12,164 | 7.5 | |
| Total votes | 162,405 | 100.0 | ||
| Turnout | ||||
| Democratic hold | ||||
1970[]
| Party | Candidate | Votes | % | |
|---|---|---|---|---|
| Democratic | Ron Dellums | 89,784 | 57.3 | |
| Republican | John E. Healy | 64,691 | 41.3 | |
| Peace and Freedom | Sarah Scahill | 2,156 | 1.4 | |
| Total votes | 156,631 | 100 | ||
| Turnout | ||||
| Democratic hold | ||||
1972[]
| Party | Candidate | Votes | % | |
|---|---|---|---|---|
| Democratic | Ron Dellums (incumbent) | 126,351 | 60 | |
| Republican | Peter Hannaford | 85,851 | 38 | |
| American Independent | Frank V. Cortese | 13,430 | 2 | |
| Total votes | 225,632 | 100 | ||
| Turnout | ||||
| Democratic hold | ||||
1974[]
| Party | Candidate | Votes | % | |
|---|---|---|---|---|
| Democratic | George Miller | 82,765 | 55.6 | |
| Republican | Gary Fernandez | 66,115 | 44.4 | |
| Total votes | 148,880 | 100.0 | ||
| Turnout | ||||
| Democratic hold | ||||
1976[]
| Party | Candidate | Votes | % | |
|---|---|---|---|---|
| Democratic | George Miller (incumbent) | 147,064 | 74.7 | |
| Republican | Robert L. Vickers | 45,863 | 23.3 | |
| American Independent | Melvin E. Stanley | 3,889 | 2.0 | |
| Total votes | 196,816 | 100.0 | ||
| Turnout | ||||
| Democratic hold | ||||
1978[]
| Party | Candidate | Votes | % | |
|---|---|---|---|---|
| Democratic | George Miller (incumbent) | 109,676 | 63.4 | |
| Republican | Paula Gordon | 58,332 | 33.7 | |
| American Independent | Melvin E. Stanley | 4,857 | 2.8 | |
| Total votes | 172,865 | 100.0 | ||
| Turnout | ||||
| Democratic hold | ||||
1980[]
| Party | Candidate | Votes | % | |
|---|---|---|---|---|
| Democratic | George Miller (incumbent) | 142,044 | 63.3 | |
| Republican | Giles St. Clair | 70,479 | 31.4 | |
| Libertarian | Steve Snow | 6,923 | 3.1 | |
| American Independent | Thomas J. Thompson | 5,023 | 2.2 | |
| Total votes | 224,469 | 100.0 | ||
| Turnout | ||||
| Democratic hold | ||||
1982[]
| Party | Candidate | Votes | % | |
|---|---|---|---|---|
| Democratic | George Miller (incumbent) | 126,952 | 67.2 | |
| Republican | Paul E. Vallely | 56,960 | 30.2 | |
| Libertarian | Richard Newell | 2,752 | 1.5 | |
| American Independent | Terry L. Wells | 2,205 | 1.2 | |
| Total votes | 188,869 | 100.0 | ||
| Turnout | ||||
| Democratic hold | ||||
1984[]
| Party | Candidate | Votes | % | |
|---|---|---|---|---|
| Democratic | George Miller (incumbent) | 158,306 | 66.7 | |
| Republican | Rosemary Thakar | 78,985 | 33.3 | |
| Total votes | 237,291 | 100.0 | ||
| Turnout | ||||
| Democratic hold | ||||
1986[]
| Party | Candidate | Votes | % | |
|---|---|---|---|---|
| Democratic | George Miller (incumbent) | 124,174 | 66.6 | |
| Republican | Rosemary Thakar | 62,379 | 33.4 | |
| Total votes | 186,553 | 100.0 | ||
| Turnout | ||||
| Democratic hold | ||||
1988[]
| Party | Candidate | Votes | % | |
|---|---|---|---|---|
| Democratic | George Miller (incumbent) | 170,006 | 68.4 | |
| Republican | Jean Last | 78,478 | 31.6 | |
| Total votes | 248,484 | 100.0 | ||
| Turnout | ||||
| Democratic hold | ||||
1990[]
| Party | Candidate | Votes | % | |
|---|---|---|---|---|
| Democratic | George Miller (incumbent) | 121,080 | 60.5 | |
| Republican | Roger A. Payton | 79,031 | 39.5 | |
| Total votes | 200,111 | 100.0 | ||
| Turnout | ||||
| Democratic hold | ||||
1992[]
| Party | Candidate | Votes | % | |
|---|---|---|---|---|
| Democratic | George Miller (incumbent) | 153,320 | 70.3 | |
| Republican | Dave Scholl | 54,822 | 25.2 | |
| Peace and Freedom | David L. Franklin | 9,840 | 4.5 | |
| Total votes | 217,982 | 100.0 | ||
| Turnout | ||||
| Democratic hold | ||||
1994[]
| Party | Candidate | Votes | % | |
|---|---|---|---|---|
| Democratic | George Miller (incumbent) | 116,015 | 69.69 | |
| Republican | Charles V. Hughes | 45,698 | 27.43 | |
| Peace and Freedom | William A. "Bill" Callison | 4,798 | 2.88 | |
| Total votes | 166,601 | 100.0 | ||
| Turnout | ||||
| Democratic hold | ||||
1996[]
| Party | Candidate | Votes | % | |
|---|---|---|---|---|
| Democratic | George Miller (incumbent) | 137,089 | 71.9 | |
| Republican | Norman Reece | 42,542 | 22.3 | |
| Reform | William Thompson | 6,866 | 3.5 | |
| Natural Law | Bruce Kendall | 4,420 | 2.3 | |
| Total votes | 190,917 | 100.0 | ||
| Turnout | ||||
| Democratic hold | ||||
1998[]
| Party | Candidate | Votes | % | |
|---|---|---|---|---|
| Democratic | George Miller (incumbent) | 125,842 | 76.67 | |
| Republican | Norman H. Reece | 38,290 | 23.33 | |
| Total votes | 164,132 | 100.0 | ||
| Turnout | ||||
| Democratic hold | ||||
2000[]
| Party | Candidate | Votes | % | |
|---|---|---|---|---|
| Democratic | George Miller (incumbent) | 159,692 | 76.5 | |
| Republican | Christopher A. Hoffman | 44,154 | 21.2 | |
| Natural Law | Martin Sproul | 4,943 | 2.3 | |
| Total votes | 208,789 | 100.0 | ||
| Turnout | ||||
| Democratic hold | ||||
2002[]
| Party | Candidate | Votes | % | |
|---|---|---|---|---|
| Democratic | George Miller (incumbent) | 97,849 | 70.8 | |
| Republican | Charles R. Hargrave | 36,584 | 26.4 | |
| Libertarian | Scott A. Wilson | 3,943 | 2.8 | |
| Total votes | 138,376 | 100.0 | ||
| Turnout | ||||
| Democratic hold | ||||
2004[]
| Party | Candidate | Votes | % | |
|---|---|---|---|---|
| Democratic | George Miller (incumbent) | 166,831 | 76.1 | |
| Republican | Charles Hargrave | 52,446 | 23.9 | |
| Total votes | 219,277 | 100.0 | ||
| Turnout | ||||
| Democratic hold | ||||
2006[]
| Party | Candidate | Votes | % | |
|---|---|---|---|---|
| Democratic | George Miller (incumbent) | 118,000 | 84.0 | |
| Libertarian | Camden McConnell | 22,486 | 16.0 | |
| Total votes | 140,486 | 100.0 | ||
| Turnout | ||||
| Democratic hold | ||||
2008[]
| Party | Candidate | Votes | % | |
|---|---|---|---|---|
| Democratic | George Miller (incumbent) | 170,962 | 72.82 | |
| Republican | Roger Allen Petersen | 51,166 | 21.79 | |
| Peace and Freedom | Bill Callison | 6,695 | 2.85 | |
| Libertarian | Camden McConnell | 5,950 | 2.53 | |
| Total votes | 234,773 | 100.0 | ||
| Turnout | ||||
| Democratic hold | ||||
2010[]
| Party | Candidate | Votes | % | |
|---|---|---|---|---|
| Democratic | George Miller (incumbent) | 122,435 | 68% | |
| Republican | Rick Tubbs | 56,764 | 32% | |
| Total votes | 179,199 | 100% | ||
| Turnout | ||||
| Democratic hold | ||||
2012[]
| Party | Candidate | Votes | % | |||
|---|---|---|---|---|---|---|
| Democratic | Ami Bera | 141,241 | 51.7% | |||
| Republican | Dan Lungren (Incumbent) | 132,050 | 48.3% | |||
| Total votes | 273,291 | 100.0% | ||||
| Democratic gain from Republican | ||||||
2014[]
| Party | Candidate | Votes | % | |
|---|---|---|---|---|
| Democratic | Ami Bera (Incumbent) | 92,521 | 50.4% | |
| Republican | Doug Ose | 91,066 | 49.6% | |
| Total votes | 183,587 | 100.0% | ||
| Democratic hold | ||||
2016[]
| Party | Candidate | Votes | % | |
|---|---|---|---|---|
| Democratic | Ami Bera (Incumbent) | 152,133 | 51.2% | |
| Republican | Scott Jones | 145,168 | 48.8% | |
| Total votes | 297,301 | 100.0% | ||
| Democratic hold | ||||
2018[]
| Party | Candidate | Votes | % | |
|---|---|---|---|---|
| Democratic | Ami Bera (incumbent) | 155,016 | 55% | |
| Republican | Andrew Grant | 126,601 | 45% | |
| Total votes | 281,617 | 100% | ||
| Democratic hold | ||||
2020[]
| Party | Candidate | Votes | % | |
|---|---|---|---|---|
| Democratic | Ami Bera (incumbent) | 217,416 | 56.6 | |
| Republican | Buzz Patterson | 166,549 | 43.4 | |
| Total votes | 383,965 | 100.0 | ||
| Democratic hold | ||||
Historical district boundaries[]
See also[]
References[]
- ^ https://www.census.gov/mycd/?st=06&cd=07
- ^ "Introducing the 2021 Cook Political Report Partisan Voter Index". The Cook Political Report. April 15, 2021. Retrieved April 15, 2021.
- ^ Statement of Vote (2000 President) Archived 2007-06-11 at the Wayback Machine
- ^ Statement of Vote (2000 Senator) Archived 2007-06-11 at the Wayback Machine
- ^ Statement of Vote (2002 Governor) Archived 2010-11-11 at the Wayback Machine
- ^ Statement of Vote (2003 Recall Question) Archived 2011-05-20 at the Wayback Machine
- ^ Statement of Vote (2003 Governor) Archived 2011-05-20 at the Wayback Machine
- ^ Statement of Vote (2004 President) Archived 2010-08-01 at the Wayback Machine
- ^ Statement of Vote (2004 Senator) Archived 2011-08-10 at the Wayback Machine
- ^ Statement of Vote (2006 Governor) Archived 2011-08-10 at the Wayback Machine
- ^ Statement of Vote (2006 Senator) Archived 2011-08-10 at the Wayback Machine
- ^ (2008 President) Archived 2009-02-11 at the Wayback Machine
- ^ [1]
- ^ 1920 election results
- ^ 1922 election results
- ^ 1924 election results
- ^ 1926 election results
- ^ 1928 election results
- ^ 1930 election results
- ^ 1932 election results
- ^ 1934 election results
- ^ 1936 election results
- ^ 1938 election results
- ^ 1940 election results
- ^ 1942 election results
- ^ 1944 election results
- ^ 1946 election results
- ^ 1948 election results
- ^ 1950 election results
- ^ 1952 election results
- ^ 1954 election results
- ^ 1956 election results
- ^ 1958 election results
- ^ 1960 election results
- ^ 1962 election results
- ^ 1964 election results
- ^ 1966 election results
- ^ 1968 election results
- ^ 1970 election results
- ^ 1972 election results
- ^ 1974 election results
- ^ 1976 election results
- ^ 1978 election results
- ^ 1980 election results
- ^ 1982 election results
- ^ 1984 election results
- ^ 1986 election results
- ^ 1988 election results
- ^ 1990 election results
- ^ 1992 election results
- ^ 1994 election results
- ^ 1996 election results
- ^ 1998 election results
- ^ 2000 election results
- ^ 2002 general election results Archived February 3, 2009, at the Wayback Machine
- ^ 2004 general election results[permanent dead link]
- ^ 2006 general election results Archived November 27, 2008, at the Wayback Machine
- ^ 2008 general election results[permanent dead link]
- ^ 2010 general election results[permanent dead link]
- ^ https://elections.cdn.sos.ca.gov/sov/2012-general/06-sov-summary.xls
- ^ https://elections.cdn.sos.ca.gov/sov/2014-general/xls/06-summary.xls
- ^ https://elections.cdn.sos.ca.gov/sov/2016-general/sov/csv-candidates.xls
- ^ 2018 election results
External links[]
- GovTrack.us: California's 7th congressional district

- Congressional districts of California
- Government of Sacramento County, California
- Elk Grove, California
- Folsom, California
- Rancho Cordova, California
- Constituencies established in 1893
- 1893 establishments in California