New Mexico's 2nd congressional district
| New Mexico's 2nd congressional district | |||
|---|---|---|---|
 New Mexico's 2nd congressional district - since January 3, 2013. | |||
| Representative |
| ||
| Distribution |
| ||
| Population (2019) | 705,615 | ||
| Median household income | $46,817[1] | ||
| Ethnicity |
| ||
| Cook PVI | R+8[2] | ||
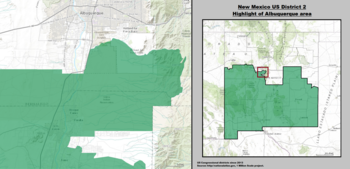
New Mexico's 2nd congressional district serves the southern half of New Mexico, including Las Cruces, Roswell, and the southern fourth of Albuquerque. Geographically, it is the fifth largest district in the nation, and the largest district that does not contain an entire state. It is currently represented by Republican Yvette Herrell.
Historically, the district has leaned more Republican than New Mexico's other two districts, particularly in presidential elections.
In the 2020 election, Republican candidate Yvette Herrell defeated Democratic representative Xochitl Torres Small in a rematch of their race in 2018. Herrell is the third Native woman elected to Congress and she assumed office on January 3, 2021.
Voting[]
Election results from statewide races[3][4]
| Year | Office | Result |
|---|---|---|
| 2000 | President | Bush 54 - 43% |
| 2004 | President | Bush 58 - 41% |
| 2008 | President | McCain 50 - 49% |
| 2012 | President | Romney 52 - 45% |
| 2016 | President | Trump 50 - 40% |
| 2018 | Senate | Heinrich 46 - 40% |
| 2018 | Governor | Pearce 53 - 47% |
| 2020 | President | Trump 54 - 43% |
List of members representing the district[]
| Member (Residence) |
Party | Years | Cong ress |
Electoral history | District location |
|---|---|---|---|---|---|
| District created January 3, 1969 from the former at-large district | |||||
 Ed Foreman (Portales) |
Republican | January 3, 1969 – January 3, 1971 |
91st | Elected in 1968. Lost re-election. |
1969–1983 Catron, Chaves, Curry, DeBaca, Doña Ana, Eddy, Grant, Hidalgo, Lea, Lincoln, Luna, McKinley, Otero, Roosevelt, San Juan, Sierra, Socorro, and Valencia |
 Harold Runnels (Lovington) |
Democratic | January 3, 1971 – August 5, 1980 |
92nd 93rd 94th 95th 96th |
Elected in 1970. Re-elected in 1972. Re-elected in 1974. Re-elected in 1976. Re-elected in 1978. Died. | |
| Vacant | August 5, 1980 – January 3, 1981 |
96th | |||
 Joe Skeen (Roswell) |
Republican | January 3, 1981 – January 3, 2003 |
97th 98th 99th 100th 101st 102nd 103rd 104th 105th 106th 107th |
Elected in 1980. Re-elected in 1982. Re-elected in 1984. Re-elected in 1986. Re-elected in 1988. Re-elected in 1990. Re-elected in 1992. Re-elected in 1994. Re-elected in 1996. Re-elected in 1998. Re-elected in 2000. Retired. | |
| 1983–1993 [data unknown/missing] | |||||
| 1993–2003 Bernalillo, Catron, Chaves, Cibola, DeBaca, Doña Ana, Eddy, Grant, Guadalupe, Hidalgo, Lea, Lincoln, Luna, Otero, Sierra, Socorro, and Valencia | |||||
 Steve Pearce (Hobbs) |
Republican | January 3, 2003 – January 3, 2009 |
108th 109th 110th |
Elected in 2002. Re-elected in 2004. Re-elected in 2006. Retired to run for U.S. senator. |
2003–2013 Bernalillo, Catron, Chaves, Cibola, DeBaca, Doña Ana, Eddy, Grant, Guadalupe, Hidalgo, Lea, Lincoln, Luna, McKinley, Otero, Sierra, Socorro, and Valencia |
 Harry Teague (Hobbs) |
Democratic | January 3, 2009 – January 3, 2011 |
111th | Elected in 2008. Lost re-election. | |
 Steve Pearce (Hobbs) |
Republican | January 3, 2011 – January 3, 2019 |
112th 113th 114th 115th |
Elected in 2010. Re-elected in 2012. Re-elected in 2014. Re-elected in 2016. Retired to run for Governor of New Mexico. | |
2013–present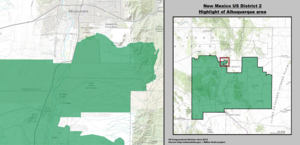 Bernalillo, Catron, Chaves, Cibola, DeBaca, Doña Ana, Eddy, Grant, Guadalupe, Hidalgo, Lea, Lincoln, Luna, McKinley, Otero, Roosevelt, Sierra, Socorro, and Valencia | |||||
 Xochitl Torres Small (Las Cruces) |
Democratic | January 3, 2019 – January 3, 2021 |
116th | Elected in 2018. Lost re-election. | |
 Yvette Herrell (Alamogordo) |
Republican | January 3, 2021 – Present |
117th | Elected in 2020. | |
Election results[]
1968[]
| Party | Candidate | Votes | % | ||
|---|---|---|---|---|---|
| Republican | Ed Foreman | 71,857 | 50.48 | ||
| Democratic | E. S. Johnny Walker | 69,858 | 49.08 | ||
| Independent | Wilfredo Sedillo | 633 | 0.44 | ||
| Total votes | 142,348 | 100.0 | |||
| Republican win (new seat) | |||||
1970[]
| Party | Candidate | Votes | % | |||
|---|---|---|---|---|---|---|
| Democratic | Harold L. Runnels | 64,518 | 51.37 | |||
| Republican | Ed Foreman (Incumbent) | 61,074 | 48.63 | |||
| Total votes | 125,592 | 100.0 | ||||
| Democratic gain from Republican | ||||||
1972[]
| Party | Candidate | Votes | % | |
|---|---|---|---|---|
| Democratic | Harold L. Runnels (Incumbent) | 116,152 | 72.17 | |
| Republican | George E. Presson | 44,784 | 27.83 | |
| Total votes | 160,936 | 100.0 | ||
| Democratic hold | ||||
1974[]
| Party | Candidate | Votes | % | |
|---|---|---|---|---|
| Democratic | Harold L. Runnels (Incumbent) | 90,127 | 66.74 | |
| Republican | Donald W. Trubey | 43,045 | 31.88 | |
| American Independent | Herbert Horton | 1,860 | 1.38 | |
| Total votes | 135,032 | 100.0 | ||
| Democratic hold | ||||
1976[]
| Party | Candidate | Votes | % | |
|---|---|---|---|---|
| Democratic | Harold L. Runnels (Incumbent) | 123,563 | 70.33 | |
| Republican | Donald W. Trubey | 52,131 | 29.67 | |
| Total votes | 175,694 | 100.0 | ||
| Democratic hold | ||||
1978[]
| Party | Candidate | Votes | % | |
|---|---|---|---|---|
| Democratic | Harold L. Runnels (Incumbent) | 95,710 | 100.00 | |
| Total votes | 95,710 | 100.0 | ||
| Democratic hold | ||||
1980[]
| Party | Candidate | Votes | % | |||
|---|---|---|---|---|---|---|
| Republican | Joe Skeen (as a write-in) | 61,564 | 38.00 | |||
| Democratic | David King | 55,085 | 34.00 | |||
| Independent | Dorothy Runnels (as a write-in) | 45,343 | 28.00 | |||
| Total votes | 161,992 | 100.0 | ||||
| Republican gain from Democratic | ||||||
1982[]
| Party | Candidate | Votes | % | |
|---|---|---|---|---|
| Republican | Joe Skeen (Incumbent) | 71,021 | 58.40 | |
| Democratic | Caleb Chandler | 50,599 | 41.60 | |
| Total votes | 121,620 | 100.0 | ||
| Republican hold | ||||
1984[]
| Party | Candidate | Votes | % | |
|---|---|---|---|---|
| Republican | Joe Skeen (Incumbent) | 116,006 | 74.33 | |
| Democratic | Peter R. York | 40,063 | 25.67 | |
| Total votes | 156,069 | 100.0 | ||
| Republican hold | ||||
1986[]
| Party | Candidate | Votes | % | |
|---|---|---|---|---|
| Republican | Joe Skeen (Incumbent) | 77,787 | 62.88 | |
| Democratic | Mike Runnels | 45,924 | 37.12 | |
| Total votes | 123,711 | 100.0 | ||
| Republican hold | ||||
1988[]
| Party | Candidate | Votes | % | |
|---|---|---|---|---|
| Republican | Joe Skeen (Incumbent) | 100,324 | 100.00 | |
| Total votes | 100,324 | 100.0 | ||
| Republican hold | ||||
1990[]
| Party | Candidate | Votes | % | |
|---|---|---|---|---|
| Republican | Joe Skeen (Incumbent) | 80,677 | 100.00 | |
| Total votes | 80,677 | 100.0 | ||
| Republican hold | ||||
1992[]
| Party | Candidate | Votes | % | |
|---|---|---|---|---|
| Republican | Joe Skeen (Incumbent) | 94,838 | 56.39 | |
| Democratic | Dan Sosa Jr. | 73,157 | 43.50 | |
| Write-in | 175 | 0.11 | ||
| Total votes | 168,170 | 100.0 | ||
| Republican hold | ||||
1994[]
| Party | Candidate | Votes | % | |
|---|---|---|---|---|
| Republican | Joe Skeen (Incumbent) | 89,966 | 63.28 | |
| Democratic | Benjamin Anthony Chavez | 45,316 | 31.87 | |
| Green | Rex R. Johnson | 6,898 | 4.85 | |
| Total votes | 142,180 | 100.0 | ||
| Republican hold | ||||
1996[]
| Party | Candidate | Votes | % | |
|---|---|---|---|---|
| Republican | Joe Skeen (Incumbent) | 95,091 | 55.93 | |
| Democratic | E. Shirley Baca | 74,915 | 44.07 | |
| Total votes | 170,006 | 100.0 | ||
| Republican hold | ||||
1998[]
| Party | Candidate | Votes | % | |
|---|---|---|---|---|
| Republican | Joe Skeen (Incumbent) | 85,077 | 57.93 | |
| Democratic | E. Shirley Baca | 61,796 | 42.07 | |
| Total votes | 146,873 | 100.0 | ||
| Republican hold | ||||
2000[]
| Party | Candidate | Votes | % | |
|---|---|---|---|---|
| Republican | Joe Skeen (Incumbent) | 100,742 | 58.11 | |
| Democratic | Michael A. Montoya | 72,614 | 41.89 | |
| Total votes | 173,356 | 100.0 | ||
| Republican hold | ||||
2002[]
| Party | Candidate | Votes | % | |
|---|---|---|---|---|
| Republican | Steve Pearce | 79,631 | 56.23 | |
| Democratic | John Arthur Smith | 61,916 | 43.72 | |
| Green | George L. Dewey (as a write-in) | 43 | 0.03 | |
| Republican | Padraig M. Lynch (as a write-in) | 39 | 0.02 | |
| Total votes | 141,629 | 100.0 | ||
| Republican hold | ||||
2004[]
| Party | Candidate | Votes | % | |
|---|---|---|---|---|
| Republican | Steve Pearce (Incumbent) | 130,498 | 60.20 | |
| Democratic | Gary King | 86,292 | 39.80 | |
| Total votes | 216,790 | 100.0 | ||
| Republican hold | ||||
2006[]
| Party | Candidate | Votes | % | |
|---|---|---|---|---|
| Republican | Steve Pearce (Incumbent) | 92,620 | 59.42 | |
| Democratic | Albert Kissling | 63,119 | 40.49 | |
| Democratic | C. Dean Burk (as a write-in) | 135 | 0.09 | |
| Total votes | 155,874 | 100.0 | ||
| Republican hold | ||||
2008[]
| Party | Candidate | Votes | % | |||
|---|---|---|---|---|---|---|
| Democratic | Harry Teague | 129,572 | 55.96 | |||
| Republican | 101,980 | 44.04 | ||||
| Total votes | 231,552 | 100.0 | ||||
| Democratic gain from Republican | ||||||
2010[]
| Party | Candidate | Votes | % | |||
|---|---|---|---|---|---|---|
| Republican | Steve Pearce | 94,053 | 55.40 | |||
| Democratic | Harry Teague (Incumbent) | 75,709 | 44.60 | |||
| Total votes | 169,762 | 100.0 | ||||
| Republican gain from Democratic | ||||||
2012[]
| Party | Candidate | Votes | % | |
|---|---|---|---|---|
| Republican | Steve Pearce (Incumbent) | 133,180 | 59.06 | |
| Democratic | Evelyn Madrid Erhard | 92,162 | 40.87 | |
| Independent | Jack A. McGrann (Write-In) | 173 | 0.8 | |
| Total votes | 225,515 | 100.0 | ||
| Republican hold | ||||
2014[]
| Party | Candidate | Votes | % | |
|---|---|---|---|---|
| Republican | Steve Pearce (Incumbent) | 95,209 | 64.43 | |
| Democratic | Rocky Lara | 52,499 | 35.52 | |
| Republican | Jack McGrann (Write-In) | 69 | 0.05 | |
| Total votes | 147,777 | 100 | ||
| Republican hold | ||||
2016[]
| Party | Candidate | Votes | % | |
|---|---|---|---|---|
| Republican | Steve Pearce (Incumbent) | 143,514 | 62.72 | |
| Democratic | Merrie Lee Soules | 85,232 | 37.25 | |
| Republican | Jack A McGrann (write in) | 70 | 0.03 | |
| Total votes | 228,816 | 100 | ||
| Republican hold | ||||
2018[]
| Party | Candidate | Votes | % | |||
|---|---|---|---|---|---|---|
| Democratic | Xochitl Torres Small | 101,489 | 50.90 | |||
| Republican | Yvette Herrell | 97,767 | 49.10 | |||
| Total votes | 199,256 | 100.0 | ||||
| Democratic gain from Republican | ||||||
2020[]
| Party | Candidate | Votes | % | |
|---|---|---|---|---|
| Republican | Yvette Herrell | 142,169 | 53.75 | |
| Democratic | Xochitl Torres Small (incumbent) | 122,314 | 46.25 | |
| Total votes | 264,483 | 100.0 | ||
| Republican gain from Democratic | ||||
Historical district boundaries[]

See also[]
References[]
- Martis, Kenneth C. (1989). The Historical Atlas of Political Parties in the United States Congress. New York: Macmillan Publishing Company.
- Martis, Kenneth C. (1982). The Historical Atlas of United States Congressional Districts. New York: Macmillan Publishing Company.
- Congressional Biographical Directory of the United States 1774–present
- ^ Center for New Media & Promotion (CNMP), US Census Bureau. "My Congressional District". www.census.gov.
- ^ "Introducing the 2021 Cook Political Report Partisan Voter Index". The Cook Political Report. April 15, 2021. Retrieved April 15, 2021.
- ^ Presidential Election Results, by district, swingstateproject.com
- ^ "Daily Kos Elections 2008 & 2012 presidential election results for congressional districts used in 2012 & 2014 elections - Google Drive". docs.google.com.
- ^ "1968 Election Results" (PDF).
- ^ "1970 Election Results" (PDF).
- ^ "1972 Election Results" (PDF).
- ^ "1974 Election Results" (PDF).
- ^ "1976 Election Results" (PDF).
- ^ "1978 Election Results" (PDF).
- ^ "1980 Election Results" (PDF).
- ^ "1982 Election Results" (PDF).
- ^ "1984 Election Results" (PDF).
- ^ "1986 Election Results" (PDF).
- ^ "1988 Election Results" (PDF).
- ^ "1990 Election Results" (PDF).
- ^ "1992 Election Results" (PDF).
- ^ "1994 Election Results" (PDF).
- ^ "1996 Election Results" (PDF).
- ^ "1998 Election Results" (PDF).
- ^ "2000 Election Results" (PDF).
- ^ "2002 Election Results" (PDF).
- ^ "2004 Election Results" (PDF).
- ^ "2006 Election Results" (PDF).
- ^ "2008 Election Results" (PDF).
- ^ "2010 Election Results" (PDF). Archived from the original (PDF) on September 27, 2011. Retrieved May 11, 2011.
- ^ "Statewide Results". New Mexico Secretary of State. Archived from the original on December 27, 2017.
- ^ "Official Results General Election - November 4, 2014". New Mexico Secretary of State. November 4, 2014. Retrieved January 2, 2015.
- ^ "Election Night Results - November 8, 2016". New Mexico Secretary of State. November 8, 2016. Retrieved December 7, 2016.
- ^ "Election Night Results - November 6, 2018". New Mexico Secretary of State. November 6, 2018. Retrieved November 7, 2018.
Coordinates: 33°23′07″N 106°17′58″W / 33.38528°N 106.29944°W

- Congressional districts of New Mexico