Texas's 15th congressional district
| Texas's 15th congressional district | |||
|---|---|---|---|
 Texas's 15th congressional district - since January 3, 2013. | |||
| Representative |
| ||
| Distribution |
| ||
| Population (2019) | 804,562[2] | ||
| Median household income | $48,113[3] | ||
| Ethnicity | |||
| Cook PVI | D+3[4] | ||
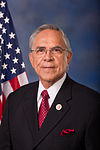
Texas's 15th congressional district of the United States House of Representatives includes a thin section of the far south of the state of Texas. The district's current Representative is Democrat Vicente Gonzalez, who was first elected in 2016.
The current boundaries of the gerrymandered district include the entire Brooks, Duval, Jim Hogg, Karnes, and Live Oak counties, and parts of Guadalupe, Hidalgo, and Wilson counties. The largest city fully in the district is McAllen, on the Mexico border.
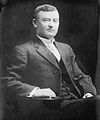
The district has generally given its congressmen very long tenures in Washington; only seven people, all Democrats, have ever represented it. The district's best-known Representative was John Nance Garner, who represented the district from its creation in 1903 until 1933, and was Speaker of the House from 1931 to 1933. He ran with Franklin D. Roosevelt in the 1932 and 1936 presidential campaigns, and was elected Vice President of the United States, serving from 1933 to 1941. The district was one of the first Latino-majority districts in the country, and has been represented by Latino congressmen since 1965.
Notably, this district narrowly voted more Republican in the House elections than the nation as a whole in 2020. Vincente Gonzalez won by 2.9 points while Democrats won the national vote by a combined 3.1 percentage points. It also voted more Republican than the national average while voting Democratic in the 2020 United States presidential election, and the difference between the national vote and the result was wider in the presidential election than the House.
Election results from presidential races[]
| Year | Office | Result |
|---|---|---|
| 2000 | President | Gore 54 - 44% |
| 2004 | President | Bush 51 - 49% |
| 2008 | President | Obama 60 - 40% |
| 2012 | President | Obama 57 - 42% |
| 2016 | President | Clinton 56.2 - 39.7% |
| 2020 | President | Biden 50.4 - 48.5% |
List of members representing the district[]


Election results[]
|
1920 • 1922 • 1924 • 1926 • 1928 • 1930 • 1932 • 1934 • 1936 • 1938 • 1940 • 1942 • 1944 • 1946 • 1948 • 1950 • 1952 • 1954 • 1956 • 1958 • 1960 • 1962 • 1964 • 1966 • 1968 • 1970 • 1972 • 1974 • 1976 • 1978 • 1980 • 1982 • 1984 • 1986 • 1988 • 1990 • 1992 • 1994 • 1996 • 1998 • 2000 • 2002 • 2004 • 2006 (Special) • 2008 • 2010 • 2012 • 2014 • 2016 • 2018 • 2020 |
1920[]
| Party | Candidate | Votes | % | |
|---|---|---|---|---|
| Democratic | John N. Garner (incumbent) | 10,265 | 100.00 | |
| Total votes | 10,265 | 100.0 | ||
| Turnout | ||||
| Democratic hold | ||||
1922[]
| Party | Candidate | Votes | % | |
|---|---|---|---|---|
| Democratic | John N. Garner (incumbent) | 14,366 | 100.00 | |
| Total votes | 14,366 | 100.0 | ||
| Turnout | ||||
| Democratic hold | ||||
1924[]
| Party | Candidate | Votes | % | |
|---|---|---|---|---|
| Democratic | John N. Garner (incumbent) | 22,776 | 100.00 | |
| Total votes | 22,776 | 100.0 | ||
| Turnout | ||||
| Democratic hold | ||||
1926[]
| Party | Candidate | Votes | % | |
|---|---|---|---|---|
| Democratic | John N. Garner (Incumbent) | 13,548 | 82.75 | |
| Republican | Hardie F. Jefferies | 2,823 | 17.25 | |
| Total votes | 16,371 | 100.0 | ||
| Turnout | ||||
| Democratic hold | ||||
1928[]
| Party | Candidate | Votes | % | |
|---|---|---|---|---|
| Democratic | John N. Garner (Incumbent) | 28,417 | 99.99 | |
| Independent | J.L. Burd | 1 | 0.003 | |
| Total votes | 28,418 | 100.0 | ||
| Turnout | ||||
| Democratic hold | ||||
1930[]
| Party | Candidate | Votes | % | |
|---|---|---|---|---|
| Democratic | John N. Garner (Incumbent) | 20,733 | 77.50 | |
| Republican | Carlos G. Watson | 6,016 | 22.50 | |
| Total votes | 26,749 | 100.0 | ||
| Turnout | ||||
| Democratic hold | ||||
1932[]
| Party | Candidate | Votes | % | |
|---|---|---|---|---|
| Democratic | John N. Garner (Incumbent) | 44,318 | 85.75 | |
| Republican | Carlos G. Watson | 7,362 | 14.25 | |
| Total votes | 51,680 | 100.0 | ||
| Turnout | ||||
| Democratic hold | ||||
1933 (Special)[]
| Party | Candidate | Votes | % | |
|---|---|---|---|---|
| Democratic | Milton H. West | 13,546 | 91.20 | |
| Republican | Carlos G. Watson | 1,302 | 8.80 | |
| Total votes | 14,848 | 100.0 | ||
| Turnout | ||||
| Democratic hold | ||||
1934[]
| Party | Candidate | Votes | % | |
|---|---|---|---|---|
| Democratic | Milton H. West (Incumbent) | 20,102 | 100.00 | |
| Total votes | 20,102 | 100.0 | ||
| Turnout | ||||
| Democratic hold | ||||
1936[]
| Party | Candidate | Votes | % | |
|---|---|---|---|---|
| Democratic | Milton H. West (Incumbent) | 29,508 | 82.53 | |
| Independent | J.A. Simpson | 6,244 | 17.47 | |
| Total votes | 35,752 | 100.0 | ||
| Turnout | ||||
| Democratic hold | ||||
1938[]
| Party | Candidate | Votes | % | |
|---|---|---|---|---|
| Democratic | Milton H. West (Incumbent) | 18,558 | 99.99 | |
| Other write-in votes | Write-in votes | 2 | 0.010 | |
| Total votes | 18,560 | 100.0 | ||
| Turnout | ||||
| Democratic hold | ||||
1940[]
| Party | Candidate | Votes | % | |
|---|---|---|---|---|
| Democratic | Milton H. West (Incumbent) | 31,800 | 92.36 | |
| Republican | J.A. Simpson | 2,628 | 7.64 | |
| Total votes | 34,428 | 100.0 | ||
| Turnout | ||||
| Democratic hold | ||||
1942[]
| Party | Candidate | Votes | % | |
|---|---|---|---|---|
| Democratic | Milton H. West (Incumbent) | 12,169 | 100.00 | |
| Total votes | 12,169 | 100.0 | ||
| Turnout | ||||
| Democratic hold | ||||
1944[]
| Party | Candidate | Votes | % | |
|---|---|---|---|---|
| Democratic | Milton H. West (Incumbent) | 36,362 | 99.98 | |
| Other write-in votes | Write-in votes | 5 | 0.013 | |
| Total votes | 36,367 | 100.0 | ||
| Turnout | ||||
| Democratic hold | ||||
1946[]
| Party | Candidate | Votes | % | |
|---|---|---|---|---|
| Democratic | Milton H. West (Incumbent) | 14,623 | 99.98 | |
| Other write-in votes | Write-in votes | 3 | 0.020 | |
| Total votes | 14,626 | 100.0 | ||
| Turnout | ||||
| Democratic hold | ||||
1948 (Special)[]
| Party | Candidate | Votes | % | |
|---|---|---|---|---|
| Democratic | Lloyd Bentsen | 2,396 | 100.00 | |
| Other write-in votes | Charles McNelly | 1 | 0.00 | |
| Total votes | 2,397 | 100.0 | ||
| Turnout | ||||
| Democratic hold | ||||
1948[]
| Party | Candidate | Votes | % | |
|---|---|---|---|---|
| Democratic | Lloyd Bentsen (Incumbent) | 27,402 | 100.00 | |
| Total votes | 27,402 | 100.0 | ||
| Turnout | ||||
| Democratic hold | ||||
1950[]
| Party | Candidate | Votes | % | |
|---|---|---|---|---|
| Democratic | Lloyd Bentsen (Incumbent) | 18,524 | 100.00 | |
| Total votes | 18,524 | 100.0 | ||
| Turnout | ||||
| Democratic hold | ||||
1952[]
| Party | Candidate | Votes | % | |
|---|---|---|---|---|
| Democratic | Lloyd Bentsen (Incumbent) | 63,767 | 100.00 | |
| Total votes | 63,767 | 100.0 | ||
| Turnout | ||||
| Democratic hold | ||||
1954[]
| Party | Candidate | Votes | % | |
|---|---|---|---|---|
| Democratic | Joe M. Kilgore | 29,113 | 100.00 | |
| Total votes | 29,113 | 100.0 | ||
| Turnout | ||||
| Democratic hold | ||||
1956[]
| Party | Candidate | Votes | % | |
|---|---|---|---|---|
| Democratic | Joe M. Kilgore (Incumbent) | 64,011 | 100.00 | |
| Total votes | 64,011 | 100.0 | ||
| Turnout | ||||
| Democratic hold | ||||
1958[]
| Party | Candidate | Votes | % | |
|---|---|---|---|---|
| Democratic | Joe M. Kilgore (Incumbent) | 28,404 | 100.00 | |
| Total votes | 28,404 | 100.0 | ||
| Turnout | ||||
| Democratic hold | ||||
1960[]
| Party | Candidate | Votes | % | |
|---|---|---|---|---|
| Democratic | Joe M. Kilgore (Incumbent) | 76,421 | 100.00 | |
| Total votes | 76,421 | 100.0 | ||
| Turnout | ||||
| Democratic hold | ||||
1962[]
| Party | Candidate | Votes | % | |
|---|---|---|---|---|
| Democratic | Joe M. Kilgore (Incumbent) | 53,552 | 100.00 | |
| Total votes | 53,552 | 100.0 | ||
| Turnout | ||||
| Democratic hold | ||||
1964[]
| Party | Candidate | Votes | % | |
|---|---|---|---|---|
| Democratic | Kika de la Garza | 66,897 | 69.36 | |
| Republican | Joe B. Coulter | 29,551 | 30.64 | |
| Total votes | 96,448 | 100.0 | ||
| Turnout | ||||
| Democratic hold | ||||
1966[]
| Party | Candidate | Votes | % | |
|---|---|---|---|---|
| Democratic | Kika de la Garza (Incumbent) | 33,129 | 100.00 | |
| Total votes | 33,129 | 100.0 | ||
| Turnout | ||||
| Democratic hold | ||||
1968[]
| Party | Candidate | Votes | % | |
|---|---|---|---|---|
| Democratic | Kika de la Garza (Incumbent) | 57,618 | 100.00 | |
| Total votes | 57,618 | 100.0 | ||
| Turnout | ||||
| Democratic hold | ||||
1970[]
| Party | Candidate | Votes | % | |
|---|---|---|---|---|
| Democratic | Kika de la Garza (Incumbent) | 54,498 | 76.16 | |
| Republican | Ben A. Martinez | 17,049 | 23.82 | |
| Other write-in votes | Write-in votes | 1 | 0.020 | |
| Total votes | 71,548 | 100.0 | ||
| Turnout | ||||
| Democratic hold | ||||
1972[]
| Party | Candidate | Votes | % | |
|---|---|---|---|---|
| Democratic | Kika de la Garza (Incumbent) | 73,994 | 100.00 | |
| Total votes | 73,994 | 100.0 | ||
| Turnout | ||||
| Democratic hold | ||||
1974[]
| Party | Candidate | Votes | % | |
|---|---|---|---|---|
| Democratic | Kika de la Garza (Incumbent) | 42,567 | 100.00 | |
| Total votes | 42,567 | 100.0 | ||
| Turnout | ||||
| Democratic hold | ||||
1976[]
| Party | Candidate | Votes | % | |
|---|---|---|---|---|
| Democratic | Kika de la Garza (Incumbent) | 102,837 | 74.36 | |
| Republican | R.L. (Lendy) McDonald | 35,446 | 25.64 | |
| Total votes | 138,283 | 100.0 | ||
| Turnout | ||||
| Democratic hold | ||||
1978[]
| Party | Candidate | Votes | % | |
|---|---|---|---|---|
| Democratic | Kika de la Garza (Incumbent) | 54,560 | 66.20 | |
| Republican | R.L. (Lendy) McDonald | 27,853 | 33.80 | |
| Total votes | 82,413 | 100.0 | ||
| Turnout | ||||
| Democratic hold | ||||
1980[]
| Party | Candidate | Votes | % | |
|---|---|---|---|---|
| Democratic | Kika de la Garza (Incumbent) | 105,325 | 70.02 | |
| Republican | R.L. (Lendy) McDonald | 45,090 | 29.98 | |
| Total votes | 150,145 | 100.0 | ||
| Turnout | ||||
| Democratic hold | ||||
1982[]
| Party | Candidate | Votes | % | |
|---|---|---|---|---|
| Democratic | Kika de la Garza (Incumbent) | 76,544 | 95.67 | |
| Libertarian | Frank L. Jones III | 3,458 | 4.33 | |
| Total votes | 80,002 | 100.0 | ||
| Turnout | ||||
| Democratic hold | ||||
1984[]
| Party | Candidate | Votes | % | |
|---|---|---|---|---|
| Democratic | Kika de la Garza (Incumbent) | 104,863 | 100.00 | |
| Total votes | 104,863 | 100.0 | ||
| Turnout | ||||
| Democratic hold | ||||
1986[]
| Party | Candidate | Votes | % | |
|---|---|---|---|---|
| Democratic | Kika de la Garza (Incumbent) | 70,077 | 100.00 | |
| Total votes | 70,077 | 100.0 | ||
| Turnout | ||||
| Democratic hold | ||||
1988[]
| Party | Candidate | Votes | % | |
|---|---|---|---|---|
| Democratic | Kika de la Garza (Incumbent) | 93,672 | 93.85 | |
| Libertarian | Gloria Joyce Hendrix | 6,133 | 6.15 | |
| Total votes | 99,805 | 100.0 | ||
| Turnout | ||||
| Democratic hold | ||||
1990[]
| Party | Candidate | Votes | % | |
|---|---|---|---|---|
| Democratic | Kika de la Garza (Incumbent) | 72,461 | 100.00 | |
| Total votes | 138,283 | 100.0 | ||
| Turnout | ||||
| Democratic hold | ||||
1992[]
| Party | Candidate | Votes | % | |
|---|---|---|---|---|
| Democratic | Kika de la Garza (Incumbent) | 86,351 | 60.42 | |
| Republican | Tom Haughey | 56,549 | 39.58 | |
| Total votes | 142,900 | 100.0 | ||
| Turnout | ||||
| Democratic hold | ||||
1994[]
| Party | Candidate | Votes | % | |
|---|---|---|---|---|
| Democratic | Kika de la Garza (Incumbent) | 61,527 | 58.95 | |
| Republican | Tom Haughey | 41,119 | 39.39 | |
| Independent | John c.c. Hamilton | 1,720 | 1.64 | |
| Total votes | 104,366 | 100.0 | ||
| Turnout | ||||
| Democratic hold | ||||
1996[]
| Party | Candidate | Votes | % | |
|---|---|---|---|---|
| Democratic | Rubén Hinojosa | 86,347 | 62.28 | |
| Republican | Tom Haughey | 50,914 | 36.72 | |
| Natural Law | Rob Wofford | 1,333 | 1.00 | |
| Total votes | 138,621 | 100.0 | ||
| Turnout | ||||
| Democratic hold | ||||
1998[]
| Party | Candidate | Votes | % | |
|---|---|---|---|---|
| Democratic | Rubén Hinojosa (Incumbent) | 47,957 | 58.35 | |
| Republican | Tom Haughey | 34,221 | 41.65 | |
| Total votes | 82,178 | 100.0 | ||
| Turnout | ||||
| Democratic hold | ||||
2000[]
| Party | Candidate | Votes | % | |
|---|---|---|---|---|
| Democratic | Rubén Hinojosa (Incumbent) | 106,570 | 88.47 | |
| Libertarian | Frank Jones | 13,167 | 10.93 | |
| Write-in | Israel Cantu | 711 | 0.60 | |
| Total votes | 120,448 | 100.0 | ||
| Turnout | ||||
| Democratic hold | ||||
2002[]
| Party | Candidate | Votes | % | |
|---|---|---|---|---|
| Democratic | Rubén Hinojosa (Incumbent) | 66,311 | 100.0 | |
| Total votes | 66,311 | 100.0 | ||
| Turnout | ||||
| Democratic hold | ||||
2004[]
| Party | Candidate | Votes | % | |
|---|---|---|---|---|
| Democratic | Rubén Hinojosa (Incumbent) | 96,089 | 57.76 | |
| Republican | Michael D. Thamm | 67,917 | 40.82 | |
| Libertarian | William R. Cady | 2,352 | 1.41 | |
| Total votes | 166,358 | 100.0 | ||
| Turnout | ||||
| Democratic hold | ||||
2006 (Special)[]
| Party | Candidate | Votes | % | |
|---|---|---|---|---|
| Democratic | Rubén Hinojosa (Incumbent) | 43,236 | 61.77 | |
| Republican | Paul B. Haring | 16,601 | 23.72 | |
| Republican | Eddie Zamora | 10,150 | 14.51 | |
| Total votes | 69,987 | 100.0 | ||
| Turnout | ||||
| Democratic hold | ||||
2008[]
| Party | Candidate | Votes | % | |
|---|---|---|---|---|
| Democratic | Rubén Hinojosa (Incumbent) | 107,578 | 67.28 | |
| Republican | Eddie Zamora | 52,303 | 32.72 | |
| Total votes | 159,881 | 100.0 | ||
| Turnout | ||||
| Democratic hold | ||||
2010[]
| Party | Candidate | Votes | % | |
|---|---|---|---|---|
| Democratic | Rubén Hinojosa (Incumbent) | 53,546 | 55.73 | |
| Republican | Eddie Zamora | 39.964 | 41.59 | |
| Libertarian | Aaron I. Cohn | 2,570 | 2.68 | |
| Total votes | 96,080 | 100.0 | ||
| Turnout | ||||
| Democratic hold | ||||
2012[]
| Party | Candidate | Votes | % | |
|---|---|---|---|---|
| Democratic | Rubén Hinojosa (Incumbent) | 89,296 | 60.88 | |
| Republican | Dale Brueggemann | 54,056 | 36.85 | |
| Libertarian | Ron Finch | 3,309 | 2.27 | |
| Total votes | 146,661 | 100.0 | ||
| Turnout | ||||
| Democratic hold | ||||
2014[]
| Party | Candidate | Votes | % | |
|---|---|---|---|---|
| Democratic | Rubén Hinojosa (Incumbent) | 48,708 | 54.01 | |
| Republican | Eddie Zamora | 39,016 | 43.26 | |
| Libertarian | Johnny Partain | 2,460 | 2.73 | |
| Total votes | 90,184 | 100.0 | ||
| Turnout | ||||
| Democratic hold | ||||
2016[]
| Party | Candidate | Votes | % | |
|---|---|---|---|---|
| Democratic | Vicente Gonzalez | 101,712 | 57.31 | |
| Republican | Tim Westley | 66,877 | 37.68 | |
| Green | Vanessa S. Tijerina | 5,448 | 3.07 | |
| Libertarian | Ross Lynn Leone | 3,442 | 1.94 | |
| Total votes | 177,479 | 100.0 | ||
| Democratic hold | ||||
2018[]
| Party | Candidate | Votes | % | |
|---|---|---|---|---|
| Democratic | Vicente Gonzalez (incumbent) | 98,333 | 59.07 | |
| Republican | Tim Westley | 63,862 | 38.07 | |
| Libertarian | Anthony Cristo | 2,607 | 1.06 | |
| Total votes | 164,802 | 100.0 | ||
| Democratic hold | ||||
2020[]
| Party | Candidate | Votes | % | |
|---|---|---|---|---|
| Democratic | Vicente Gonzalez (incumbent) | 115,605 | 50.05 | |
| Republican | Monica De la Cruz-Hernandez | 109,017 | 47.06 | |
| Libertarian | Ross Lynn Leone | 4,295 | 1.09 | |
| Total votes | 228,917 | 100.0 | ||
| Democratic hold | ||||
Historical district boundaries[]

See also[]
References[]
- ^ https://www.census.gov/geo/maps-data/data/cd_state.html
- ^ "My Congressional District".
- ^ "My Congressional District".
- ^ "Partisan Voting Index – Districts of the 115th Congress" (PDF). The Cook Political Report. April 7, 2017. Retrieved April 7, 2017.
- ^ 1920 election results
- ^ 1922 election results
- ^ 1924 election results
- ^ 1926 election results
- ^ 1928 election results
- ^ 1930 election results
- ^ 1932 election results
- ^ 1934 election results
- ^ 1936 election results
- ^ 1938 election results
- ^ 1940 election results
- ^ 1942 election results
- ^ 1944 election results
- ^ 1946 election results
- ^ 1948 election results
- ^ 1950 election results
- ^ 1952 election results
- ^ 1954 election results
- ^ 1956 election results
- ^ 1958 election results
- ^ 1960 election results
- ^ 1962 election results
- ^ 1964 election results
- ^ 1966 election results
- ^ 1968 election results
- ^ 1970 election results
- ^ 1972 election results
- ^ 1974 election results
- ^ 1976 election results
- ^ 1978 election results
- ^ 1980 election results
- ^ 1982 election results
- ^ 1984 election results
- ^ 1986 election results
- ^ 1988 election results
- ^ 1990 election results
- ^ 1992 election results
- ^ 1994 election results
- ^ 1996 election results
- ^ 1998 election results
- ^ 2000 election results
- ^ 2002 election results
- ^ 2004 election results
- ^ 2006 election results
- ^ 2008 election results
- ^ 2010 election results
- ^ 2012 election results
- ^ 2014 election results
- ^ 2016 election results
- Martis, Kenneth C. (1989). The Historical Atlas of Political Parties in the United States Congress. New York: Macmillan Publishing Company.
- Martis, Kenneth C. (1982). The Historical Atlas of United States Congressional Districts. New York: Macmillan Publishing Company.
- Congressional Biographical Directory of the United States 1774–present
Coordinates: 27°45′00″N 98°15′48″W / 27.75000°N 98.26333°W

- Congressional districts of Texas