2004 United States House of Representatives elections in Texas

| Elections in Texas |
|---|
 |
|
|
The 2004 United States House of Representatives elections in Texas occurred on November 2, 2004, to elect the members of the state of Texas's delegation to the United States House of Representatives. Texas had thirty-two seats in the House, apportioned according to the 2000 United States Census.
These elections occurred simultaneously with the United States Senate elections of 2004, the United States House elections in other states, and various state and local elections.
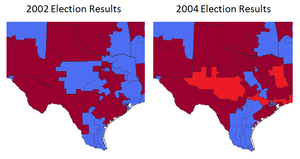
Republicans gained five of Texas's House seats due to a midterm redistricting in 2003. However some of the districts created following this election would later be changed. The Twenty-third district would be declared an unconstitutional racially gerrymandered district by the Supreme Court in League of United Latin American Citizens v. Perry in 2006. Thus it and neighboring districts would be redrawn.
Overview[]
| 2004 United States House of Representatives elections in Texas[1] | ||||||
|---|---|---|---|---|---|---|
| Party | Votes | Percentage | Seats before | Seats after | +/– | |
| Republican | 4,012,534 | 57.66% | 16 | 21 | +5 | |
| Democratic | 2,713,968 | 39% | 16 | 11 | -5 | |
| Libertarian | 180,389 | 2.59% | 0 | 0 | 0 | |
| Independent | 51,712 | 0.74% | 0 | 0 | 0 | |
| Valid votes | - | -% | ||||
| Invalid or blank votes | - | -% | ||||
| Totals | 6,958,603 | 100.00% | 32 | 32 | — | |
| Voter turnout | % | |||||
Results[]
| District | Incumbent | Party | Elected | Status | Opponent |
|---|---|---|---|---|---|
| Texas 1 | Max Sandlin | Democratic | 1996 | Defeated | Louie Gohmert (R) 61.5% Max Sandlin (D) 37.7% (L) 0.8% |
| Texas 2 | Jim Turner | Democratic | 1996 | Retired, Republican gain | Ted Poe (R) 55.5% Nick Lampson (D) 42.9% (L) 1.6% |
| Texas 3 | Sam Johnson | Republican | 1991 | Re-elected | Sam Johnson (R) 85.6% Paul Jenkins (I) 8.1% (L) 6.3% |
| Texas 4 | Ralph Hall | Republican | 1980 | Re-elected | Ralph Hall (R) 68.2% (D) 30.4% (L) 1.3% |
| Texas 5 | Jeb Hensarling | Republican | 2002 | Re-elected | Jeb Hensarling (R) 64.5% (D) 32.9% (L) 2.6% |
| Texas 6 | Joe Barton | Republican | 1984 | Re-elected | Joe Barton (R) 66.0% (D) 32.7% (L) 1.3% |
| Texas 7 | John Culberson | Republican | 2000 | Re-elected | John Culberson (R) 64.1% John Martinez (D) 33.3% (I) 1.4% (L) 1.2% |
| Texas 8 | Kevin Brady | Republican | 1996 | Re-elected | Kevin Brady (R) 68.9% James Wright (D) 29.7% (L) 1.4% |
| Texas 9 | Nick Lampson | Democratic | 1996 | Ran in 2nd district | Al Green (D) 72.2% (R) 26.6% (L) 1.2% |
| Texas 10 | Lloyd Doggett | Democratic | 1994 | Elected in 25th district | Michael McCaul (R) 78.6% (L) 15.4% (Write-in) 6.0% |
| Texas 11 | Chet Edwards | Democratic | 1990 | Elected in 17th district | Mike Conaway (R) 76.8% Wayne Raasch (D) 21.8% (L) 1.4% |
| Texas 12 | Kay Granger | Republican | 1996 | Re-elected | Kay Granger (R) 72.3% Felix Alvarado (D) 27.7% |
| Texas 13 | Mac Thornberry | Republican | 1994 | Re-elected | Mac Thornberry 92.3% (L) 7.7% |
| Texas 14 | Ron Paul | Republican | 1996 | Re-elected | Ron Paul (R) unopposed |
| Texas 15 | Ruben Hinojosa | Democratic | 1996 | Re-elected | Ruben Hinojosa (D) 57.8% (R) 40.8% (L) 1.4% |
| Texas 16 | Silvestre Reyes | Democratic | 1996 | Re-elected | Silvestre Reyes (D) 67.5% (R) 31.1% (L) 1.4% |
| Texas 17 | Charles Stenholm | Democratic | 1978 | Ran in 19th district | Chet Edwards (D) 51.2% Arlene Wohlgemuth (R) 47.4% (L) 1.4% |
| Texas 18 | Sheila Jackson Lee | Democratic | 1994 | Re-elected | Sheila Jackson Lee (D) 88.9% (I) 6.4% (L) 4.7% |
| Texas 19 | Randy Neugebauer | Republican | 2002 | Re-elected | Randy Neugebauer (R) 58.4% Charles Stenholm (D) 40.1% Richard Peterson (L) 1.5% |
| Texas 20 | Charlie Gonzalez | Democratic | 1998 | Re-elected | Charlie Gonzalez (D) 65.5% Roger Scott (R) 32.0% (L) 1.4% (I) 1.1% |
| Texas 21 | Lamar S. Smith | Republican | 1986 | Re-elected | Lamar S. Smith (R) 61.5% (D) 35.5% (L) 3.0% |
| Texas 22 | Tom DeLay | Republican | 1984 | Re-elected | Tom DeLay (R) 55.2% (D) 41.1% (I) 1.9% Thomas Morrison (L) 1.8% |
| Texas 23 | Henry Bonilla | Republican | 1992 | Re-elected | Henry Bonilla (R) 69.3% Joe Sullivan (D) 29.4% (L) 1.3% |
| Texas 24 | Martin Frost | Democratic | 1978 | Ran in 32nd district | Kenny Marchant (R) 64.0% (D) 34.2% (L) 1.8% |
| Texas 25 | Chris Bell | Democratic | 2002 | Lost primary in 9th district |
Lloyd Doggett (D) 67.6% (R) 30.7% (L) 1.7% |
| Texas 26 | Michael Burgess | Republican | 2002 | Re-elected | Michael Burgess (R) 65.8% Lico Reyes (D) 32.7% (L) 1.5% |
| Texas 27 | Solomon Ortiz | Democratic | 1982 | Re-elected | Solomon Ortiz (D) 63.1% Willie Vaden (R) 34.9% (L) 2.0% |
| Texas 28 | Ciro Rodriguez | Democratic | 1997 | Lost primary |
Henry Cuellar (D) 59.0% Jim Hopson (R) 38.6% (L) 2.4% |
| Texas 29 | Gene Green | Democratic | 1992 | Re-elected | Gene Green (D) 94.1% (L) 5.9% |
| Texas 30 | Eddie Bernice Johnson | Democratic | 1992 | Re-elected | Eddie Bernice Johnson (D) 93.0% (L) 7.0% |
| Texas 31 | John Carter | Republican | 2002 | Re-elected | John Carter (R) 64.8% Jon Porter (D) 32.4% (L) 2.8% |
| Texas 32 | Pete Sessions | Republican | 1996 | Re-elected | Pete Sessions (R) 54.3% Martin Frost (D) 44.0% (L) 1.7% |
See also[]
- 2004 United States House of Representatives elections
References[]
- ^ "Archived copy". Archived from the original on 2006-11-08. Retrieved 2010-07-13.CS1 maint: archived copy as title (link)
- 2004 United States House of Representatives elections
- United States House of Representatives elections in Texas
- 2004 Texas elections