Texas's 32nd congressional district
| Texas's 32nd congressional district | |||
|---|---|---|---|
 Texas's 32nd congressional district since January 3, 2013 | |||
| Representative |
| ||
| Distribution |
| ||
| Population (2019) | 778,087[2] | ||
| Median household income | $76,464[2] | ||
| Ethnicity |
| ||
| Cook PVI | D+1[3] | ||
Texas's 32nd congressional district of the United States House of Representatives serves a suburban area of northeastern Dallas County and a sliver of Collin. The district was created after the 2000 census when Texas went from 30 seats to 32 seats. It was then modified in 2011 after the 2010 United States Census. The current representative is Democrat Colin Allred.
Among other communities, the district includes part of the North Dallas neighborhood of Preston Hollow, which has been the home of George W. Bush since the end of his presidency. While it previously contained much of the Western Dallas County area, including Irving, since the redistricting in 2011–2012,[4] the district now covers mostly the Northern and Eastern Dallas County areas, and a small portion of Collin County.
In 2018, civil rights attorney and former NFL player Colin Allred won a heavily contested primary for the Democratic nomination, and defeated Republican incumbent Pete Sessions in the November 6 elections.[5] The district, like most suburban districts in Texas, had long been considered solidly Republican. However, it now considered more of a swing district as a result of changing demographics, along with antipathy towards former President Donald Trump in suburban areas.[6]
Election results from presidential races[]
| Year | Office | Result |
|---|---|---|
| 2004 | President | Bush 60 - 40% |
| 2008 | President | McCain 55 - 44% |
| 2012 | President | Romney 57 - 41.5% |
| 2016 | President | Clinton 48.5 - 46.6% |
| 2020 | President | Biden 54 - 44% |
List of members representing the district[]
| Member | Party | Years | Cong ess |
Electoral history | Counties represented |
|---|---|---|---|---|---|
| District created January 3, 2003 | |||||
 Pete Sessions |
Republican | January 3, 2003 – January 3, 2019 |
108th 109th 110th 111th 112th 113th 114th 115th |
Redistricted from the 5th district and re-elected in 2002. Re-elected in 2004. Re-elected in 2006. Re-elected in 2008. Re-elected in 2010. Re-elected in 2012. Re-elected in 2014. Re-elected in 2016. Lost re-election. |
2003–2007 Northeastern Dallas, Southeastern Collin |
2007–2013 Northeastern Dallas, Southeastern Collin | |||||
2013–present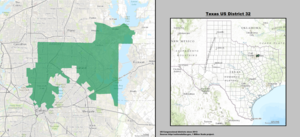 Northeastern Dallas, Southeastern Collin | |||||
 Colin Allred |
Democratic | January 3, 2019 – present |
116th 117th |
Elected in 2018. Re-elected in 2020. | |
Recent elections[]
This section needs expansion. You can help by . (November 2020) |
2004 election[]
In the 2004 election, Martin Frost, the Democratic representative from Texas's 24th congressional district, who had been redistricted out of his district in Fort Worth, Arlington, and parts of Dallas, decided to run against Sessions rather than challenge Kenny Marchant or Joe Barton. Sessions benefited from President George W. Bush's endorsement to win in this Republican-leaning district.
| Party | Candidate | Votes | % | ±% | |
|---|---|---|---|---|---|
| Republican | Pete Sessions (incumbent) | 109,859 | 54.3 | -14.8 | |
| Democratic | Martin Frost | 89,030 | 44.0 | +13.7 | |
| Libertarian | Michael Needleman | 3,347 | 1.7 | +0.6 | |
| Majority | 20,829 | 10.3 | |||
| Turnout | 202,236 | ||||
| Republican hold | Swing | -14.2 | |||
2006 election[]
In 2006, Dallas lawyer (and cousin of Arkansas Senator Mark Pryor) Will Pryor unsuccessfully challenged Sessions, and lost by a large margin.
| Party | Candidate | Votes | % | ±% | |
|---|---|---|---|---|---|
| Republican | Pete Sessions (incumbent) | 71,461 | 56.4 | +2.1 | |
| Democratic | Will Pryor | 52,269 | 41.3 | -2.7 | |
| Libertarian | John B. Hawley | 2,922 | 2.3 | +0.6 | |
| Majority | 19,192 | 15.1 | +4.8 | ||
| Turnout | 126,562 | -75,584 | |||
| Republican hold | Swing | +2.4 | |||
2008 election[]
In 2008, Sessions successfully faced a challenge by Democrat and was reelected to another term.[7]
| Party | Candidate | Votes | % | ±% | |
|---|---|---|---|---|---|
| Republican | Pete Sessions (incumbent) | 116,165 | 57.2 | +0.8 | |
| Democratic | Eric Roberson | 82,375 | 40.6 | -0.7 | |
| Libertarian | Alex Bischoff | 4,410 | 2.2 | -0.1 | |
| Majority | 33,790 | 16.6 | +1.5 | ||
| Turnout | 202,950 | +76,298 | |||
| Republican hold | Swing | +0.8 | |||
2010 election[]
In 2010, Sessions successfully faced a challenge by Democrat Grier Raggio and Libertarian John Jay Myers. Sessions was reelected to another term.[8]
| Party | Candidate | Votes | % | ±% | |
|---|---|---|---|---|---|
| Republican | Pete Sessions (incumbent) | 79,433 | 62.6 | +5.4 | |
| Democratic | Grier Raggio | 44,258 | 34.9 | -5.7 | |
| Libertarian | John Jay Myers | 3,178 | 2.5 | +0.3 | |
2012 election[]
In 2012, Sessions successfully faced a challenge by Democrat Katherine Savers McGovern and Libertarian Seth Hollist. Sessions was reelected to his 9th term.[9]
| Party | Candidate | Votes | % | ±% | |
|---|---|---|---|---|---|
| Republican | Pete Sessions (incumbent) | 146,129 | 58.29 | -4.31 | |
| Democratic | Katherine Savers McGovern | 98,867 | 39.44 | +4.54 | |
| Libertarian | Seth Hollist | 5,664 | 2.25 | -0.25 | |
2014 election[]
In 2014, Sessions successfully faced a challenge by Democrat Frank Perez and Libertarian . Sessions was reelected to his 10th term.
| Party | Candidate | Votes | % | ±% | |
|---|---|---|---|---|---|
| Republican | Pete Sessions (incumbent) | 96,420 | 61.8 | +3.51 | |
| Democratic | Frank Perez | 55,281 | 35.4 | -4.04 | |
| Libertarian | Ed Rankin | 4,271 | 2.7 | +0.45 | |
| Majority | 41,139 | 26.4 | -12.96 | ||
| Turnout | 155,972 | -94,688 | |||
2016 election[]
In 2016, Sessions won an election contested only by third party candidates, as the Democrats did not nominate a challenger. Sessions was reelected to his 11th term.
| Party | Candidate | Votes | % | ±% | |
|---|---|---|---|---|---|
| Republican | Pete Sessions (incumbent) | 162,868 | 71.07 | +9.25 | |
| Libertarian | Ed Rankin | 43,490 | 18.98 | +16.24 | |
| Green | Gary Stuard | 22,813 | 9.95 | +9.95 | |
| Total votes | 229,171 | 100 | |||
| Republican hold | Swing | ||||
2018 election[]
| Party | Candidate | Votes | % | ±% | |
|---|---|---|---|---|---|
| Democratic | Colin Allred | 144,067 | 52.27 | +52.27 | |
| Republican | Pete Sessions (incumbent) | 126,101 | 45.75 | -25.32 | |
| Libertarian | Melina Baker | 5,452 | 1.98 | -18.00 | |
| Total votes | 275,620 | 100.0 | |||
| Democratic gain from Republican | Swing | ||||
2020 Election[]
| Party | Candidate | Votes | % | |
|---|---|---|---|---|
| Democratic | Colin Allred (incumbent) | 178,542 | 52.0 | |
| Republican | Genevieve Collins | 157,867 | 45.9 | |
| Libertarian | Christy Mowrey Peterson | 4,946 | 1.4 | |
| Independent | Jason Sigmon | 2,332 | 0.7 | |
| Total votes | 343,687 | 100.0 | ||
| Democratic hold | ||||
See also[]
References[]
- ^ https://www.census.gov/geo/maps-data/data/cd_state.html
- ^ a b Center for New Media & Promotion (CNMP), US Census Bureau. "My Congressional District". www.census.gov.
- ^ "Introducing the 2021 Cook Political Report Partisan Voter Index". The Cook Political Report. April 15, 2021. Retrieved April 15, 2021.
- ^ Ross Ramsey (March 5, 2012). "In Redistricting, Race is the Limit to GOP Majority". The Texas Tribune. Retrieved August 8, 2012.
- ^ "Democrat Colin Allred grabs Dallas-area U.S. House seat from GOP's Pete Sessions". Dallas News. November 7, 2018.
- ^ "Role reversal: Architect of 2010 GOP House takeover in trouble". Politico.
- ^ US News and World Report (November 10, 2008). "2008 US Congressional Race Results". USA Today. Retrieved May 6, 2009.
- ^ The New York Times (November 10, 2009). "Election 2010". The New York Times. Retrieved August 8, 2012.
- ^ Texas Office of the Secretary of State (November 9, 2012). "2012 General Election Results". Office of the Secretary of State. Retrieved November 29, 2012.
- ^ "Texas Election Results - Official Results". Texas Secretary of State. Retrieved November 26, 2020.
Sources[]
Coordinates: 32°55′13″N 96°39′13″W / 32.92028°N 96.65361°W

- Congressional districts of Texas
- Constituencies established in 2003
- 2003 establishments in Texas