2006 United States House of Representatives elections
| |||||||||||||||||||||||||||||||||||||||||||||||||||||||||||||||||
All 435 seats in the United States House of Representatives[a] 218 seats needed for a majority | |||||||||||||||||||||||||||||||||||||||||||||||||||||||||||||||||
|---|---|---|---|---|---|---|---|---|---|---|---|---|---|---|---|---|---|---|---|---|---|---|---|---|---|---|---|---|---|---|---|---|---|---|---|---|---|---|---|---|---|---|---|---|---|---|---|---|---|---|---|---|---|---|---|---|---|---|---|---|---|---|---|---|---|
| |||||||||||||||||||||||||||||||||||||||||||||||||||||||||||||||||
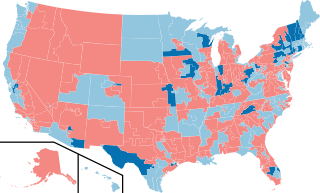 Results: Democratic hold Democratic gain Republican hold | |||||||||||||||||||||||||||||||||||||||||||||||||||||||||||||||||
| |||||||||||||||||||||||||||||||||||||||||||||||||||||||||||||||||

The 2006 United States House of Representatives elections were held on November 7, 2006, to elect members to the United States House of Representatives. It took place in the middle of President George W. Bush's second term in office. All 435 seats of the House were up for election. Those elected served in the 110th United States Congress from January 3, 2007, until January 3, 2009. The incumbent majority party, the Republicans, had won majorities in the House consecutively since 1994, and were defeated by the Democrats who won a majority in the chamber, ending 12 years of Republican control in the House.
The Republicans had won a 232-seat majority in 2004. By the time of the 2006 election, they held 229 seats, while the Democrats held 201, plus 1 Independent who caucused with the Democrats. There were also four vacancies. Republicans held a 28-seat advantage, and Democrats needed to pick up 15 seats to take control of the House, which had had a Republican majority since January 1995. The public's perception of George W. Bush, the handling of the wars in Iraq and Afghanistan, and a series of political scandals involving mostly congressional Republicans took their toll on the party at the ballot box.[1]
The final result was a 31-seat pickup for the Democrats, including the pickup of the Vermont at-large seat, previously held by Independent Bernie Sanders (who ran instead for U.S. Senate), who caucused with the Democrats. Democrats defeated 22 Republican incumbents and won eight open Republican-held seats. For the first time since the party's founding, Republicans won no seats previously held by Democrats and defeated no Democratic incumbents.[2] It was the largest seat gain for the Democrats since the 1974 elections. Among the new Democrats were the first Muslim in Congress (Keith Ellison) and the first two Buddhists (Mazie Hirono and Hank Johnson). As a result of the Democratic victory, Nancy Pelosi became the first woman and the first Californian House Speaker.[3]
As of 2021, these remain the only House elections in U.S. history where only one party flipped any seats. 2006 remains the last year in which Republicans won a house race in Connecticut.
Results[]
A number of organizations and individuals made predictions about the election, some for the House as a whole and some for both that and individual races.
| 233 | 202 |
| Democratic | Republican |


| Party | Seats | Popular vote | |||||||
|---|---|---|---|---|---|---|---|---|---|
| 2004 | 2006 | Net change |
% | Vote | % | +/− | |||
| Democratic Party | 202 | 233 | 53.6% | 42,338,795 | 52.3% | +5.5% | |||
| Republican Party | 232 | 202 | 46.4% | 35,857,334 | 44.3% | −5.1% | |||
| Libertarian Party | − | − | − | − | 656,764 | 0.8% | −0.1% | ||
| Independent | 1 | 0 | - | 417,895 | 0.5% | −0.1% | |||
| Green Party | − | − | − | − | 243,391 | 0.3% | - | ||
| Constitution Party | − | − | − | − | 91,133 | 0.1% | −0.1% | ||
| Independence Party | − | − | − | − | 85,815 | 0.1% | - | ||
| Reform Party | − | − | − | − | 53,862 | 0.1% | − | ||
| Other parties | − | − | − | − | 1,230,548 | 1.5% | −0.1% | ||
| Totals | 435 | 435 | − | 100.0% | 80,975,537 | 100.0% | − | ||
| Voter turnout: 36.8% | |||||||||
| Sources: Election Statistics - Office of the Clerk | |||||||||
Voter demographics[]
| Vote by demographic subgroup | |||||||
|---|---|---|---|---|---|---|---|
| Demographic subgroup | DEM | GOP | Other | % of total vote | |||
| Total vote | 52 | 44 | 4 | 100 | |||
| Ideology | |||||||
| Liberals | 87 | 11 | 2 | 20 | |||
| Moderates | 60 | 38 | 2 | 47 | |||
| Conservatives | 20 | 78 | 2 | 32 | |||
| Party | |||||||
| Democrats | 93 | 7 | n/a | 38 | |||
| Republicans | 8 | 91 | 1 | 36 | |||
| Independents | 57 | 39 | 4 | 26 | |||
| Gender | |||||||
| Men | 50 | 47 | 3 | 49 | |||
| Women | 55 | 43 | 2 | 51 | |||
| Marital status | |||||||
| Married | 48 | 51 | 1 | 68 | |||
| Unmarried | 64 | 34 | 2 | 32 | |||
| Gender by marital status | |||||||
| Married men | 47 | 51 | 2 | 35 | |||
| Married women | 48 | 50 | 2 | 33 | |||
| Unmarried men | 62 | 36 | 2 | 14 | |||
| Unmarried women | 66 | 32 | 2 | 18 | |||
| Race/ethnicity | |||||||
| White | 47 | 51 | 2 | 79 | |||
| Black | 89 | 10 | 1 | 10 | |||
| Asian | 62 | 37 | 1 | 2 | |||
| Other | 55 | 42 | 3 | 2 | |||
| Hispanic (of any race) | 69 | 30 | 1 | 8 | |||
| Gender by race | |||||||
| White men | 44 | 53 | 3 | 39 | |||
| White women | 49 | 50 | 1 | 40 | |||
| Non-white men | 75 | 23 | 2 | 9 | |||
| Non-white women | 78 | 21 | 1 | 11 | |||
| Religion | |||||||
| Protestant | 44 | 54 | 2 | 55 | |||
| Catholic | 55 | 44 | 1 | 26 | |||
| Jewish | 87 | 12 | 1 | 2 | |||
| Other religion | 71 | 25 | 4 | 6 | |||
| None | 74 | 22 | 4 | 11 | |||
| Religious service attendance | |||||||
| More than weekly | 38 | 60 | 2 | 17 | |||
| Weekly | 46 | 53 | 1 | 28 | |||
| Monthly | 57 | 41 | 2 | 12 | |||
| A few times a year | 60 | 38 | 2 | 25 | |||
| Never | 67 | 30 | 3 | 15 | |||
| White evangelical or born-again Christian | |||||||
| White evangelical or born-again Christian | 28 | 70 | 2 | 24 | |||
| Everyone else | 59 | 39 | 2 | 76 | |||
| Age | |||||||
| 18–29 years old | 60 | 38 | 2 | 12 | |||
| 30–44 years old | 53 | 45 | 2 | 24 | |||
| 45–59 years old | 53 | 46 | 1 | 34 | |||
| 60 and older | 50 | 48 | 2 | 29 | |||
| Sexual orientation | |||||||
| LGBT | 75 | 24 | 1 | 3 | |||
| Heterosexual | 52 | 46 | 2 | 97 | |||
| Education | |||||||
| Not a high school graduate | 64 | 35 | 1 | 3 | |||
| High school graduate | 55 | 44 | 1 | 21 | |||
| Some college education | 51 | 47 | 2 | 31 | |||
| College graduate | 49 | 49 | 2 | 27 | |||
| Postgraduate education | 58 | 41 | 1 | 18 | |||
| Family income | |||||||
| Under $15,000 | 67 | 30 | 3 | 7 | |||
| $15,000–30,000 | 61 | 36 | 3 | 12 | |||
| $30,000–50,000 | 56 | 43 | 1 | 21 | |||
| $50,000–75,000 | 50 | 48 | 2 | 22 | |||
| $75,000–100,000 | 52 | 47 | 1 | 16 | |||
| $100,000–150,000 | 47 | 51 | 2 | 13 | |||
| $150,000–200,000 | 47 | 51 | 2 | 5 | |||
| Over $200,000 | 45 | 53 | 2 | 5 | |||
| Union households | |||||||
| Union | 64 | 34 | 2 | 23 | |||
| Non-union | 49 | 49 | 2 | 77 | |||
| Region | |||||||
| Northeast | 63 | 35 | 2 | 22 | |||
| Midwest | 52 | 47 | 1 | 27 | |||
| South | 45 | 53 | 2 | 30 | |||
| West | 54 | 43 | 3 | 21 | |||
| Community size | |||||||
| Urban | 61 | 37 | 2 | 30 | |||
| Suburban | 50 | 48 | 2 | 47 | |||
| Rural | 48 | 50 | 2 | 24 | |||
Source: CNN exit poll[4]
Open seats[]

In the election, there were 32 open seats: 28 incumbents not seeking re-election and four vacancies. Of the 28 incumbents, 18 were Republicans, 9 Democrats, and 1 an independent.
The four vacancies were New Jersey's 13th congressional district, to be filled at the same time as the general election with the winner taking office in November immediately after the votes were certified; Texas's 22nd congressional district, with a separate special election on the same day; and Ohio's 18th congressional district and Florida's 16th congressional district, which did not have special elections to fill the vacancies before January 2007. New Jersey's 13th congressional district had been held by Democrat Bob Menendez, Texas's 22nd congressional district had been held by Republican Tom DeLay, Ohio's 18th congressional district had been held by Republican Robert Ney, and Florida's 16th congressional district had been held by Republican Mark Foley.
In addition to the open seats, two incumbents (Democrat Cynthia McKinney in Georgia's 4th congressional district and Republican Joe Schwarz in Michigan's 7th congressional district), were defeated in their party's respective primaries, adding two seats to the number of races where the incumbent was not up for re-election in November.
Election predictions[]
The following table rates the competitiveness of selected races from around the country according to Sabato's Crystal Ball. Races not included should be considered safe for the incumbent's party. (Incumbents not running for re-election have parentheses around their name.)
| District | Incumbent | Crystal Ball[5] | Rothenberg Political Report[6] | Result |
|---|---|---|---|---|
| AZ-1 | Renzi (R) | Tossup Republican Hold | Tossup/Tilt R | Renzi (R) |
| AZ-5 | Hayworth (R) | Tossup Democratic Gain | Tossup/Tilt D | Mitchell (D) |
| AZ-8 | (Kolbe) (R) | Likely D | Democrat Favored | Giffords (D) |
| CA-4 | Doolittle (R) | Leans R | Tossup/Tilt R | Doolittle (R) |
| CA-11 | Pombo (R) | Tossup Democratic Pickup | Pure Tossup | McNerney (D) |
| CA-50 | Bilbray (R) | Leans R | Republican Favored | Bilbray (R) |
| CO-4 | Musgrave (R) | Tossup Democratic Pickup | Tossup/Tilt R | Musgrave (R) |
| CO-5 | (Hefley) (R) | Safe R | Republican Favored | Lamborn (R) |
| CO-6 | Tancredo (R) | Likely R | Safe R | Tancredo (R) |
| CO-7 | (Beauprez) (R) | Likely D | Democrat Favored | Perlmutter (D) |
| CT-2 | Simmons (R) | Tossup Democratic Pickup | Pure Tossup | Courtney (D) |
| CT-4 | Shays (R) | Tossup Democratic Pickup | Pure Tossup | Shays (R) |
| CT-5 | Johnson (R) | Tossup Democratic Pickup | Tossup/Tilt D | Murphy (D) |
| FL-8 | Keller (R) | Likely R | Safe R | Keller (R) |
| FL-9 | (Bilirakis) (R) | Likely R | Safe R | Bilirakis (R) |
| FL-13 | (Harris) (R) | Lean D | Tossup/Tilt D | Buchanan (R) |
| FL-16 | (Foley) (R) | Tossup Democratic Pickup | Pure Tossup | Mahoney (D) |
| FL-22 | Shaw (R) | Tossup Democratic Pickup | Pure Tossup | Klein (D) |
| GA-8 | Marshall (D) | Leans D | Tossup/Tilt D | Marshall (D) |
| GA-12 | Barrow (D) | Tossup Democratic Hold | Tossup/Tilt D | Barrow (D) |
| ID-1 | (Otter) (R) | Tossup Democratic Pickup | Tossup/Tilt R | Sali (R) |
| IL-6 | (Hyde) (R) | Tossup Democratic Pickup | Pure Tossup | Roskam (R) |
| IL-8 | Bean (D) | Lean D | Tossup/Tilt D | Bean (D) |
| IL-10 | Kirk (R) | Lean R | Safe R | Kirk (R) |
| IN-2 | Chocola (R) | Lean D | Lean D | Donnelly (D) |
| IN-3 | Souder (R) | Likely R | Safe R | Souder (R) |
| IN-7 | Carson (D) | Likely D | Safe D | Carson (D) |
| IN-8 | Hostettler (R) | Likely D | Democrat Favored | Ellsworth (D) |
| IN-9 | Sodrel (R) | Tossup Democratic Pickup | Tossup/Tilt D | Hill (D) |
| IA-1 | (Nussle) (R) | Lean D | Lean D | Braley (D) |
| IA-2 | Leach (R) | Lean R | Safe R | Loebsack (D) |
| IA-3 | Boswell (D) | Lean D | Lean D | Boswell (D) |
| KS-2 | Ryun (R) | Tossup Republican Hold | Pure Tossup | Boyda (D) |
| KY-2 | Lewis (R) | Lean R | Republican Favored | Lewis (R) |
| KY-3 | Northup (R) | Tossup Republican Hold | Tossup/Tilt R | Yarmuth (D) |
| KY-4 | Davis (R) | Tossup Democratic Pickup | Tossup/Tilt R | Davis (R) |
| LA-3 | Melanchon (D) | Likely D | Safe D | Melanchon (D) |
| MI-7 | (Schwarz) (R) | Likely R | Safe R | Walberg (R) |
| MN-1 | Gutknecht (R) | Tossup Republican Hold | Pure Tossup | Walz (D) |
| MN-2 | Kline (R) | Likely R | Safe R | Kline (R) |
| MN-6 | (Kennedy) (R) | Tossup Republican Hold | Pure Tossup | Bachmann (R) |
| NE-3 | (Osborne) (R) | Tossup Republican Hold | Republican Favored | Smith (R) |
| NV-2 | (Gibbons) (R) | Leans R | Republican Favored | Heller (R) |
| NV-3 | Porter (R) | Tossup Republican Hold | Tossup/Tilt R | Porter (R) |
| NH-1 | Bradley (R) | Likely R | Safe R | Shea-Porter (D) |
| NH-2 | Bass (R) | Tossup Democratic Pickup | Tossup/Tilt D | Hodes (D) |
| NJ-7 | Ferguson (R) | Lean R | Lean R | Ferguson (R) |
| NM-1 | Wilson (R) | Tossup Democratic Pickup | Pure Tossup | Wilson (R) |
| NY-3 | King (R) | Likely R | Republican Favored | King (R) |
| NY-19 | Kelly (R) | Tossup Republican Hold | Republican Favored | Hall (D) |
| NY-20 | Sweeney (R) | Tossup Democratic Pickup | Tossup/Tilt D | Gillibrand (D) |
| NY-24 | (Boehlert) (R) | Lean D | Tossup/Tilt D | Arcuri (D) |
| NY-25 | Walsh (R) | Tossup Republican Hold | Tossup/Tilt R | Walsh (R) |
| NY-26 | Reynolds (R) | Tossup Republican Hold | Pure Tossup | Reynolds (R) |
| NY-29 | Kuhl (R) | Lean R | Tossup/Tilt R | Kuhl (R) |
| NC-8 | Hayes (R) | Lean R | Safe R | Hayes (R) |
| NC-11 | Taylor (R) | Lean D | Tossup/Tilt D | Shuler (D) |
| OH-1 | Chabot (R) | Tossup Republican Hold | Pure Tossup | Chabot (R) |
| OH-2 | Schmidt (R) | Tossup Democratic Pickup | Pure Tossup | Schmidt (R) |
| OH-6 | (Strickland) (D) | Likely D | Safe D | Wilson (D) |
| OH-12 | Tiberi (R) | Likely R | Lean R | Tiberi (R) |
| OH-15 | Pryce (R) | Tossup Democratic Pickup | Lean D | Pryce (R) |
| OH-18 | (Ney) (R) | Lean D | Lean D | Space (D) |
| PA-4 | Hart (R) | Tossup Republican Hold | Pure Tossup | Altmire (D) |
| PA-6 | Gerlach (R) | Lean D | Pure Tossup | Gerlach (R) |
| PA-7 | Weldon (R) | Lean D | Lean D | Sestak (D) |
| PA-8 | Fitzparick (R) | Tossup Republican Hold | Pure Tossup | Murphy (D) |
| PA-10 | Sherwood (R) | Lean D | Lean D | Carney (D) |
| TX-17 | Edwards (D) | Likely D | Safe D | Wilson (D) |
| TX-22 | (DeLay) (R) | Tossup Democratic Pickup | Pure Tossup | Lampson (D) |
| TX-23 | Bonilla (R) | Lean R | Lean R | Rodriguez (D) |
| VT-AL | (Sanders) (D) | Likely D | Democrat Favored | Welch (D) |
| VA-2 | Drake (R) | Tossup Republican Hold | Pure Tossup | Drake (R) |
| VA-10 | Wolf (R) | Lean R | Safe R | Wolf (R) |
| WA-8 | Reichert (R) | Tossup Republican Hold | Tossup/Tilt R | Reichert (R) |
| WV-1 | Mollahan (D) | Likely D | Safe D | Mollahan (D) |
| WV-2 | Capito (R) | Likely R | Safe R | Capito (R) |
| WI-8 | (Green) (R) | Tossup Republican Hold | Pure Tossup | Kagen (D) |
| WY-AL | Cubin (R) | Tossup Republican Hold | Republican Favored | Cubin (R) |
Seats that changed party[]
Thirty Republican seats were picked up by Democrats, and one seat held by an independent was picked up by a Democrat. No Democratic seats were picked up by Republicans.
- Arizona's 5th congressional district: Early in the cycle, incumbent J. D. Hayworth (R) appeared on his way to an easy reelection. However, his seat may have become more competitive after the Congressional Page scandal broke. Democrats fielded a locally well-known candidate in State Senator Harry Mitchell, a former Mayor of Tempe. Mitchell has been a political force in his home town, one of the largest communities in the district, and Democrats became enthusiastic about his candidacy. The 5th leans Republican, but not overwhelmingly. The district includes, in addition to Tempe, Scottsdale, the prime real estate of the Phoenix area. On election night, Mitchell defeated Hayworth, 50% to 46%.

- Arizona's 8th congressional district: Incumbent Jim Kolbe (R) announced on November 23, 2005, that he would not seek re-election in 2006.[citation needed] His district, located in Southeastern Arizona and based in the suburbs of Tucson, is Republican-leaning, but competitive: President Bush won the district with 53% of the vote in 2004 (although only 50% in 2000). The Democratic primary in September was won by former State Senator Gabby Giffords, who resigned from the Arizona Legislature on December 1, 2005, in preparation for the campaign. Randy Graf, a former state Representative who lost to Kolbe in the 2004 primary, won the September 2006 Republican primary. He defeated current state Representative Steve Huffman, whom both Kolbe and the National Republican Congressional Committee supported. The NRCC reportedly became concerned that Graf (a supporter of the Minuteman Project, and a sponsor of an unsuccessful bill that would let patrons carry guns into bars and restaurants), was too conservative to win the district. The NRCC committed $122,000 for a television ad in support of Huffman, which ran the week before the primary. The Democratic party shared that assessment — prior to the primary, it spent nearly $200,000, "a large part of that for advertisements critical of Mr. Huffman in an effort to help Mr. Graf's candidacy."[7] In late September, the national GOP canceled about $1 million in advertising support.[8] Libertarian David Nolan and independent Jay Quick also ran for the seat. Giffords went on to win by a 54% to 42% margin. (For details, see 2006 Arizona's 8th congressional district election.)
- California's 11th congressional district: Longtime incumbent Richard Pombo (R) won reelection in 2004 by a reasonably comfortable 61% to 39% margin. However, Pombo became associated with the ethical and legal scandals revolving around Jack Abramoff and became the subject of an investigation, which eroded his popular support. In addition, Rolling Stone listed him as one of the ten worst congressmen. The Democratic candidate who garnered the 39% in 2004, Jerry McNerney, joined that race as a write-in candidate two weeks before the primary election. In 2006, McNerney was challenged in the primary by Steve Filson. Filson was backed by the Democratic Congressional Campaign Committee but was upset by McNerney in the primary. Pombo was challenged for the Republican nomination by former Representative Pete McCloskey. Pombo won 63% of the primary vote to 32% for McCloskey.[9] McCloskey eventually endorsed McNerney.[10] The eleventh district is largely composed of Oakland suburbs and leans Republican. McNerney defeated Pombo 53% to 47% on election night.
- Colorado's 7th congressional district: Incumbent Bob Beauprez (R) was reelected to a second term in with 55% of the vote, after winning his first term by only 121 votes. His retirement to make an unsuccessful run for Governor of Colorado made this seat highly competitive. The 7th District is located in the northern and eastern Denver suburbs. State education chairman Rick O'Donnell was unopposed for the Republican nomination, while State Senator Ed Perlmutter won a three-way Democratic primary. On election night, Perlmutter won Beauprez's old seat as expected, 55% to 42%.
- Connecticut's 2nd congressional district: Incumbent Rob Simmons (R), a Vietnam War veteran and former CIA agent, won reelection by 54% to 46% in 2004, in a Democratic-leaning district encompassing eastern Connecticut, including Norwich and New London. The 2002 nominee, former state Representative Joe Courtney, decided to make another run. Even though in the past Simmons had been able to win elections in the Democratic-leaning district by painting himself as a moderate, the seat is perennially competitive. The results were so close on election night that the race was not settled until a week later. A recount was completed on November 14, 2006, with the final results giving Joe Courtney an 83-vote victory over Rob Simmons.[11] It was the closest house race of 2006.
- Connecticut's 5th congressional district: Although incumbent Nancy Johnson (R) won with at least 60% of the vote in 2004 and faced a difficult challenge (running against a fellow incumbent in a redrawn district) in 2002, winning with just 54%, she was still a Republican in a swing district. While the 5th is Connecticut's most conservative region, John Kerry won the district by about 1100 votes in 2004 and Al Gore won it when Johnson represented it as the 6th District in 2000. The district is located in Northwestern Connecticut and includes a large portion of Waterbury, Danbury, the wealthy western suburbs of Hartford, and small rural towns. Johnson faced a credible challenge from state Senator Chris Murphy. She was popular in the district, but with Bush's rating in New England at rock bottom, a Democratic victory was possible. Early in the cycle, this race was considered the least competitive of the three Republican-held seats in Connecticut, but Murphy defeated Johnson on election night, winning 56% to 44%.
- Florida's 16th congressional district: This Republican-leaning South Florida district, which includes West Palm Beach and Port St. Lucie on the state's east coast, and Port Charlotte on the west coast, was represented by Mark Foley, head of the Missing and Exploited Children's Caucus. However, Foley resigned September 29, 2006, due to revelations of inappropriate contacts of a sexual nature with underage male congressional pages. The scandal immediately ballooned to include the Republican leadership's involvement in a possible cover-up, and it soon brought down Republicans nationwide. Florida law bars state parties from replacing candidates on the ballot. Within the district, the scandal created strong backlash against any Republican replacement due to Foley's name remaining on the ballot, and, by extension, made the race, which had earlier been written off by most as a "safe" Republican seat, highly competitive. Businessman Tim Mahoney, a surprisingly well-funded challenger in a seemingly uncompetitive race, quickly became favored to win. The Republican replacement, businessman Joe Negron, ran an effective "Punch Foley for Negron" campaign, but lost in a closer than expected race, with 48% to Mahoney's 49%.[12]
- Florida's 22nd congressional district: Republican E. Clay Shaw had been in Congress since 1981, and had represented the 22nd District since 1993. The district voted for John Kerry over George Bush in 2004, but re-elected Shaw with 63% against a last minute replacement Democrat. In 2000, Shaw won a close race by 599 votes in a district that Al Gore won by 4%, but in 2002, he was redistricted into a slightly less Democratic district and scored an easy victory. The district includes wealthy areas of Palm Beach County and Broward County including Boca Raton and parts of Fort Lauderdale The revelation that Shaw was being treated for a second time for lung cancer may have affected his re-election chances. This year, Shaw faced a challenge from well-funded state senator Ron Klein. Klein won on election day 51% to 47%.
- Indiana's 2nd congressional district: Chris Chocola (R) was first elected in 2002 by a 50% to 46% margin. Democrat Joe Donnelly, who lost to Chocola 54% to 45% in 2004, ran again in 2006. Democrats blamed Donnelly's 2004 loss on a lack of funding from the national party that allowed Chocola to outspend Donnelly by a two-to-one margin. President Bush visited the South Bend-centered district seven times between 2000 and 2006, suggesting that Chocola was vulnerable. Chocola's popularity was also affected by the unpopularity of GOP Governor Mitch Daniels; among other things, Daniels decided to lease a toll road that runs through the district to a foreign corporation. Daniels also pushed to move the entire state to daylight saving time, which was opposed by local residents. In the campaign, Chocola attacked Donnelly for being delinquent in paying property taxes. On election night, Donnelly defeated Chocola 54% to 46%.
- Indiana's 8th congressional district: John Hostettler (R), who had only a 34% approval rating, was challenged by Vanderburgh County Sheriff Brad Ellsworth in this swing district that includes Evansville and Terre Haute. Hostettler had a history of winning tough reelections, but Ellsworth was considered to be his strongest opponent. The district has been nicknamed "The Bloody Eighth" due to its frequent ousting of incumbent congressmen, which has occurred in 1958, 1966, 1974, 1978, 1982, 1994, and 2006. Despite the competitive nature of the district, Hostettler was traditionally slow to raise money and lagged far behind his opponent in fundraising totals throughout the election. Rumors circulated in September that Hostettler had essentially given up on his campaign when he failed to hold any events on Labor Day weekend, the traditional kickoff of the campaign season. In the end, Ellsworth defeated Hostettler by a 61%–39% margin, the most lopsided loss for a House incumbent since 1994.
- Indiana's 9th congressional district: In 2004, incumbent Mike Sodrel (R) defeated then-incumbent Baron Hill by only 1,425 votes, the smallest winning percentage in any congressional race that year.[13] Hill ran in 2006 to reclaim his seat in this Southeast Indiana district that includes Bloomington and New Albany. He defeated anti-war challenger in the May 2 primary. Factors cited in the race included Sodrel being a self-described staunch Republican Party loyalist in an evenly divided district, Hill lacking the advantages of incumbency in 2006, and (according to Democrats) Hill's superior constituent service compared to Sodrel's. Hill defeated Sodrel 50% to 46%.
- Iowa's 1st congressional district: Incumbent Jim Nussle (R) left his seat in Congress to run for governor. This district is Democratic-leaning, and of the open seats was one of the most likely to change hands. It contains most of northeastern Iowa including large cities such as Dubuque, the Quad Cities and Waterloo. Nussle had been reelected in 2000 and 2004 with 55% of the vote but Al Gore and John Kerry won the district in those same years. In 2006, businessman Mike Whalen won the Republican nomination while attorney Bruce Braley was the Democratic nominee. Braley defeated Whalen 55 percent to 43 percent. (For details, see .)
- Iowa's 2nd congressional district: Incumbent Jim Leach (R) received 59% of the vote in 2004. Before the election, this was the most Democratic seat held by a Republican, as measured by presidential candidates' performances in the district. However, Leach had consistently won here since 1976, helped by his reputation for strong integrity. Also helping him was his status as one of the most liberal Republicans in the House. As a result, Leach traditionally won large numbers of crossover votes from Democrats and was expected to do so again. The Democrats nominated David Loebsack, a political science professor at small Cornell College in Mount Vernon, Iowa. Despite Leach's appeal and seniority, Loebsack prevailed on election night by a 51% to 49% margin. Leach's defeat made him the most senior House member to lose re-election in 2006 and the most senior member to lose re-election since 36-year incumbent Phil Crane lost in 2004 in an upset to Melissa Bean.
- Kansas's 2nd congressional district: Incumbent Jim Ryun (R), a leading conservative, won re-election by 56% to 41% in 2004 and had held his seat for five terms. This year, Ryun faced a rematch with Democrat Nancy Boyda, who also ran against him in 2004. The district is home to Topeka, Manhattan (location of Kansas State University), Leavenworth, Pittsburg, and half of the liberal college town of Lawrence, home of the University of Kansas. Despite being held by Ryun, the seat had a history of electing Democrats and before 1994, Democrats held the seat for 20 out of 24 years. However, gerrymandering had made the seat tilt more Republican, and Ryun was thought to be secure. However, Ryun faced controversy over a Washington, D.C. real estate purchase, and in the wake of scandals that rocked Washington, D.C., this had a major effect on local voters, far more than had been expected. Boyda was also helped by the reelection of popular Democratic Governor Kathleen Sebelius. Boyda defeated the incumbent Ryun 51% to 47%, in one of the most shocking results of the night.
- Kentucky's 3rd congressional district: Incumbent Anne Northup (R) had been a target for the Democrats since her election in 1996; in 2004 and 2000, John Kerry and Al Gore both won her Louisville-centered congressional district by two percent, and Bill Clinton won the district by double-digit margins during the 1990s. While Northup had generally run close races, she won 60% of the vote in the 2004 election. Redistricting after the 2000 census added a few more suburban Republicans to the district, according to Congressional Quarterly. The Democratic candidate was John Yarmuth, the founder of local free publication LEO. In spite of Northup's electoral success, excellent constituent services, and popularity among blue-collar voters in southern Louisville, Democrats saw this race as winnable, calling attention to Northup's 91% lockstep voting record with an unpopular President Bush. Northup led in most polls until October, when Yarmuth began to gain. By election night, the race had become highly competitive. House Majority Leader John Boehner referred to Northup as the Republicans' "canary in the coal mine", meaning that her fortunes would portend the outcome of House elections nationwide. This proved to be a correct assessment, as on election night, Yarmuth defeated Northup 51% to 48% and Republicans lost control of the House.
- Minnesota's 1st congressional district: Incumbent Gil Gutknecht (R) was reelected in his Southern Minnesota district with 60% of the vote in 2004. A member of the 1994 Republican Revolution, Gutknecht had promised not to run for a seventh term when first elected. Though not expected to be significant, the broken promise proved to be a factor in his defeat. Geography teacher Tim Walz was the Democratic nominee and ran a much stronger campaign than expected, helped by the massive decline in President George W. Bush's popularity in Minnesota. Walz defeated Gutknecht 53%–47%.[14]
- New Hampshire's 1st congressional district: Republican incumbent Jeb Bradley was seeking a third term. Rochester Democratic chair Carol Shea-Porter won the nomination in a major upset against better funded and party-favored state House Democratic Leader . Although this was the one house district in New England Bush carried in 2004, and Bradley had won it handily in the past, the President was highly unpopular throughout New England, which gave Democrats an opening. Still, most thought that Bradley was the strong favorite to win. Shea-Porter defeated Bradley 52% to 48% in the most shocking upset of the night, along with the victories of David Loebsack and Nancy Boyda.
- New Hampshire's 2nd congressional district: Incumbent Charles Bass (R) won reelection in 2004 with 58% percent of the vote, even as his district was won by John Kerry 52% to 47%. Bass, a political moderate, easily defeated primary challenges from Berlin Mayor and . The Democratic nominee, Paul Hodes, an attorney, was also the 2004 Democratic nominee. In late September, a top Bass staffer resigned after news stories that a U.S. Government computer in Bass's DC office had been used to post anonymous concern troll messages to NH blogs. In these messages, "IndyNH" claimed to be a supporter of Paul Hodes who was discouraged by Bass's unbeatable lead. Hodes defeated Bass on election day, 53% to 46%.
- New York's 19th congressional district: Incumbent Sue Kelly (R) had rarely faced stiff competition since her initial election in 1994, but the Democratic primary attracted six contenders in 2006, two of whom dropped out before the primary. Former Ulster County Legislator John Hall, who was once a member of the popular rock band, Orleans, won the Democratic nomination with 49% of the vote in a multi-candidate primary. An October 26 Majority-Watch poll had him leading 49% to 47%.[15] Several factors played into Kelly's defeat, including the extremely weak GOP showing in the senatorial and gubernatorial races, her reluctance to answer questions about the Mark Foley Page Scandal (notoriously, she literally ran away from television cameras at one point), and Hall's quirky campaign style, which included an appearance on the satirical Comedy Central program The Colbert Report. Hall defeated Kelly 51% to 49%. Following Hall's election, Stephen Colbert took credit for the victory and attributed it entirely to Hall's appearance on the show. Hall appeared several days later to satirically thank the host for his seat in Congress.
- New York's 20th congressional district: Incumbent John E. Sweeney (R) had never faced a particularly competitive election until 2006. His competitive district fueled a strong challenge from attorney Kirsten Gillibrand. In April 2006, Sweeney was allegedly sighted intoxicated at a fraternity party.[16] On October 31, a week before the election, police report surfaced that documented a 911 call from his wife asking for help because her husband was "knocking her around the room". Despite denials from both Sweeney and his wife, the report proved to be a turning point and Gillibrand was victorious on election night, 53% to 47%. (For details, see 2006 New York's 20th congressional district election.)
- New York's 24th congressional district: Incumbent Sherwood Boehlert (R) announced his retirement after 24 years, making this a seat of considerable focus for the Democrats in the run up to the mid terms. Boehlert is considered a moderate Republican, and the district is considered to be competitive. George Bush won by 53% in the 2004 election, but by only 3,000 votes in the 2000 presidential election. The Republican nominee was state Senator Ray Meier, while the Democratic nominee was Oneida County District Attorney Mike Arcuri. Both were locally popular and proven vote-getters and the race was a toss-up. Arcuri defeated Meier 54% to 45%.
- North Carolina's 11th congressional district: Charles H. Taylor (R) won with 55% in 2004, far behind George W. Bush in the area. The district consists of the around Asheville. Dogged by ethics-related scandals, Taylor faced tougher competition from former professional quarterback Heath Shuler (D) in 2006. A July 10 poll by Public Policy Polling showed that Shuler led Taylor by 51% to 45% .[17] Shuler defeated Taylor 54%–46%.
- Ohio's 18th congressional district: Bob Ney (R), the incumbent since 1995, part of the Jack Abramoff Indian lobbying scandal, withdrew from the race in early August 2006,[18] before pleading guilty a month later to criminal charges. Zack Space, the law director of the city of Dover, was the surprise winner of the Democratic nomination. Ney's formal withdrawal on August 14 resulted in a special election to choose his replacement; Ohio state Senator Joy Padgett won with about 65% of the vote. Her candidacy was subsequently damaged by news reports about her business and personal bankruptcies. Space defeated Padgett, 62% to 38%.
- Pennsylvania's 4th congressional district: Jason Altmire (D) upset incumbent Republican Melissa Hart in a surprise victory for the Democrats in this suburban Pittsburgh district. Altmire's background was in health care policy and legislative relations; he was overseer of the University of Pittsburgh Medical Center's Office of Charitable Giving before leaving to run for office in June 2005. Hart had seemed untouchable only a few months before the election, and Hart had seemed untouchable only a few months before the electionwas still generally expected to win on Election Day. Hart blamed her defeat on Altmire's campaign ads that tied her with the locally unpopular president.[19] Altmire defeated Hart, 52% to 48%.
- Pennsylvania's 7th congressional district: Curt Weldon (R) won reelection with 59% of the vote in 2004, but represents a Democratic-leaning district that incorporates much of Delaware County in suburban Philadelphia. He faced retired Navy Vice Admiral Joe Sestak (D). On October 13, it was reported that Weldon and his daughter were being investigated by the FBI, and two days later the FBI raided his daughter's residence.[20][21] Between Sestak's fundraising abilities,[22] and the investigation of Weldon and his daughter, Sestak defeated Weldon, 56% to 44%.
- Pennsylvania's 8th congressional district: Mike Fitzpatrick (R) won election for the first time in 2004 by a wide 56–42 margin over Virginia "Ginny" Schrader, but his district, based in suburban Bucks County, is politically moderate, having voted for Democratic presidents and Republican congressmen since 1992. His Democratic opponent in 2006 was retired Captain Patrick Murphy, an Iraq War veteran of the Army's 82nd Airborne. The Iraq War was the major issue of the campaign. In 2005, Murphy proposed a plan for phased withdrawal; Fitzpatrick stood by President Bush's stay-the-course policy through most of the campaign, before calling for a new plan. Ultimately, Murphy defeated Fitzpatrick by 1,518 votes.
- Pennsylvania's 10th congressional district: Don Sherwood (R) had strong backing as a result of redistricting in this heavy GOP district. The Democrats didn't even field a candidate to run against him in 2002 and 2004. But in 2005 details were made public regarding a five-year affair between Sherwood and Cynthia Ore, who sued Sherwood for $5.5 million alleging physical abuse. On November 8, 2005, the two settled out of court for an undisclosed amount. Sherwood was expected to win the Republican primary easily over teacher Kathy Scott, as she had very little money or campaign staff, but she polled a surprising 44% of the vote against him. His Democratic opponent was professor and U.S. Naval Reserve officer Chris Carney. Carney led in the polls for most of the fall. Carney defeated Sherwood 53% to 47%. For details, see .
- Texas's 22nd congressional district: Incumbent former House Majority Leader Tom DeLay (R) won the primary, then retired, leaving his seat vacant, and dropped out of the re-election race. These events followed a number of corruption charges that made DeLay the focus of a September 28, 2005, indictment by a grand jury in Travis County (which includes Austin) over his campaign finances related to Texans for a Republican Majority (TRMPAC) and another political action committee, ARMPAC. In 2004, DeLay won 55% of the vote against a relatively unknown Democrat, environmental lawyer , even though George W. Bush carried the suburban Houston district with 64% of the vote. Democrats sued to keep DeLay as the Republican nominee when he withdrew, citing a lack of proof of residence outside the district, since Texas law does not allow a party to replace its nominee unless the candidate cannot run due to extraordinary circumstances or if he or she moves away. The Democrats won the suit, and DeLay was forced to remain on the ballot or leave his party without a nominee. Republicans quickly rallied around Shelley Sekula-Gibbs to run a write-in campaign to defeat Nick Lampson the Democratic nominee. Lampson defeated Sekula-Gibbs 52%–42%.
- Texas's 23rd congressional district: In 2004, incumbent Henry Bonilla (R) received nearly 70% of the vote. However, his district, which includes several heavily Republican suburbs of San Antonio, as well as Big Bend National Park and much of Texas' border with Mexico, had to be changed after a mid-2006 U.S. Supreme Court ruling that the redistricting efforts of the Texas Legislature violated Voting Rights Act protection of minorities — largely Hispanic Laredo was in the 23rd District until the redistricting. On August 4, a federal court redrew the district and removed the portion of Webb County that was in the district, eliminating the possibility of a rematch with Cuellar, and added a heavily Democratic portion of San Antonio, the home base of liberal former congressman Ciro Rodriguez. Rodriguez ran against Bonilla in the all-candidate primary on November 7.[23] The winner of the now somewhat irrelevant Democratic primary, Vietnam War combat veteran , also ran in the November 7 election. The realigned district is less Republican than the previous version, but Bonilla was still favored against the crowded field of six Democrats, including Rodriguez and Bolanos, and one Independent candidate. A majority was required in this special election to avoid a runoff between the top two contenders. Bonilla won the November 7 election with 49% of the vote, but failed to get the needed 50% of the vote to avoid the runoff. In that runoff, he faced Rodriguez, who got 20% of the special election vote. Bonilla was seen as being the favorite. He ignored Rodriguez until the final days, then ran TV ads portraying him as politically aligned with some Islamic terror supporters, which backfired. In the special election however, Rodriguez was able to portray himself as part of an incoming majority, which would help retain federal funding for programs in the district. Rodriguez defeated Bonilla in the runoff 54% to 46%.
- Vermont's at-large congressional district: Incumbent Bernie Sanders (I), a democratic socialist who represented the entire state of Vermont, ran for the Senate seat being vacated by Senator Jim Jeffords. Vermont state Senate President Pro Tempore Peter Welch (D-Windsor County), the Democratic nominee, faced former Vermont Adjutant General Martha Rainville, Major General, USANG (ret.), the Republican nominee. Welch was helped when state Representative David Zuckerman decided not to wage a third-party campaign. Keith Stern, a businessman and zoning board member from Springfield, ran as an Independent; Jane Newton, a retired nurse, ran on the socialist Liberty Union line; and Jerry Trudell[24] ran as an Independent. Welch defeated Rainville 53% to 45%.
- Wisconsin's 8th congressional district: Incumbent Mark Green (R) — Green ran for governor, and his seat, in northeastern Wisconsin, was Republican-leaning, although it has elected a Democratic congressman as recently as 1996 and is centered around the cities of Green Bay and Appleton. State Assembly Speaker John Gard won the September 12 Republican primary as expected, in which he faced state Assemblywoman Terri McCormick. The Democratic nominee, Steve Kagen M.D., defeated business consultant Jamie Wall and former De Pere Mayor and Brown County Executive after a very competitive primary. Kagen defeated Gard 51% to 49%. (For details, see 2006 Wisconsin's 8th congressional district election.)
Alabama[]
| District | Incumbent | Results | Candidates | |||
|---|---|---|---|---|---|---|
| District | 2004 CPVI | Representative | Party | First elected | ||
| Alabama 1 | R+12 | Jo Bonner | Republican | 2002 | Incumbent re-elected. |
|
| Alabama 2 | R+13 | Terry Everett | Republican | 1992 | Incumbent re-elected. |
|
| Alabama 3 | R+4 | Mike Rogers | Republican | 2002 | Incumbent re-elected. |
|
| Alabama 4 | R+16 | Robert Aderholt | Republican | 1996 | Incumbent re-elected. |
|
| Alabama 5 | R+6 | Robert E. Cramer | Democratic | 1990 | Incumbent re-elected. |
|
| Alabama 6 | R+25 | Spencer Bachus | Republican | 1992 | Incumbent re-elected. |
|
| Alabama 7 | D+17 | Artur Davis | Democratic | 2002 | Incumbent re-elected. |
|
Alaska[]
| District | Incumbent | Results | Candidates | |||
|---|---|---|---|---|---|---|
| District | 2004 CPVI | Representative | Party | First elected | ||
| Alaska at-large | R+14 | Don Young | Republican | 1973 (Special) | Incumbent re-elected. |
|
Arizona[]
| District | Incumbent | Results | Candidates | |||
|---|---|---|---|---|---|---|
| District | 2004 CPVI | Representative | Party | First elected | ||
| Arizona 1 | R+2 | Rick Renzi | Republican | 2002 | Incumbent re-elected. |
|
| Arizona 2 | R+9 | Trent Franks | Republican | 2002 | Incumbent re-elected. |
|
| Arizona 3 | R+6 | John Shadegg | Republican | 1994 | Incumbent re-elected. |
|
| Arizona 4 | D+14 | Ed Pastor | Democratic | 1990 | Incumbent re-elected. |
|
| Arizona 5 | R+4 | J. D. Hayworth | Republican | 1994 | Incumbent lost re-election. New member elected. Democratic gain. |
|
| Arizona 6 | R+12 | Jeff Flake | Republican | 2000 | Incumbent re-elected. |
|
| Arizona 7 | D+12 | Raúl Grijalva | Democratic | 2002 | Incumbent re-elected. |
|
| Arizona 8 | R+1 | Jim Kolbe | Republican | 1984 | Incumbent retired. New member elected. Democratic gain. |
|
Arkansas[]
| District | Incumbent | Results | Candidates | |||
|---|---|---|---|---|---|---|
| District | 2004 CPVI | Representative | Party | First elected | ||
| Arkansas 1 | R+1 | Robert Marion Berry | Democratic | 1996 | Incumbent re-elected. |
|
| Arkansas 2 | EVEN | Vic Snyder | Democratic | 1996 | Incumbent re-elected. |
|
| Arkansas 3 | R+11 | John Boozman | Republican | 2000 | Incumbent re-elected. |
|
| Arkansas 4 | EVEN | Mike Ross | Democratic | 2000 | Incumbent re-elected. |
|
California[]
| District | Incumbent | Results | Candidates | |||
|---|---|---|---|---|---|---|
| District | 2004 CPVI | Representative | Party | First elected | ||
| California 1 | D+10 | Mike Thompson | Democratic | 1998 | Incumbent re-elected. |
|
| California 2 | R+13 | Wally Herger | Republican | 1988 | Incumbent re-elected. |
|
| California 3 | R+7 | Dan Lungren | Republican | 1998 | Incumbent re-elected. |
|
| California 4 | R+11 | John Doolittle | Republican | 1990 | Incumbent re-elected. |
|
| California 5 | D+14 | Doris Matsui | Democratic | 2005 (Special) | Incumbent re-elected. |
|
| California 6 | D+21 | Lynn Woolsey | Democratic | 1992 | Incumbent re-elected. |
|
| California 7 | D+19 | George Miller | Democratic | 1974 | Incumbent re-elected. |
|
| California 8 | D+36 | Nancy Pelosi | Democratic | 1987 (Special) | Incumbent re-elected. |
|
| California 9 | D+38 | Barbara Lee | Democratic | 1998 | Incumbent re-elected. |
|
| California 10 | D+8 | Ellen Tauscher | Democratic | 1996 | Incumbent re-elected. |
|
| California 11 | R+3 | Richard Pombo | Republican | 1992 | Incumbent lost re-election. New member elected. Democratic gain. |
|
| California 12 | D+22 | Tom Lantos | Democratic | 1980 | Incumbent re-elected. |
|
| California 13 | D+22 | Pete Stark | Democratic | 1972 | Incumbent re-elected. |
|
| California 14 | D+18 | Anna Eshoo | Democratic | 1992 | Incumbent re-elected. |
|
| California 15 | D+14 | Mike Honda | Democratic | 2000 | Incumbent re-elected. |
|
| California 16 | D+16 | Zoe Lofgren | Democratic | 1994 | Incumbent re-elected. |
|
| California 17 | D+17 | Sam Farr | Democratic | 1992 | Incumbent re-elected. |
|
| California 18 | D+3 | Dennis Cardoza | Democratic | 2002 | Incumbent re-elected. |
|
| California 19 | R+10 | George Radanovich | Republican | 1996 | Incumbent re-elected. |
|
| California 20 | D+5 | Jim Costa | Democratic | 2004 | Incumbent re-elected. |
|
| California 21 | R+13 | Devin Nunes | Republican | 2002 | Incumbent re-elected. |
|
| California 22 | R+16 | Bill Thomas | Republican | 1978 | Incumbent retired. New member elected. Republican hold. |
|
| California 23 | D+9 | Lois Capps | Democratic | 1998 | Incumbent re-elected. |
|
| California 24 | R+5 | Elton Gallegly | Republican | 1986 | Incumbent re-elected. |
|
| California 25 | R+7 | Buck McKeon | Republican | 1992 | Incumbent re-elected. |
|
| California 26 | R+4 | David Dreier | Republican | 1980 | Incumbent re-elected. |
|
| California 27 | D+13 | Brad Sherman | Democratic | 1996 | Incumbent re-elected. |
|
| California 28 | D+25 | Howard Berman | Democratic | 1982 | Incumbent re-elected. |
|
| California 29 | D+12 | Adam Schiff | Democratic | 2000 | Incumbent re-elected. |
|
| California 30 | D+20 | Henry Waxman | Democratic | 1974 | Incumbent re-elected. |
|
| California 31 | D+30 | Xavier Becerra | Democratic | 1992 | Incumbent re-elected. |
|
| California 32 | D+17 | Hilda Solis | Democratic | 2000 | Incumbent re-elected. |
|
| California 33 | D+36 | Diane Watson | Democratic | 2001 (Special) | Incumbent re-elected. |
|
| California 34 | D+23 | Lucille Roybal-Allard | Democratic | 1992 | Incumbent re-elected. |
|
| California 35 | D+33 | Maxine Waters | Democratic | 1990 | Incumbent re-elected. |
|
| California 36 | D+11 | Jane Harman | Democratic | 1986 | Incumbent re-elected. |
|
| California 37 | D+27 | Juanita Millender-McDonald | Democratic | 1996 | Incumbent re-elected. |
|
| California 38 | D+20 | Grace Napolitano | Democratic | 1998 | Incumbent re-elected. |
|
| California 39 | D+13 | Linda Sánchez | Democratic | 2002 | Incumbent re-elected. |
|
| California 40 | R+8 | Ed Royce | Republican | 1992 | Incumbent re-elected. |
|
| California 41 | R+9 | Jerry Lewis | Republican | 1978 | Incumbent re-elected. |
|
| California 42 | R+10 | Gary Miller | Republican | 1998 | Incumbent re-elected. |
|
| California 43 | D+13 | Joe Baca | Democratic | 1999 (Special) | Incumbent re-elected. |
|
| California 44 | R+6 | Ken Calvert | Republican | 1992 | Incumbent re-elected. |
|
| California 45 | R+3 | Mary Bono | Republican | 1998 | Incumbent re-elected. |
|
| California 46 | R+6 | Dana Rohrabacher | Republican | 1988 | Incumbent re-elected. |
|
| California 47 | D+5 | Loretta Sanchez | Democratic | 1996 | Incumbent re-elected. |
|
| California 48 | R+8 | John B. T. Campbell III | Republican | 2005 (Special) | Incumbent re-elected. |
|
| California 49 | R+10 | Darrell Issa | Republican | 2000 | Incumbent re-elected. |
|
| California 50 | R+5 | Brian Bilbray | Republican | 2006 | Incumbent re-elected. |
|
| California 51 | D+7 | Bob Filner | Democratic | 1992 | Incumbent re-elected. |
|
| California 52 | R+9 | Duncan L. Hunter | Republican | 1980 | Incumbent re-elected. |
|
| California 53 | D+12 | Susan Davis | Democratic | 2000 | Incumbent re-elected. |
|
Colorado[]
| District | Incumbent | Results | Candidates | |||
|---|---|---|---|---|---|---|
| District | 2004 CPVI | Representative | Party | First elected | ||
| Colorado 1 | D+18 | Diana DeGette | Democratic | 1996 | Incumbent re-elected. |
|
| Colorado 2 | D+8 | Mark Udall | Democratic | 1998 | Incumbent re-elected. |
|
| Colorado 3 | R+6 | John Salazar | Democratic | 2004 | Incumbent re-elected. |
|
| Colorado 4 | R+9 | Marilyn Musgrave | Republican | 2002 | Incumbent re-elected. |
|
| Colorado 5 | R+16 | Joel Hefley | Republican | 1986 | Incumbent retired. New member elected. Republican hold. |
|
| Colorado 6 | R+10 | Tom Tancredo | Republican | 1998 | Incumbent re-elected. |
|
| Colorado 7 | D+2 | Bob Beauprez | Republican | 2002 | Retired to run for Governor. New member elected. Democratic gain. |
|
Connecticut[]
| District | Incumbent | Results | Candidates | |||
|---|---|---|---|---|---|---|
| District | 2004 CPVI | Representative | Party | First elected | ||
| Connecticut 1 | D+14 | John B. Larson | Democratic | 1998 | Incumbent re-elected. |
|
| Connecticut 2 | D+8 | Rob Simmons | Republican | 2000 | Incumbent lost re-election. New member elected. Democratic gain. |
|
| Connecticut 3 | D+12 | Rosa DeLauro | Democratic | 1990 | Incumbent re-elected. |
|
| Connecticut 4 | D+5 | Chris Shays | Republican | Incumbent re-elected. |
| |
| Connecticut 5 | D+4 | Nancy Johnson | Republican | 1982 | Incumbent lost re-election. New member elected. Democratic gain. |
|
Delaware[]
| District | Incumbent | Results | Candidates | |||
|---|---|---|---|---|---|---|
| District | 2004 CPVI | Representative | Party | First elected | ||
| Delaware at-large | D+7 | Mike Castle | Republican | 1992 | Incumbent re-elected. |
|
Florida[]
| District | Incumbent | Results | Candidates | |||
|---|---|---|---|---|---|---|
| District | 2004 CPVI | Representative | Party | First elected | ||
| Florida 1 | R+19 | Jeff Miller | Republican | 2001 (Special) | Incumbent re-elected. |
|
| Florida 2 | R+2 | Allen Boyd | Democratic | 1996 | Incumbent re-elected. |
|
| Florida 3 | D+17 | Corrine Brown | Democratic | 1992 | Incumbent re-elected. |
|
| Florida 4 | R+16 | Ander Crenshaw | Republican | 2000 | Incumbent re-elected. |
|
| Florida 5 | R+5 | Ginny Brown-Waite | Republican | 2002 | Incumbent re-elected. |
|
| Florida 6 | R+8 | Cliff Stearns | Republican | 1988 | Incumbent re-elected. |
|
| Florida 7 | R+3 | John Mica | Republican | 1992 | Incumbent re-elected. |
|
| Florida 8 | R+3 | Ric Keller | Republican | 2000 | Incumbent re-elected. |
|
| Florida 9 | R+4 | Michael Bilirakis | Republican | 1982 | Incumbent retired. New member elected. Republican hold. |
|
| Florida 10 | D+1 | Bill Young | Republican | 1970 | Incumbent re-elected. |
|
| Florida 11 | D+11 | Jim Davis | Democratic | 1996 | Retired to run for Governor. New member elected. Democratic hold. |
|
| Florida 12 | R+5 | Adam Putnam | Republican | 2000 | Incumbent re-elected. |
|
| Florida 13 | R+4 | Katherine Harris | Republican | 2002 | Retired to run for U.S. Senator. New member elected. Republican hold. |
|
| Florida 14 | R+10 | Connie Mack IV | Republican | 2004 | Incumbent re-elected. |
|
| Florida 15 | R+4 | Dave Weldon | Republican | 1994 | Incumbent re-elected. |
|
| Florida 16 | R+2 | Vacant | Incumbent Mark Foley (Republican) resigned September 29, 2006. New member elected. Democratic gain. |
| ||
| Florida 17 | D+35 | Kendrick Meek | Democratic | 2002 | Incumbent re-elected. |
|
| Florida 18 | R+4 | Ileana Ros-Lehtinen | Republican | 1989 (Special) | Incumbent re-elected. |
|
| Florida 19 | D+21 | Robert Wexler | Democratic | 1996 | Incumbent re-elected. |
|
| Florida 20 | D+18 | Debbie Wasserman Schultz | Democratic | 2004 | Incumbent re-elected. |
|
| Florida 21 | R+6 | Lincoln Díaz-Balart | Republican | 1992 | Incumbent re-elected. |
|
| Florida 22 | D+4 | Clay Shaw | Republican | 1980 | Incumbent lost re-election. New member elected. Democratic gain. |
|
| Florida 23 | D+29 | Alcee Hastings | Democratic | 1992 | Incumbent re-elected. |
|
| Florida 24 | R+3 | Tom Feeney | Republican | 2002 | Incumbent re-elected. |
|
| Florida 25 | R+4 | Mario Díaz-Balart | Republican | 2002 | Incumbent re-elected. |
|
Georgia[]
Georgia's delegation was redistricted in 2005.[citation needed]
| District | Incumbent | Results | Candidates | |||
|---|---|---|---|---|---|---|
| District | 2004 CPVI | Representative | Party | First elected | ||
| Georgia 1 | R+14 | Jack Kingston | Republican | 1992 | Incumbent re-elected. |
|
| Georgia 2 | D+2 | Sanford Bishop | Democratic | 1992 | Incumbent re-elected. |
|
| Georgia 3 | R+19 | Lynn Westmoreland | Republican | 2004 | Incumbent re-elected. |
|
| Georgia 4 | D+22 | Cynthia McKinney | Democratic | 2002 | Incumbent lost renomination. New member elected. Democratic hold. |
|
| Georgia 5 | D+25 | John Lewis | Democratic | 1986 | Incumbent re-elected. |
|
| Georgia 6 | R+19 | Tom Price | Republican | 2004 | Incumbent re-elected. |
|
| Georgia 7 | R+19 | John Linder | Republican | 1992 | Incumbent re-elected. |
|
| Georgia 8 | R+8 | Jim Marshall | Democratic | 2002 | Incumbent re-elected. |
|
| Georgia 9 | R+24 | Nathan Deal | Republican | 1992 | Incumbent re-elected. |
|
| Georgia 10 | R+14 | Charlie Norwood | Republican | 1994 | Incumbent re-elected. |
|
| Georgia 11 | R+18 | Phil Gingrey | Republican | 2002 | Incumbent re-elected. |
|
| Georgia 12 | D+2 | John Barrow | Democratic | 2004 | Incumbent re-elected. |
|
| Georgia 13 | D+10 | David Scott | Democratic | 2002 | Incumbent re-elected. |
|
Hawaii[]
| District | Incumbent | Results | Candidates | |||
|---|---|---|---|---|---|---|
| District | 2004 CPVI | Representative | Party | First elected | ||
| Hawaii 1 | D+7 | Neil Abercrombie | Democratic | 1986 (Special) 1988 (Lost renomination) 1990 |
Incumbent re-elected. |
|
| Hawaii 2 | D+10 | Ed Case | Democratic | 2002 (Special) | Retired to run for U.S. Senator. New member elected. Democratic hold. |
|
Idaho[]
| District | Incumbent | Results | Candidates | |||
|---|---|---|---|---|---|---|
| District | 2004 CPVI | Representative | Party | First elected | ||
| Idaho 1 | R+19 | Butch Otter | Republican | 2000 | Retired to run for Governor. New member elected. Republican hold. |
|
| Idaho 2 | R+23 | Mike Simpson | Republican | 1998 | Incumbent re-elected. |
|
Illinois[]
| District | Incumbent | Results | Candidates | |||
|---|---|---|---|---|---|---|
| District | 2004 CPVI | Representative | Party | First elected | ||
| Illinois 1 | D+35 | Bobby Rush | Democratic | 1992 | Incumbent re-elected. |
|
| Illinois 2 | D+35 | Jesse Jackson Jr. | Democratic | Incumbent re-elected. |
| |
| Illinois 3 | D+10 | Dan Lipinski | Democratic | 2004 | Incumbent re-elected. |
|
| Illinois 4 | D+31 | Luis Gutiérrez | Democratic | 1992 | Incumbent re-elected. |
|
| Illinois 5 | D+18 | Rahm Emanuel | Democratic | 2002 | Incumbent re-elected. |
|
| Illinois 6 | R+3 | Henry Hyde | Republican | 1974 | Incumbent retired. New member elected. Republican hold. |
|
| Illinois 7 | D+35 | Danny K. Davis | Democratic | 1996 | Incumbent re-elected. |
|
| Illinois 8 | R+5 | Melissa Bean | Democratic | 2004 | Incumbent re-elected. |
|
| Illinois 9 | D+20 | Jan Schakowsky | Democratic | 1998 | Incumbent re-elected. |
|
| Illinois 10 | D+4 | Mark Kirk | Republican | 2000 | Incumbent re-elected. |
|
| Illinois 11 | R+1 | Jerry Weller | Republican | 1994 | Incumbent re-elected. |
|
| Illinois 12 | D+5 | Jerry Costello | Democratic | 1988 | Incumbent re-elected. |
|
| Illinois 13 | R+5 | Judy Biggert | Republican | 1998 | Incumbent re-elected. |
|
| Illinois 14 | R+5 | Dennis Hastert | Republican | 1986 | Incumbent re-elected. |
|
| Illinois 15 | R+6 | Tim Johnson | Republican | 2000 | Incumbent re-elected. |
|
| Illinois 16 | R+4 | Don Manzullo | Republican | 1992 | Incumbent re-elected. |
|
| Illinois 17 | D+5 | Lane Evans | Democratic | 1982 | Incumbent retired. New member elected. Democratic hold. |
|
| Illinois 18 | R+5 | Ray LaHood | Republican | 1994 | Incumbent re-elected. |
|
| Illinois 19 | R+8 | John Shimkus | Republican | 1996 | Incumbent re-elected. |
|
Indiana[]
| District | Incumbent | Results | Candidates | |||
|---|---|---|---|---|---|---|
| District | 2004 CPVI | Representative | Party | First elected | ||
| Indiana 1 | D+8 | Pete Visclosky | Democratic | 1984 | Incumbent re-elected. |
|
| Indiana 2 | R+4 | Chris Chocola | Republican | 2002 | Incumbent lost re-election. New member elected. Democratic gain. |
|
| Indiana 3 | R+16 | Mark Souder | Republican | 1994 | Incumbent re-elected. |
|
| Indiana 4 | R+17 | Steve Buyer | Republican | 1992 | Incumbent re-elected. |
|
| Indiana 5 | R+20 | Dan Burton | Republican | 1982 | Incumbent re-elected. |
|
| Indiana 6 | R+11 | Mike Pence | Republican | 2000 | Incumbent re-elected. |
|
| Indiana 7 | D+9 | Julia Carson | Democratic | 1996 | Incumbent re-elected. |
|
| Indiana 8 | R+9 | John Hostettler | Republican | 1994 | Incumbent lost re-election. New member elected. Democratic gain. |
|
| Indiana 9 | R+7 | Mike Sodrel | Republican | 2004 | Incumbent lost re-election. New member elected. Democratic gain. |
|
Iowa[]
| District | Incumbent | Results | Candidates | |||
|---|---|---|---|---|---|---|
| District | 2004 CPVI | Representative | Party | First elected | ||
| Iowa 1 | D+5 | Jim Nussle | Republican | 1990 | Retired to run for Governor. New member elected. Democratic gain. |
|
| Iowa 2 | D+7 | Jim Leach | Republican | 1976 | Incumbent lost re-election. New member elected. Democratic gain. |
|
| Iowa 3 | D+1 | Leonard Boswell | Democratic | 1996 | Incumbent re-elected. |
|
| Iowa 4 | EVEN | Tom Latham | Republican | 1994 | Incumbent re-elected. |
|
| Iowa 5 | R+8 | Steve King | Republican | 2002 | Incumbent re-elected. |
|
Kansas[]
| District | Incumbent | Results | Candidates | |||
|---|---|---|---|---|---|---|
| District | 2004 CPVI | Representative | Party | First elected | ||
| Kansas 1 | R+20 | Jerry Moran | Republican | 1996 | Incumbent re-elected. |
|
| Kansas 2 | R+7 | Jim Ryun | Republican | 1996 | Incumbent lost re-election. New member elected. Democratic gain. |
|
| Kansas 3 | R+4 | Dennis Moore | Democratic | 1998 | Incumbent re-elected. |
|
| Kansas 4 | R+12 | Todd Tiahrt | Republican | 1994 | Incumbent re-elected. |
|
Kentucky[]
| District | Incumbent | Results | Candidates | |||
|---|---|---|---|---|---|---|
| District | 2004 CPVI | Representative | Party | First elected | ||
| Kentucky 1 | R+10 | Ed Whitfield | Republican | 1994 | Incumbent re-elected. |
|
| Kentucky 2 | R+13 | Ron Lewis | Republican | 1994 | Incumbent re-elected. |
|
| Kentucky 3 | D+2 | Anne Northup | Republican | 1996 | Incumbent lost re-election. New member elected. Democratic gain. |
|
| Kentucky 4 | R+12 | Geoff Davis | Republican | 2004 | Incumbent re-elected. |
|
| Kentucky 5 | R+8 | Hal Rogers | Republican | 1980 | Incumbent re-elected. |
|
| Kentucky 6 | R+7 | Ben Chandler | Democratic | 2004 | Incumbent re-elected. |
|
Louisiana[]
| District | Incumbent | Results | Candidates | |||
|---|---|---|---|---|---|---|
| District | 2004 CPVI | Representative | Party | First elected | ||
| Louisiana 1 | R+18 | Bobby Jindal | Republican | 2004 | Incumbent re-elected. |
|
| Louisiana 2 | D+28 | William J. Jefferson | Democratic | 1990 | Incumbent re-elected in runoff.[26] |
|
| Louisiana 3 | R+5 | Charlie Melançon | Democratic | 2004 | Incumbent re-elected. |
|
| Louisiana 4 | R+7 | Jim McCrery | Republican | 1988 | Incumbent re-elected. |
|
| Louisiana 5 | R+10 | Rodney Alexander | Republican | 2002 | Incumbent re-elected. |
|
| Louisiana 6 | R+7 | Richard Baker | Republican | 1986 | Incumbent re-elected. |
|
| Louisiana 7 | R+7 | Charles Boustany | Republican | 2004 | Incumbent re-elected. |
|
Maine[]
| District | Incumbent | Results | Candidates | |||
|---|---|---|---|---|---|---|
| District | 2004 CPVI | Representative | Party | First elected | ||
| Maine 1 | D+6 | Tom Allen | Democratic | 1996 | Incumbent re-elected. |
|
| Maine 2 | D+4 | Mike Michaud | Democratic | 2002 | Incumbent re-elected. |
|
Maryland[]
| District | Incumbent | Results | Candidates | |||
|---|---|---|---|---|---|---|
| District | 2004 CPVI | Representative | Party | First elected | ||
| Maryland 1 | R+10 | Wayne Gilchrest | Republican | 1990 | Incumbent re-elected. |
|
| Maryland 2 | D+8 | Dutch Ruppersberger | Democratic | 2002 | Incumbent re-elected. |
|
| Maryland 3 | D+7 | Ben Cardin | Democratic | 1986 | Retired to run for U.S. Senator. New member elected. Democratic hold. |
|
| Maryland 4 | D+30 | Albert Wynn | Democratic | 1992 | Incumbent re-elected. |
|
| Maryland 5 | D+9 | Steny Hoyer | Democratic | Incumbent re-elected. |
| |
| Maryland 6 | R+13 | Roscoe Bartlett | Republican | 1992 | Incumbent re-elected. |
|
| Maryland 7 | D+25 | Elijah Cummings | Democratic | 1996 | Incumbent re-elected. |
|
| Maryland 8 | D+20 | Chris Van Hollen | Democratic | 2002 | Incumbent re-elected. |
|
Massachusetts[]
| District | Incumbent | Results | Candidates | |||
|---|---|---|---|---|---|---|
| District | 2004 CPVI | Representative | Party | First elected | ||
| Massachusetts 1 | D+15 | John Olver | Democratic | 1991 (Special) | Incumbent re-elected. |
|
| Massachusetts 2 | D+11 | Richard Neal | Democratic | 1988 | Incumbent re-elected. |
|
| Massachusetts 3 | D+11 | Jim McGovern | Democratic | 1996 | Incumbent re-elected. |
|
| Massachusetts 4 | D+17 | Barney Frank | Democratic | 1980 | Incumbent re-elected. |
|
| Massachusetts 5 | D+9 | Marty Meehan | Democratic | 1992 | Incumbent re-elected. |
|
| Massachusetts 6 | D+10 | John F. Tierney | Democratic | 1996 | Incumbent re-elected. |
|
| Massachusetts 7 | D+18 | Ed Markey | Democratic | 1976 | Incumbent re-elected. |
|
| Massachusetts 8 | D+31 | Mike Capuano | Democratic | 1998 | Incumbent re-elected. |
|
| Massachusetts 9 | D+15 | Stephen F. Lynch | Democratic | Incumbent re-elected. |
| |
| Massachusetts 10 | D+8 | Bill Delahunt | Democratic | 1996 | Incumbent re-elected. |
|
Michigan[]
| District | Incumbent | Results | Candidates | |||
|---|---|---|---|---|---|---|
| District | 2004 CPVI | Representative | Party | First elected | ||
| Michigan 1 | R+2 | Bart Stupak | Democratic | 1992 | Incumbent re-elected. |
|
| Michigan 2 | R+9 | Pete Hoekstra | Republican | 1992 | Incumbent re-elected. |
|
| Michigan 3 | R+9 | Vern Ehlers | Republican | Incumbent re-elected. |
| |
| Michigan 4 | R+3 | Dave Camp | Republican | 1990 | Incumbent re-elected. |
|
| Michigan 5 | D+12 | Dale Kildee | Democratic | 1976 | Incumbent re-elected. |
|
| Michigan 6 | R+2 | Fred Upton | Republican | 1986 | Incumbent re-elected. |
|
| Michigan 7 | R+2 | Joe Schwarz | Republican | 2004 | Incumbent lost renomination. New member elected. Republican hold. |
|
| Michigan 8 | R+2 | Mike Rogers | Republican | 2000 | Incumbent re-elected. |
|
| Michigan 9 | EVEN | Joe Knollenberg | Republican | 1992 | Incumbent re-elected. |
|
| Michigan 10 | R+4 | Candice Miller | Republican | 2002 | Incumbent re-elected. |
|
| Michigan 11 | R+1 | Thad McCotter | Republican | 2002 | Incumbent re-elected. |
|
| Michigan 12 | D+13 | Sander Levin | Democratic | 1982 | Incumbent re-elected. |
|
| Michigan 13 | D+32 | Carolyn Cheeks Kilpatrick | Democratic | 1996 | Incumbent re-elected. |
|
| Michigan 14 | D+33 | John Conyers | Democratic | 1964 | Incumbent re-elected. |
|
| Michigan 15 | D+13 | John Dingell | Democratic | 1955 (Special) | Incumbent re-elected. |
|
Minnesota[]
| District | Incumbent | Results | Candidates | |||
|---|---|---|---|---|---|---|
| District | 2004 CPVI | Representative | Party | First elected | ||
| Minnesota 1 | R+1 | Gil Gutknecht | Republican | 1994 | Incumbent lost re-election. New member elected. Democratic gain. |
|
| Minnesota 2 | R+3 | John Kline | Republican | 2002 | Incumbent re-elected. |
|
| Minnesota 3 | R+1 | Jim Ramstad | Republican | 1990 | Incumbent re-elected. |
|
| Minnesota 4 | D+13 | Betty McCollum | Democratic | 2000 | Incumbent re-elected. |
|
| Minnesota 5 | D+21 | Martin Olav Sabo | Democratic | 1978 | Incumbent retired. New member elected. Democratic hold. |
|
| Minnesota 6 | R+5 | Mark Kennedy | Republican | 2000 | Retired to run for U.S. Senator. New member elected. Republican hold. |
|
| Minnesota 7 | R+6 | Collin Peterson | Democratic | 1990 | Incumbent re-elected. |
|
| Minnesota 8 | D+4 | Jim Oberstar | Democratic | 1974 | Incumbent re-elected. |
|
Mississippi[]
| District | Incumbent | Results | Candidates | |||
|---|---|---|---|---|---|---|
| District | 2004 CPVI | Representative | Party | First elected | ||
| Mississippi 1 | R+10 | Roger Wicker | Republican | 1994 | Incumbent re-elected. |
|
| Mississippi 2 | D+10 | Bennie Thompson | Democratic | Incumbent re-elected. |
| |
| Mississippi 3 | R+13 | Chip Pickering | Republican | 1996 | Incumbent re-elected. |
|
| Mississippi 4 | R+16 | Gene Taylor | Democratic | Incumbent re-elected. |
| |
Missouri[]
| District | Incumbent | Results | Candidates | |||
|---|---|---|---|---|---|---|
| District | 2004 CPVI | Representative | Party | First elected | ||
| Missouri 1 | D+26 | Lacy Clay | Democratic | 2000 | Incumbent re-elected. |
|
| Missouri 2 | R+9 | Todd Akin | Republican | 2000 | Incumbent re-elected. |
|
| Missouri 3 | D+8 | Russ Carnahan | Democratic | 2004 | Incumbent re-elected. |
|
| Missouri 4 | R+11 | Ike Skelton | Democratic | 1976 | Incumbent re-elected. |
|
| Missouri 5 | D+12 | Emanuel Cleaver | Democratic | 2004 | Incumbent re-elected. |
|
| Missouri 6 | R+5 | Sam Graves | Republican | 2000 | Incumbent re-elected. |
|
| Missouri 7 | R+14 | Roy Blunt | Republican | 1996 | Incumbent re-elected. |
|
| Missouri 8 | R+11 | Jo Ann Emerson | Republican | 1996 | Incumbent re-elected. |
|
| Missouri 9 | R+7 | Kenny Hulshof | Republican | 1996 | Incumbent re-elected. |
|
Montana[]
| District | Incumbent | Results | Candidates | |||
|---|---|---|---|---|---|---|
| District | 2004 CPVI | Representative | Party | First elected | ||
| Montana at-large | R+11 | Denny Rehberg | Republican | 2000 | Incumbent re-elected. |
|
Nebraska[]
| District | Incumbent | Results | Candidates | |||
|---|---|---|---|---|---|---|
| District | 2004 CPVI | Representative | Party | First elected | ||
| Nebraska 1 | R+11 | Jeff Fortenberry | Republican | 2004 | Incumbent re-elected. |
|
| Nebraska 2 | R+9 | Lee Terry | Republican | 1998 | Incumbent re-elected. |
|
| Nebraska 3 | R+24 | Tom Osborne | Republican | 2000 | Retired to run for Governor. New member elected. Republican hold. |
|
Nevada[]
| District | Incumbent | Results | Candidates | |||
|---|---|---|---|---|---|---|
| District | 2004 CPVI | Representative | Party | First elected | ||
| Nevada 1 | D+9 | Shelley Berkley | Democratic | 1998 | Incumbent re-elected. |
|
| Nevada 2 | R+8 | Jim Gibbons | Republican | 1996 | Retired to run for Governor. New member elected. Republican hold. |
|
| Nevada 3 | D+1 | Jon Porter | Republican | 2002 | Incumbent re-elected. |
|
New Hampshire[]
| District | Incumbent | Results | Candidates | |||
|---|---|---|---|---|---|---|
| District | 2004 CPVI | Representative | Party | First elected | ||
| New Hampshire 1 | EVEN | Jeb Bradley | Republican | 2002 | Incumbent lost re-election. New member elected. Democratic gain. |
|
| New Hampshire 2 | D+3 | Charles Bass | Republican | 1994 | Incumbent lost re-election. New member elected. Democratic gain. |
|
New Jersey[]
| District | Incumbent | Results | Candidates | |||
|---|---|---|---|---|---|---|
| District | 2004 CPVI | Representative | Party | First elected | ||
| New Jersey 1 | D+14 | Rob Andrews | Democratic | 1990 | Incumbent re-elected. |
|
| New Jersey 2 | D+4 | Frank LoBiondo | Republican | 1994 | Incumbent re-elected. |
|
| New Jersey 3 | D+3 | Jim Saxton | Republican | 1984 | Incumbent re-elected. |
|
| New Jersey 4 | R+1 | Chris Smith | Republican | 1980 | Incumbent re-elected. |
|
| New Jersey 5 | R+4 | Scott Garrett | Republican | 2002 | Incumbent re-elected. |
|
| New Jersey 6 | D+12 | Frank Pallone | Democratic | 1988 | Incumbent re-elected. |
|
| New Jersey 7 | R+1 | Mike Ferguson | Republican | 2000 | Incumbent re-elected. |
|
| New Jersey 8 | D+12 | Bill Pascrell | Democratic | 1996 | Incumbent re-elected. |
|
| New Jersey 9 | D+13 | Steve Rothman | Democratic | 1996 | Incumbent re-elected. |
|
| New Jersey 10 | D+34 | Donald M. Payne | Democratic | 1988 | Incumbent re-elected. |
|
| New Jersey 11 | R+6 | Rodney Frelinghuysen | Republican | 1994 | Incumbent re-elected. |
|
| New Jersey 12 | D+8 | Rush Holt Jr. | Democratic | 1998 | Incumbent re-elected. |
|
| New Jersey 13 | D+23 | Vacant | Incumbent Bob Menendez (Democratic) resigned January 16, 2006 after being appointed to the U.S. Senate. New member elected. Democratic hold. |
| ||
New Mexico[]
| District | Incumbent | Results | Candidates | |||
|---|---|---|---|---|---|---|
| District | 2004 CPVI | Representative | Party | First elected | ||
| New Mexico 1 | D+2 | Heather Wilson | Republican | 1998 | Incumbent re-elected. |
|
| New Mexico 2 | R+6 | Steve Pearce | Republican | 2002 | Incumbent re-elected. |
|
| New Mexico 3 | D+6 | Tom Udall | Democratic | 1998 | Incumbent re-elected. |
|
New York[]
| District | Incumbent | Results | Candidates | |||
|---|---|---|---|---|---|---|
| District | 2004 CPVI | Representative | Party | First elected | ||
| New York 1 | D+3 | Tim Bishop | Democratic | 2002 | Incumbent re-elected. |
|
| New York 2 | D+7 | Steve Israel | Democratic | 2000 | Incumbent re-elected. |
|
| New York 3 | D+2 | Peter T. King | Republican | 1992 | Incumbent re-elected. |
|
| New York 4 | D+9 | Carolyn McCarthy | Democratic | 1996 | Incumbent re-elected. |
|
| New York 5 | D+18 | Gary Ackerman | Democratic | 1983 (Special) | Incumbent re-elected. |
|
| New York 6 | D+38 | Gregory Meeks | Democratic | 1998 | Incumbent re-elected. |
|
| New York 7 | D+28 | Joseph Crowley | Democratic | 1998 | Incumbent re-elected. |
|
| New York 8 | D+28 | Jerrold Nadler | Democratic | 1992 | Incumbent re-elected. |
|
| New York 9 | D+14 | Anthony Weiner | Democratic | 1998 | Incumbent re-elected. |
|
| New York 10 | D+41 | Ed Towns | Democratic | 1982 | Incumbent re-elected. |
|
| New York 11 | D+40 | Major Owens | Democratic | 1982 | Incumbent retired. New member elected. Democratic hold. |
|
| New York 12 | D+34 | Nydia Velazquez | Democratic | 1992 | Incumbent re-elected. |
|
| New York 13 | D+1 | Vito Fossella | Republican | 1997 (Special) | Incumbent re-elected. |
|
| New York 14 | D+26 | Carolyn Maloney | Democratic | 1992 | Incumbent re-elected. |
|
| New York 15 | D+43 | Charles Rangel | Democratic | 1970 | Incumbent re-elected. |
|
| New York 16 | D+43 | José E. Serrano | Democratic | 1990 | Incumbent re-elected. |
|
| New York 17 | D+21 | Eliot Engel | Democratic | 1988 | Incumbent re-elected. |
|
| New York 18 | D+10 | Nita Lowey | Democratic | 1988 | Incumbent re-elected. |
|
| New York 19 | R+1 | Sue Kelly | Republican | 1994 | Incumbent lost re-election. New member elected. Democratic gain. |
|
| New York 20 | R+3 | John E. Sweeney | Republican | 1998 | Incumbent lost re-election. New member elected. Democratic gain. |
|
| New York 21 | D+9 | Mike McNulty | Democratic | 1988 | Incumbent re-elected. |
|
| New York 22 | D+6 | Maurice Hinchey | Democratic | 1992 | Incumbent re-elected. |
|
| New York 23 | EVEN | John M. McHugh | Republican | 1992 | Incumbent re-elected. |
|
| New York 24 | R+1 | Sherwood Boehlert | Republican | 1982 | Incumbent retired. New member elected. Democratic gain. |
|
| New York 25 | D+3 | James T. Walsh | Republican | 1988 | Incumbent re-elected. |
|
| New York 26 | R+3 | Thomas M. Reynolds | Republican | 1998 | Incumbent re-elected. |
|
| New York 27 | D+7 | Brian Higgins | Democratic | 2004 | Incumbent re-elected. |
|
| New York 28 | D+15 | Louise Slaughter | Democratic | 1986 | Incumbent re-elected. |
|
| New York 29 | R+5 | Randy Kuhl | Republican | 2004 | Incumbent re-elected. |
|
North Carolina[]
| District | Incumbent | Results | Candidates | |||
|---|---|---|---|---|---|---|
| District | 2004 CPVI | Representative | Party | First elected | ||
| North Carolina 1 | D+9 | G. K. Butterfield | Democratic | 2004 | Incumbent re-elected. |
|
| North Carolina 2 | R+3 | Bob Etheridge | Democratic | 1996 | Incumbent re-elected. |
|
| North Carolina 3 | R+15 | Walter B. Jones Jr. | Republican | 1994 | Incumbent re-elected. |
|
| North Carolina 4 | D+6 | David Price | Democratic | 1996 | Incumbent re-elected. |
|
| North Carolina 5 | R+15 | Virginia Foxx | Republican | 2004 | Incumbent re-elected. |
|
| North Carolina 6 | R+17 | Howard Coble | Republican | 1984 | Incumbent re-elected. |
|
| North Carolina 7 | R+3 | Mike McIntyre | Democratic | 1996 | Incumbent re-elected. |
|
| North Carolina 8 | R+3 | Robin Hayes | Republican | 1998 | Incumbent re-elected. |
|
| North Carolina 9 | R+12 | Sue Myrick | Republican | 1994 | Incumbent re-elected. |
|
| North Carolina 10 | R+15 | Patrick McHenry | Republican | 2004 | Incumbent re-elected. |
|
| North Carolina 11 | R+7 | Charles Taylor | Republican | 1990 | Incumbent lost re-election. New member elected. Democratic gain. |
|
| North Carolina 12 | D+11 | Mel Watt | Democratic | 1992 | Incumbent re-elected. |
|
| North Carolina 13 | D+2 | Brad Miller | Democratic | 2002 | Incumbent re-elected. |
|
North Dakota[]
| District | Incumbent | Results | Candidates | |||
|---|---|---|---|---|---|---|
| District | 2004 CPVI | Representative | Party | First elected | ||
| North Dakota at-large | R+13 | Earl Pomeroy | Democratic-NPL | 1992 | Incumbent re-elected. |
|
Ohio[]
| District | Incumbent | Results | Candidates | |||
|---|---|---|---|---|---|---|
| District | 2004 CPVI | Representative | Party | First elected | ||
| Ohio 1 | R+1 | Steve Chabot | Republican | 1994 | Incumbent re-elected. |
|
| Ohio 2 | R+13 | Jean Schmidt | Republican | Incumbent re-elected. |
| |
| Ohio 3 | R+3 | Mike Turner | Republican | 2002 | Incumbent re-elected. |
|
| Ohio 4 | R+14 | Mike Oxley | Republican | Incumbent retired. New member elected. Republican hold. |
| |
| Ohio 5 | R+10 | Paul Gillmor | Republican | 1988 | Incumbent re-elected. |
|
| Ohio 6 | EVEN | Ted Strickland | Democratic | 1992 | Retired to run for Governor. New member elected. Democratic hold. |
|
| Ohio 7 | R+6 | Dave Hobson | Republican | 1990 | Incumbent re-elected. |
|
| Ohio 8 | R+12 | John Boehner | Republican | 1990 | Incumbent re-elected. |
|
| Ohio 9 | D+9 | Marcy Kaptur | Democratic | 1982 | Incumbent re-elected. |
|
| Ohio 10 | D+6 | Dennis Kucinich | Democratic | 1996 | Incumbent re-elected. |
|
| Ohio 11 | D+33 | Stephanie Tubbs Jones | Democratic | 1998 | Incumbent re-elected. |
|
| Ohio 12 | R+1 | Pat Tiberi | Republican | 2000 | Incumbent re-elected. |
|
| Ohio 13 | D+6 | Sherrod Brown | Democratic | 1992 | Retired to run for U.S. Senator. New member elected. Democratic hold. |
|
| Ohio 14 | R+2 | Steve LaTourette | Republican | 1994 | Incumbent re-elected. |
|
| Ohio 15 | R+1 | Deborah Pryce | Republican | 1992 | Incumbent re-elected. |
|
| Ohio 16 | R+4 | Ralph Regula | Republican | 1972 | Incumbent re-elected. |
|
| Ohio 17 | D+14 | Tim Ryan | Democratic | 2002 | Incumbent re-elected. |
|
| Ohio 18 | R+6 | Bob Ney | Republican | 1994 | Incumbent retired and then resigned November 3, 2006. New member elected. Democratic gain. |
|
Oklahoma[]
| District | Incumbent | Results | Candidates | |||
|---|---|---|---|---|---|---|
| District | 2004 CPVI | Representative | Party | First elected | ||
| Oklahoma 1 | R+13 | John A. Sullivan | Republican | 2002 | Incumbent re-elected. |
|
| Oklahoma 2 | R+5 | Dan Boren | Democratic | 2004 | Incumbent re-elected. |
|
| Oklahoma 3 | R+18 | Frank Lucas | Republican | 1994 | Incumbent re-elected. |
|
| Oklahoma 4 | R+13 | Tom Cole | Republican | 2002 | Incumbent re-elected. |
|
| Oklahoma 5 | R+12 | Ernest Istook | Republican | 1992 | Retired to run for Governor. New member elected. Republican hold. |
|
Oregon[]
| District | Incumbent | Results | Candidates | |||
|---|---|---|---|---|---|---|
| District | 2004 CPVI | Representative | Party | First elected | ||
| Oregon 1 | D+6 | David Wu | Democratic | 1998 | Incumbent re-elected. |
|
| Oregon 2 | R+11 | Greg Walden | Republican | 1998 | Incumbent re-elected. |
|
| Oregon 3 | D+18 | Earl Blumenauer | Democratic | 1996 | Incumbent re-elected. |
|
| Oregon 4 | EVEN | Peter DeFazio | Democratic | 1986 | Incumbent re-elected. |
|
| Oregon 5 | D+1 | Darlene Hooley | Democratic | Incumbent re-elected. |
| |
Pennsylvania[]
| District | Incumbent | Results | Candidates | |||
|---|---|---|---|---|---|---|
| District | 2004 CPVI | Representative | Party | First elected | ||
| Pennsylvania 1 | D+36 | Bob Brady | Democratic | 1998 | Incumbent re-elected. |
|
| Pennsylvania 2 | D+39 | Chaka Fattah | Democratic | 1994 | Incumbent re-elected. |
|
| Pennsylvania 3 | R+2 | Phil English | Republican | 1994 | Incumbent re-elected. |
|
| Pennsylvania 4 | R+3 | Melissa Hart | Republican | 2000 | Incumbent lost re-election. New member elected. Democratic gain. |
|
| Pennsylvania 5 | R+10 | John E. Peterson | Republican | 1996 | Incumbent re-elected. |
|
| Pennsylvania 6 | D+2 | Jim Gerlach | Republican | 2002 | Incumbent re-elected. |
|
| Pennsylvania 7 | D+4 | Curt Weldon | Republican | 1986 | Incumbent lost re-election. New member elected. Democratic gain. |
|
| Pennsylvania 8 | D+3 | Mike Fitzpatrick | Republican | 2004 | Incumbent lost re-election. New member elected. Democratic gain. |
|
| Pennsylvania 9 | R+15 | Bill Shuster | Republican | Incumbent re-elected. |
| |
| Pennsylvania 10 | R+8 | Don Sherwood | Republican | 1998 | Incumbent lost re-election. New member elected. Democratic gain. |
|
| Pennsylvania 11 | D+5 | Paul Kanjorski | Democratic | 1984 | Incumbent re-elected. |
|
| Pennsylvania 12 | D+5 | John Murtha | Democratic | 1974 | Incumbent re-elected. |
|
| Pennsylvania 13 | D+8 | Allyson Schwartz | Democratic | 2004 | Incumbent re-elected. |
|
| Pennsylvania 14 | D+22 | Michael F. Doyle | Democratic | 1994 | Incumbent re-elected. |
|
| Pennsylvania 15 | D+2 | Charlie Dent | Republican | 2004 | Incumbent re-elected. |
|
| Pennsylvania 16 | R+11 | Joe Pitts | Republican | 1996 | Incumbent re-elected. |
|
| Pennsylvania 17 | R+7 | Tim Holden | Democratic | 1992 | Incumbent re-elected. |
|
| Pennsylvania 18 | R+2 | Tim Murphy | Republican | 2002 | Incumbent re-elected. |
|
| Pennsylvania 19 | R+12 | Todd Platts | Republican | 2000 | Incumbent re-elected. |
|
Rhode Island[]
| District | Incumbent | Results | Candidates | |||
|---|---|---|---|---|---|---|
| District | 2004 CPVI | Representative | Party | First elected | ||
| Rhode Island 1 | D+16 | Patrick J. Kennedy | Democratic | 1994 | Incumbent re-elected. |
|
| Rhode Island 2 | D+13 | Jim Langevin | Democratic | 2000 | Incumbent re-elected. |
|
South Carolina[]
| District | Incumbent | Results | Candidates | |||
|---|---|---|---|---|---|---|
| District | 2004 CPVI | Representative | Party | First elected | ||
| South Carolina 1 | R+10 | Henry E. Brown Jr. | Republican | 2000 | Incumbent re-elected. |
|
| South Carolina 2 | R+9 | Addison G. Wilson | Republican | Incumbent re-elected. |
| |
| South Carolina 3 | R+14 | J. Gresham Barrett | Republican | 2002 | Incumbent re-elected. |
|
| South Carolina 4 | R+15 | Bob Inglis | Republican | 2004 | Incumbent re-elected. |
|
| South Carolina 5 | R+6 | John Spratt | Democratic | 1982 | Incumbent re-elected. |
|
| South Carolina 6 | D+11 | Jim Clyburn | Democratic | 1992 | Incumbent re-elected. |
|
South Dakota[]
| District | Incumbent | Results | Candidates | |||
|---|---|---|---|---|---|---|
| District | 2004 CPVI | Representative | Party | First elected | ||
| South Dakota at-large | R+10 | Stephanie Herseth | Democratic | 2004 | Incumbent re-elected. |
|
Tennessee[]
| District | Incumbent | Results | Candidates | |||
|---|---|---|---|---|---|---|
| District | 2004 CPVI | Representative | Party | First elected | ||
| Tennessee 1 | R+14 | Bill Jenkins | Republican | 1996 | Incumbent retired. New member elected. Republican hold. |
|
| Tennessee 2 | R+11 | Jimmy Duncan | Republican | 1998 | Incumbent re-elected. |
|
| Tennessee 3 | R+8 | Zach Wamp | Republican | 1994 | Incumbent re-elected. |
|
| Tennessee 4 | R+3 | Lincoln Davis | Democratic | 2002 | Incumbent re-elected. |
|
| Tennessee 5 | D+6 | Jim Cooper | Democratic | 2002 | Incumbent re-elected. |
|
| Tennessee 6 | R+4 | Bart Gordon | Democratic | 1984 | Incumbent re-elected. |
|
| Tennessee 7 | R+12 | Marsha Blackburn | Republican | 2002 | Incumbent re-elected. |
|
| Tennessee 8 | EVEN | John Tanner | Democratic | 1988 | Incumbent re-elected. |
|
| Tennessee 9 | D+18 | Harold Ford Jr. | Democratic | 1996 | Retired to run for U.S. Senator. New member elected. Democratic hold. |
|
Texas[]
Texas's 22nd district was held by Tom DeLay who had resigned. The Democratic Party sued to prevent the Republican Party from replacing Tom DeLay (who was determined to be the candidate in March 2006) with another candidate. The courts agreed with the Democratic Party and the Supreme Court has refused to hear the appeal. On August 8, 2006, Tom DeLay officially withdrew his name as the Republican candidate. (The court decision did not allow the Republican Party from changing its candidate, however it did not prevent Tom DeLay from withdrawing altogether.)[27]
Texas's 23rd district was declared unconstitutional by the Supreme Court of the United States, which ordered the district re-drawn. This affected the 15th, 21st, 23rd, 25th, and 28th districts, which had a blanket primary on Election Day, followed by a runoff on December 6 in District 23, where no candidate got a majority of the vote.
| District | Incumbent | Results | Candidates | |||
|---|---|---|---|---|---|---|
| District | 2004 CPVI | Representative | Party | First elected | ||
| Texas 1 | R+17 | Louie Gohmert | Republican | 2004 | Incumbent re-elected. |
|
| Texas 2 | R+12 | Ted Poe | Republican | 2004 | Incumbent re-elected. |
|
| Texas 3 | R+17 | Sam Johnson | Republican | Incumbent re-elected. |
| |
| Texas 4 | R+17 | Ralph Hall | Republican | 1980 | Incumbent re-elected. |
|
| Texas 5 | R+16 | Jeb Hensarling | Republican | 2002 | Incumbent re-elected. |
|
| Texas 6 | R+15 | Joe Barton | Republican | 1984 | Incumbent re-elected. |
|
| Texas 7 | R+16 | John Culberson | Republican | 2000 | Incumbent re-elected. |
|
| Texas 8 | R+20 | Kevin Brady | Republican | 1996 | Incumbent re-elected. |
|
| Texas 9 | D+21 | Al Green | Democratic | 2004 | Incumbent re-elected. |
|
| Texas 10 | R+13 | Michael McCaul | Republican | 2004 | Incumbent re-elected. |
|
| Texas 11 | R+25 | Mike Conaway | Republican | 2004 | Incumbent re-elected. |
|
| Texas 12 | R+14 | Kay Granger | Republican | 1996 | Incumbent re-elected. |
|
| Texas 13 | R+18 | Mac Thornberry | Republican | 1994 | Incumbent re-elected. |
|
| Texas 14 | R+14 | Ron Paul | Republican | 1996 | Incumbent re-elected. |
|
| Texas 15 | D+3 | Ruben Hinojosa | Democratic | 1996 | Incumbent re-elected. |
|
| Texas 16 | D+9 | Silvestre Reyes | Democratic | 1996 | Incumbent re-elected. |
|
| Texas 17 | R+18 | Chet Edwards | Democratic | 1990 | Incumbent re-elected. |
|
| Texas 18 | D+23 | Sheila Jackson Lee | Democratic | 1994 | Incumbent re-elected. |
|
| Texas 19 | R+25 | Randy Neugebauer | Republican | 2002 | Incumbent re-elected. |
|
| Texas 20 | D+8 | Charlie Gonzalez | Democratic | 1998 | Incumbent re-elected. |
|
| Texas 21 | R+13 | Lamar S. Smith | Republican | 1986 | Incumbent re-elected. |
|
| Texas 22 | R+15 | Shelley Sekula-Gibbs | Republican | 2006 | Incumbent lost re-election. New member elected. Democratic gain. |
|
| Texas 23 | R+4 | Henry Bonilla | Republican | 1992 |
Incumbent lost re-election in run-off (district |
|
| Texas 24 | R+15 | Kenny Marchant | Republican | 2004 | Incumbent re-elected. |
|
| Texas 25 | D+1 | Lloyd Doggett | Democratic | 1994 | Incumbent re-elected. |
|
| Texas 26 | R+12 | Michael C. Burgess | Republican | 2002 | Incumbent re-elected. |
|
| Texas 27 | R+1 | Solomon Ortiz | Democratic | 1982 | Incumbent re-elected. |
|
| Texas 28 | R+1 | Henry Cuellar | Democratic | 2004 | Incumbent re-elected. |
|
| Texas 29 | D+8 | Gene Green | Democratic | 1992 | Incumbent re-elected. |
|
| Texas 30 | D+26 | Eddie Bernice Johnson | Democratic | 1992 | Incumbent re-elected. |
|
| Texas 31 | R+15 | John Carter | Republican | 2002 | Incumbent re-elected. |
|
| Texas 32 | R+11 | Pete Sessions | Republican | 1996 | Incumbent re-elected. |
|
Utah[]
| District | Incumbent | Results | Candidates | |||
|---|---|---|---|---|---|---|
| District | 2004 CPVI | Representative | Party | First elected | ||
| Utah 1 | R+26 | Rob Bishop | Republican | 2002 | Incumbent re-elected. |
|
| Utah 2 | R+17 | Jim Matheson | Democratic | 2000 | Incumbent re-elected. |
|
| Utah 3 | R+22 | Chris Cannon | Republican | 1996 | Incumbent re-elected. |
|
Vermont[]
| District | Incumbent | Results | Candidates | |||
|---|---|---|---|---|---|---|
| District | 2004 CPVI | Representative | Party | First elected | ||
| Vermont at-large | D+8 | Bernie Sanders | Independent | 1990 | Retired to run for U.S. Senator. New member elected. Democratic gain. |
|
Virginia[]
| District | Incumbent | Results | Candidates | |||
|---|---|---|---|---|---|---|
| District | 2004 CPVI | Representative | Party | First elected | ||
| Virginia 1 | R+9 | Jo Ann Davis | Republican | 2000 | Incumbent re-elected. |
|
| Virginia 2 | R+6 | Thelma Drake | Republican | 2004 | Incumbent re-elected. |
|
| Virginia 3 | D+18 | Robert C. Scott | Democratic | 1992 | Incumbent re-elected. |
|
| Virginia 4 | R+5 | Randy Forbes | Republican | Incumbent re-elected. |
| |
| Virginia 5 | R+6 | Virgil Goode | Republican | 1996 | Incumbent re-elected. |
|
| Virginia 6 | R+11 | Bob Goodlatte | Republican | 1992 | Incumbent re-elected. |
|
| Virginia 7 | R+11 | Eric Cantor | Republican | 2000 | Incumbent re-elected. |
|
| Virginia 8 | D+14 | Jim Moran | Democratic | 1990 | Incumbent re-elected. |
|
| Virginia 9 | R+7 | Rick Boucher | Democratic | 1982 | Incumbent re-elected. |
|
| Virginia 10 | R+5 | Frank Wolf | Republican | 1980 | Incumbent re-elected. |
|
| Virginia 11 | R+1 | Thomas M. Davis | Republican | 1994 | Incumbent re-elected. |
|
Washington[]
| District | Incumbent | Results | Candidates | |||
|---|---|---|---|---|---|---|
| District | 2004 CPVI | Representative | Party | First elected | ||
| Washington 1 | D+7 | Jay Inslee | Democratic | 1998 | Incumbent re-elected. |
|
| Washington 2 | D+3 | Rick Larsen | Democratic | 2000 | Incumbent re-elected. |
|
| Washington 3 | EVEN | Brian Baird | Democratic | 1998 | Incumbent re-elected. |
|
| Washington 4 | R+13 | Doc Hastings | Republican | 1994 | Incumbent re-elected. |
|
| Washington 5 | R+7 | Cathy McMorris | Republican | 2004 | Incumbent re-elected. |
|
| Washington 6 | D+6 | Norm Dicks | Democratic | 1976 | Incumbent re-elected. |
|
| Washington 7 | D+30 | Jim McDermott | Democratic | 1988 | Incumbent re-elected. |
|
| Washington 8 | D+2 | Dave Reichert | Republican | 2004 | Incumbent re-elected. |
|
| Washington 9 | D+6 | Adam Smith | Democratic | 1996 | Incumbent re-elected. |
|
West Virginia[]
| District | Incumbent | Results | Candidates | |||
|---|---|---|---|---|---|---|
| District | 2004 CPVI | Representative | Party | First elected | ||
| West Virginia 1 | R+6 | Alan Mollohan | Democratic | 1982 | Incumbent re-elected. |
|
| West Virginia 2 | R+5 | Shelley Capito | Republican | 2000 | Incumbent re-elected. |
|
| West Virginia 3 | EVEN | Nick Rahall | Democratic | 1976 | Incumbent re-elected. |
|
Wisconsin[]
| District | Incumbent | Results | Candidates | |||
|---|---|---|---|---|---|---|
| District | 2004 CPVI | Representative | Party | First elected | ||
| Wisconsin 1 | R+2 | Paul Ryan | Republican | 1998 | Incumbent re-elected. |
|
| Wisconsin 2 | D+13 | Tammy Baldwin | Democratic | 1998 | Incumbent re-elected. |
|
| Wisconsin 3 | D+3 | Ron Kind | Democratic | 1996 | Incumbent re-elected. |
|
| Wisconsin 4 | D+20 | Gwen Moore | Democratic | 2004 | Incumbent re-elected. |
|
| Wisconsin 5 | R+12 | Jim Sensenbrenner | Republican | 1978 | Incumbent re-elected. |
|
| Wisconsin 6 | R+5 | Tom Petri | Republican | Incumbent re-elected. |
| |
| Wisconsin 7 | D+2 | Dave Obey | Democratic | Incumbent re-elected. |
| |
| Wisconsin 8 | EVEN | Mark Andrew Green | Republican | 1998 | Retired to run for Governor. New member elected. Democratic gain. |
|
Wyoming[]
| District | Incumbent | Results | Candidates | |||
|---|---|---|---|---|---|---|
| District | 2004 CPVI | Representative | Party | First elected | ||
| Wyoming at-large | R+19 | Barbara Cubin | Republican | 1994 | Incumbent re-elected. |
|
Non-voting delegates[]
| District | Incumbent | Party | First elected |
Results | Candidates |
|---|---|---|---|---|---|
| American Samoa at-large | Eni Faleomavaega | Democratic | 1988 | Incumbent re-elected. |
|
| District of Columbia at-large | Eleanor Holmes Norton | Democratic | 1990 | Incumbent re-elected. |
|
| Guam at-large | Madeleine Bordallo | Democratic | Incumbent re-elected. |
| |
| U.S. Virgin Islands at-large | Donna Christian-Christensen | Democratic | Incumbent . |
|
See also[]
- 2006 United States elections
- 2006 United States gubernatorial elections
- 2006 United States Senate elections
- 2006 United States general elections
- 109th United States Congress
- 110th United States Congress
- Fighting Dems
Notes[]
- ^ In addition, four of the five non-voting delegates in the U.S. House of Representatives were elected.
References[]
- ^ "So Why Did the Democrats Win?". Time Magazine. November 15, 2006. Retrieved March 6, 2014.
- ^ Rose, Don (December 26, 2006). "Democratic sweep may be long-lasting". Chicago Tribune. Retrieved April 9, 2014.
- ^ "Democrats win House, promise new direction". CNN. November 8, 2006. Retrieved March 6, 2014.
- ^ "CNN.com - Elections 2006". CNN. Retrieved January 31, 2018.
- ^ [1], as of November 6, 2006
- ^ [2], as of November 6, 2006
- ^ Archibold, Randal C. (September 11, 2006). "In Cost and Vitriol, Race in Arizona Draws Notice". The New York Times. Retrieved May 26, 2010.
- ^ Kamman, Jon (September 22, 2006). "GOP cancels $1 mil in Graf ad support". The Arizona Republic.
- ^ "California's 11th district primary election results". Archived from the original on 2006-06-16. Retrieved 2006-06-20.
- ^ "McCloskey Bucks GOP, Backs Democrat". A Stand for Justice. Associated Press. July 24, 2006.
- ^ "Recount Gives Courtney Win In 2nd District". NBC Connecticut. Archived from the original on September 27, 2007.
- ^ "U.S. House of Representatives / Florida 16". America Votes 2006. CNN.
Official results from Florida Secretary of State - ^ Lee, Mara (July 2, 2006). "Candidates cash in on celebrities". Evansville Courier & Press.
- ^ "U.S. House of Representatives / Minnesota 01". America Votes 2006. CNN.
- ^ "constituentdynamics.com | Domain For Sale". constituentdynamics.com | Domain For Sale.
- ^ Tomlin, John (April 27, 2006). "Congressman Socializes with Students". Concordiensis. Archived from the original on April 30, 2008.
- ^ "Shuler keeps lead for US House" (PDF) (Press release). Public Policy Polling. Archived from the original (PDF) on July 15, 2006.
- ^ Stout, David (August 7, 2006). "Ohio Congressman Will Not Seek Re-election". The New York Times.
- ^ "Altmire Pulls Off Upset Against Melissa Hart". KDKA-TV. November 8, 2006. Archived from the original on September 27, 2007.
- ^ Shiffman, John; Lipka, Mitch; Kerkstra, Patrick (October 16, 2006). "Agents raid homes of Rep. Curt Weldon's daughter, close friend". The Philadelphia Inquirer. Archived from the original on November 13, 2006.CS1 maint: bot: original URL status unknown (link)
- ^ "FBI raids home of Weldon's daughter, friend in influence probe". WHDH-TV. Associated Press. October 16, 2006. Archived from the original on November 17, 2006.CS1 maint: bot: original URL status unknown (link)
- ^ Giroux, Greg (October 13, 2006). "Navy Vet Sestak Coming Closer to Sinking Weldon in Pa. 7". CQPolitics.com. Archived from the original on October 27, 2006.
- ^ "CQPolitics.com - Rodriguez to Mount Comeback Bid in Texas' Redrawn 23rd". August 13, 2006. Archived from the original on 2006-08-13.
- ^ "Vote-USA | Jerry Trudell | Previous Candidate for US Senator, Vermont". vote-usa.org.
- ^ Incumbent Mark Foley resigned on September 29, 2006, simultaneously withdrawing from the race. Republican leaders in this district chose Joe Negron to replace Foley, but due to Florida election law, Foley's name remained on the ballot, and all votes for Foley counted as votes for Negron.
- ^ Because Bill Jefferson did not win 50% of the vote in the November 7, 2006, election (technically an "open primary" in Louisiana), he faced a runoff election against Louisiana State Representative Karen Carter on December 9, 2006. Jefferson was victorious, earning 57% of the vote to Carter's 43%.
- ^ Gamboa, Suzanne (August 8, 2006). "DeLay to Make Way for Write-In Candidate". The Washington Post.
External links[]
- 2006 Election Guide The New York Times
- check on voter registration
- 2006 Election Projections Survey
- United States Election 2006 Web Archive from the U.S. Library of Congress
| show Nancy Pelosi |
|---|

- 2006 United States House of Representatives elections
- November 2006 events in the United States