Kansas's 3rd congressional district
| Kansas's 3rd congressional district | |||
|---|---|---|---|
 Kansas's 3rd congressional district since January 3, 2013 | |||
| Representative |
| ||
| Distribution |
| ||
| Population (2020) | 792,286 | ||
| Median household income | $81,792[1] | ||
| Ethnicity |
| ||
| Cook PVI | D+1[2] | ||
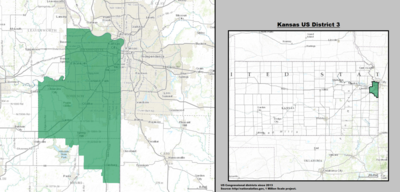
Kansas's 3rd congressional district is a congressional district in the U.S. state of Kansas. Located in eastern Kansas, the district encompasses all of Wyandotte and Johnson counties and parts of Miami County. The district includes the heart of the Kansas side of the Kansas City metropolitan area, including Kansas City, Overland Park, Lenexa, Shawnee, Spring Hill, DeSoto, and Olathe.
The district is currently represented by Democrat Sharice Davids, who was first elected in 2018, defeating Republican incumbent Kevin Yoder. With a Cook Partisan Voting Index rating of D+1, it is the only Democratic district in Kansas.[2]
Demographics[]
This section needs to be updated. (October 2012) |
Following redistricting after the 2000 U.S. Census,[3][needs update] there were 672,124 people, 258,439 households, and 173,022 families residing in the district. The population density was 864.4/mi2 over a land area of 778 square miles (2,020 km2). There were 272,721 housing units at an average density of 350.7/mi2. The racial makeup of the district is 82.70% White, 8.88% Black or African American, 2.60% Asian, 0.70% Native American, 0.04% Pacific Islander, 3.09% from other races, and 1.99% from two or more races. Hispanic or Latino of any race were 6.79% of the population.
There were 258,439 households, out of which 36.52% had children under the age of 18 living with them, 53.21% were married couples living together, 10.27% had a female householder with no husband present, and 33.05% were non-families. 26.12% of all households were made up of individuals, and 7.35% had someone living alone who was 65 years of age or older. The average household size was 2.55 and the average family size was 3.11.
In the district the population distribution by age is 26.60% under the age of 18, 10.49% from 18 to 24, 31.65% from 25 to 44, 21.17% from 45 to 64, and 10.09% who were 65 years of age or older. The median age was 33.6 years. For every 100 females there were 95.78 males. For every 100 females age 18 and over, there were 92.54 males.
The median income for a household in the district is $51,118, and the median income for a family was $62,695. Males had a median income of $42,348 versus $30,353 for females. The per capita income for the district was $26,133. About 4.9% of families and 7.8% of the population were below the poverty line, including 8.7% of those under age 18 and 6.0% of those age 65 or over.
Among the population aged 16 years and older, 71.0% was in the civilian labor force and 0.1% were in the armed forces. Of the employed civilian workers, 12.8% were government workers and 5.6% were self-employed. Management, professional, and related occupations employed 41.5% of the work force and sales and office occupations an additional 28.8%. Only 0.2% were employed in farming, fishing, and forestry occupations. The largest employment by industry was: educational, health and social services, 19.8%; professional, scientific, management, administrative, and waste management services, 12.0%; retail trade, 11.8%; and manufacturing, 10.4%. Agriculture, forestry, fishing and hunting, and mining industries only employed 0.4%.
The district's character is very different from the rest of Kansas, largely due to the influence of Kansas City and its suburbs. While Kansas's other congressional districts include significant rural territory, the 3rd is almost exclusively urban and suburban. As such, it is much friendlier to Democrats than the rest of the state. It was the only district in Kansas carried by Barack Obama in 2008, Hillary Clinton in 2016, and Joe Biden in 2020. The largest county, Johnson, has traditionally leaned Republican, though the brand of Republicanism practiced in the county has traditionally been a moderate one. The second-largest, Wyandotte, has long been one of the most Democratic counties in the state.
List of members representing the district[]
| Member (District home) |
Party | Years | Cong ress |
Electoral history | District map |
|---|---|---|---|---|---|
| District created March 4, 1875 | |||||
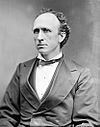
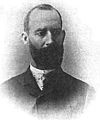
 William Ripley Brown (Emporia) |
Republican | March 4, 1875 – March 3, 1877 |
44th | Elected in 1874. Lost renomination. | |
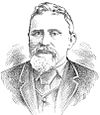
 Thomas Ryan (Topeka) |
Republican | March 4, 1877 – March 3, 1885 |
45th 46th 47th 48th |
Elected in 1876. Re-elected in 1878. Re-elected in 1880. Re-elected in 1882. Redistricted to the 4th district. | |
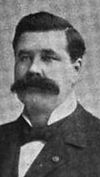
 Bishop W. Perkins (Parsons) |
Republican | March 4, 1885 – March 3, 1891 |
49th 50th 51st |
Redistricted from the at-large district and re-elected in 1884. Re-elected in 1886. Re-elected in 1888. Lost re-election. | |
 Benjamin H. Clover (Douglass) |
Populist | March 4, 1891 – March 3, 1893 |
52nd | Elected in 1890. Retired. | |
 Thomas J. Hudson (Fredonia) |
Populist | March 4, 1893 – March 3, 1895 |
53rd | Elected in 1892. Retired. | |
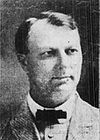
 Snyder S. Kirkpatrick (Fredonia) |
Republican | March 4, 1895 – March 3, 1897 |
54th | Re-elected in 1894. Lost re-election. | |
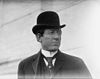
 Edwin R. Ridgely (Girard) |
Populist | March 4, 1897 – March 3, 1901 |
55th 56th |
Elected in 1896. Re-elected in 1898. Retired. | |
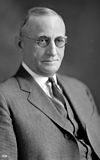
 Alfred M. Jackson (Winfield) |
Democratic | March 4, 1901 – March 3, 1903 |
57th | Elected in 1900. Lost re-election. | |
 Philip P. Campbell (Pittsburg) |
Republican | March 4, 1903 – March 3, 1923 |
58th 59th 60th 61st 62nd 63rd 64th 65th 66th 67th |
Elected in 1902. Re-elected in 1904. Re-elected in 1906. Re-elected in 1908. Re-elected in 1910. Re-elected in 1912. Re-elected in 1914. Re-elected in 1916. Re-elected in 1918. Re-elected in 1920. Lost renomination. | |
 William H. Sproul (Sedan) |
Republican | March 4, 1923 – March 3, 1931 |
68th 69th 70th 71st |
Elected in 1922. Re-elected in 1924. Re-elected in 1926. Re-elected in 1928. Retired to Run for U.S. senator. | |
 Harold C. McGugin (Coffeyville) |
Republican | March 4, 1931 – January 3, 1935 |
72nd 73rd |
Elected in 1930. Re-elected in 1932. Lost re-election. | |
 Edward W. Patterson (Pittsburg) |
Democratic | January 3, 1935 – January 3, 1939 |
74th 75th |
Re-elected in 1934. Re-elected in 1936. Lost re-election. | |
 Thomas D. Winter (Girard) |
Republican | January 3, 1939 – January 3, 1947 |
76th 77th 78th 79th |
Elected in 1938. Re-elected in 1940. Re-elected in 1942. Re-elected in 1944. Lost renomination. | |
 Herbert A. Meyer (Independence) |
Republican | January 3, 1947 – October 2, 1950 |
80th 81st |
Elected in 1946. Re-elected in 1948. Died. | |
| Vacant | October 2, 1950 – November 7, 1950 |
81st | |||
 Myron V. George (Altamont) |
Republican | November 7, 1950 – January 3, 1959 |
81st 82nd 83rd 84th 85th |
Elected in 1950 and seated early. Re-elected in 1952. Re-elected in 1954. Re-elected in 1956. Lost re-election. | |
 Denver D. Hargis (Coffeyville) |
Democratic | January 3, 1959 – January 3, 1961 |
86th | Elected in 1958. Lost re-election. | |
 Walter Lewis McVey Jr. (Independence) |
Republican | January 3, 1961 – January 3, 1963 |
87th | Elected in 1960. Lost renomination. | |
 Robert Ellsworth (Lawrence) |
Republican | January 3, 1963 – January 3, 1967 |
88th 89th |
Redistricted from the 2nd district and re-elected in 1962. Re-elected in 1964. Retired to run for U.S. senator. | |
 Larry Winn (Prairie Village) |
Republican | January 3, 1967 – January 3, 1985 |
90th 91st 92nd 93rd 94th 95th 96th 97th 98th |
Elected in 1966. Re-elected in 1968. Re-elected in 1970. Re-elected in 1972. Re-elected in 1974. Re-elected in 1976. Re-elected in 1978. Re-elected in 1980. Re-elected in 1982. Retired. | |
 Jan Meyers (Overland Park) |
Republican | January 3, 1985 – January 3, 1997 |
99th 100th 101st 102nd 103rd 104th |
Elected in 1984. Re-elected in 1986. Re-elected in 1988. Re-elected in 1990. Re-elected in 1992. Re-elected in 1994. Retired. | |
 Vince Snowbarger (Olathe) |
Republican | January 3, 1997 – January 3, 1999 |
105th | Elected in 1996. Lost re-election. | |
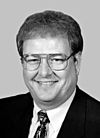
 Dennis Moore (Lenexa) |
Democratic | January 3, 1999 – January 3, 2011 |
106th 107th 108th 109th 110th 111th |
Elected in 1998. Re-elected in 2000. Re-elected in 2002. Re-elected in 2004. Re-elected in 2006. Re-elected in 2008. Retired. | |
2003-2013
| |||||
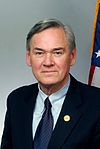
 Kevin Yoder (Overland Park) |
Republican | January 3, 2011 – January 3, 2019 |
112th 113th 114th 115th |
Elected in 2010. Re-elected in 2012. Re-elected in 2014. Re-elected in 2016. Lost re-election. | |
2013-present
| |||||
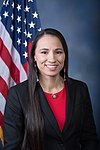 Sharice Davids (Roeland Park) |
Democratic | January 3, 2019 – Present |
116th 117th |
Elected in 2018. Re-elected in 2020. | |
Election results from presidential races[]
| Year | Office | Results | Party that won the district |
|---|---|---|---|
| 2000 | President | George W. Bush 53% - Al Gore 42% | Republican Party |
| 2004 | President | George W. Bush 55% - John Kerry 44% | Republican Party |
| 2008 | President | Barack Obama 51% - John McCain 48% | Democratic Party |
| 2012 | President | Mitt Romney 54% - Barack Obama 46% | Republican Party |
| 2016 | President | Hillary Clinton 47% - Donald Trump 46% | Democratic Party |
| 2020 | President | Joe Biden 54% - Donald Trump 44% | Democratic Party |
Recent election results[]
2002[]
| Party | Candidate | Votes | % | |
|---|---|---|---|---|
| Democratic | Dennis Moore* | 107,931 | 50.16 | |
| Republican | Adam Taff | 100,999 | 46.93 | |
| Reform | Dawn Bly | 4,934 | 2.29 | |
| Libertarian | Doug Martin | 1,328 | 0.62 | |
| Total votes | 215,192 | 100.00 | ||
| Turnout | ||||
| Democratic hold | ||||
2004[]
| Party | Candidate | Votes | % | |
|---|---|---|---|---|
| Democratic | Dennis Moore* | 184,050 | 54.82 | |
| Republican | Kris Kobach | 145,542 | 43.35 | |
| Libertarian | Joe Bellis | 3,191 | 0.95 | |
| Reform | Richard Wells | 2,956 | 0.88 | |
| Total votes | 335,739 | 100.00 | ||
| Turnout | ||||
| Democratic hold | ||||
2006[]
| Party | Candidate | Votes | % | |
|---|---|---|---|---|
| Democratic | Dennis Moore* | 149,480 | 64.47 | |
| Republican | Chuck Ahner | 78,446 | 33.84 | |
| Reform | Robert A. Conroy | 3,925 | 1.69 | |
| Total votes | 231,851 | 100.00 | ||
| Turnout | ||||
| Democratic hold | ||||
2008[]
| Party | Candidate | Votes | % | |
|---|---|---|---|---|
| Democratic | Dennis Moore* | 202,541 | 56.44 | |
| Republican | Nick Jordan | 142,307 | 39.66 | |
| Libertarian | Joe Bellis | 10,073 | 2.81 | |
| Reform | Roger Tucker | 3,937 | 1.10 | |
| Total votes | 358,858 | 100.00 | ||
| Turnout | ||||
| Democratic hold | ||||
2010[]
| Party | Candidate | Votes | % | |||
|---|---|---|---|---|---|---|
| Republican | Kevin Yoder | 136,246 | 58.40 | |||
| Democratic | Stephene Moore | 90,193 | 38.66 | |||
| Libertarian | Jasmin Talbert | 6,846 | 2.94 | |||
| Total votes | 233,285 | 100.00 | ||||
| Turnout | ||||||
| Republican gain from Democratic | ||||||
2012[]
| Party | Candidate | Votes | % | |
|---|---|---|---|---|
| Republican | Kevin Yoder (incumbent) | 201,087 | 68.5 | |
| Libertarian | Joel Balam | 92,675 | 31.5 | |
| Total votes | 293,762 | 100 | ||
| Republican hold | ||||
2014[]
| Party | Candidate | Votes | % | |
|---|---|---|---|---|
| Republican | Kevin Yoder (incumbent) | 134,493 | 60.02 | |
| Democratic | Kelly Kultala | 89,584 | 39.98 | |
| Total votes | 224,077 | 100 | ||
| Republican hold | ||||
2016[]
| Party | Candidate | Votes | % | |
|---|---|---|---|---|
| Republican | Kevin Yoder (incumbent) | 176,022 | 51.3 | |
| Democratic | Jay Sidie | 139,300 | 40.6 | |
| Libertarian | Steve Hohe | 27,791 | 8.1 | |
| Total votes | 343,113 | 100 | ||
| Republican hold | ||||
2018[]
| Party | Candidate | Votes | % | |||
|---|---|---|---|---|---|---|
| Democratic | Sharice Davids | 164,253 | 53.3 | |||
| Republican | Kevin Yoder (incumbent) | 136,104 | 44.2 | |||
| Libertarian | Chris Clemmons | 7,643 | 2.5 | |||
| Total votes | 308,000 | 100 | ||||
| Democratic gain from Republican | ||||||
2020[]
| Party | Candidate | Votes | % | ||
|---|---|---|---|---|---|
| Democratic | Sharice Davids (incumbent) | 220,049 | 53.6 | ||
| Republican | Amanda Adkins | 178,773 | 43.6 | ||
| Libertarian | Steven Hohe | 11,596 | 2.8 | ||
| Total votes | 410,418 | 100 | |||
| Democratic hold | |||||
Historical district boundaries[]

See also[]
References[]
- ^ Center for New Media & Promotion (CNMP), US Census Bureau. "My Congressional District". www.census.gov.
- ^ a b Wasserman, David. "Introducing the 2021 Cook Political Report Partisan Voter Index". Cook Political Report. Cook Political Report. Retrieved April 15, 2021.
- ^ "U.S. Census website". United States Census Bureau. Retrieved January 31, 2008.
External links[]

- Congressional districts of Kansas
- Wyandotte County, Kansas
- Johnson County, Kansas
- Douglas County, Kansas