Arizona's 1st congressional district
| Arizona's 1st congressional district | |||
|---|---|---|---|
 Arizona's 1st congressional district - since January 3, 2013 | |||
| Representative |
| ||
| Area | 58,608 sq mi (151,790 km2) | ||
| Distribution |
| ||
| Population (2019) | 782,088[1] | ||
| Median household income | $56,117[2] | ||
| Ethnicity |
| ||
| Cook PVI | R+2[3] | ||
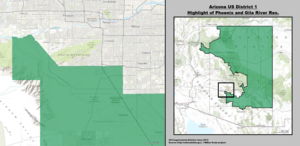
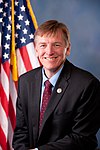
Arizona's 1st congressional district is a congressional district located in the U.S. state of Arizona. Geographically, it is the eleventh-largest congressional district in the country and includes much of the state outside the Phoenix and Tucson metropolitan areas. Since 2013, it includes the Navajo Nation, the Hopi reservation and the Gila River Indian Community, with 25% of the population being Native American. The district has more Native Americans than any other congressional district in the United States.[4] It is currently represented by Democrat Tom O'Halleran, who has served since 2017.
History[]
When Arizona was first divided into congressional districts as a result of the 1950 Census, the 1st district comprised all of Maricopa County, home to Phoenix, while the rest of the state was in the 2nd district. In a mid-decade redistricting resulting from Wesberry v. Sanders in 1967, the 1st was cut back to eastern Phoenix and most of what became the East Valley.
Over the years, the 1st's share of Phoenix was gradually reduced due to the area's explosive growth in the second half of the 20th century. However, it remained based in the East Valley until Arizona picked up two seats in the 2000 U.S. Census. The old 1st essentially became the 6th district, while a new 1st district was created to serve most of the state outside of Phoenix and Tucson.
After the 2012 redistricting, the Hopi reservation was drawn into the 1st district; it had previously been included within the 2nd district. Also included were some northern suburbs of Tucson that had been in the 8th, as well as a tiny section of Phoenix itself near the Gila River Indian Community. Meanwhile, heavily Republican Prescott, the old 1st's largest city, and much of surrounding Yavapai County were drawn into the new, heavily Republican 4th district. The district is now considered to be significantly more competitive for Democrats.
- External links
- Map of Congressional Districts first in effect for the 2002 election
- Tentative Final Congressional Map for the 2012 election
Areas covered[]
It covers the entirety of the following counties:
The district covers the majority of:
Small portions of the following counties are also covered:
Competitiveness[]
This large congressional district covers the mainly rural areas of northern and eastern Arizona. Democrats perform well in Flagstaff, Sedona, and the Navajo Nation among Native Americans, while Republicans are strongest in the more rural white areas. Elections are usually decided by conservative "Pinto Democrats" throughout the rural areas. Due to its vast size, it is extremely difficult to campaign in and has few unifying influences.
George W. Bush received 54% of the vote in this district in 2004. John McCain also carried the district in 2008 with 54% of the vote while Barack Obama received 44%. In the 2012 presidential election Mitt Romney (R) won with 50% of the vote, with Obama receiving 48%. Due to intense competition, this is generally considered a swing district. The redistricting has increased the number of historically Democratic voters.
During the Super Tuesday, February 5, 2008 Arizona Democratic Primary, the district was won by Hillary Clinton with 49% of the vote, while Barack Obama received 42% and John Edwards took 5%. In the Arizona Republican Primary, the 1st district was won by McCain with 46% while Mitt Romney received 35% and Mike Huckabee took in 12% of the vote in the district.
Tom O'Halleran (D) won the congressional seat in 2016. The district was considered very competitive for both parties in the 2016 primaries and general election.
Voting[]
| Election results from statewide races | ||
|---|---|---|
| Year | Office | Results |
| 1996 | President | Dole 46 – 45 - 7% |
| 2000 | President | Bush 51 – 44% |
| 2004 | President | Bush 54 – 46% |
| 2008 | President | McCain 54 – 44% |
| 2012 | President | Romney 50 – 48% |
| 2016 | President | Trump 48 – 47% |
| Senate | McCain 48.4 - 45.3% | |
| 2018 | Governor | Ducey 54.3 - 43.1% |
| Attorney General | Brnovich 49.9 - 49.9% | |
| Senate | Sinema 50.6 - 46.4% | |
| 2020 | President | Biden 50 – 48% |
| Senate (Spec.) | Kelly 52.1 - 47.9% | |
List of members representing the district[]
Arizona gained a second congressional seat after the 1940 Census. It used a general ticket to elect its representatives until the 1948 elections, when candidates ran from each of the districts.
| Member | Party | Term | Cong ress |
Electoral history | Geographical area[5][6][7] |
|---|---|---|---|---|---|
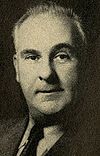 John R. Murdock |
Democratic | January 3, 1949 – January 3, 1953 |
81st 82nd |
Redistricted from the at-large district and re-elected in 1948. Re-elected in 1950. Lost re-election. |
1949–1967: Maricopa County: Metro Phoenix |
 John J. Rhodes Jr. |
Republican | January 3, 1953 – January 3, 1983 |
83rd 84th 85th 86th 87th 88th 89th 90th 91st 92nd 93rd 94th 95th 96th 97th |
Elected in 1952. Re-elected in 1954. Re-elected in 1956. Re-elected in 1958. Re-elected in 1960. Re-elected in 1962. Re-elected in 1964. Retired. | |
| 1967–1983: Part of Maricopa County: Metro Phoenix | |||||
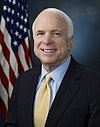
 John McCain |
Republican | January 3, 1983 – January 3, 1987 |
98th 99th |
Elected in 1982. Re-elected in 1984. Retired to run for U.S. senator. |
1983–2003: Part of Maricopa County: Parts of Metro Phoenix (East Valley) |
 John J. Rhodes III |
Republican | January 3, 1987 – January 3, 1993 |
100th 101st 102nd |
Elected in 1986. Re-elected in 1988. Re-elected in 1990. Lost re-election. | |
 Sam Coppersmith |
Democratic | January 3, 1993 – January 3, 1995 |
103rd | Elected in 1992. Retired to run for U.S. senator. | |
 Matt Salmon |
Republican | January 3, 1995 – January 3, 2001 |
104th 105th 106th |
Elected in 1994. Re-elected in 1996. Re-elected in 1998. Retired to run for Governor of Arizona. | |
 Jeff Flake |
Republican | January 3, 2001 – January 3, 2003 |
107th | Elected in 2000. Redistricted to the 6th district. | |
 Rick Renzi |
Republican | January 3, 2003 – January 3, 2009 |
108th 109th 110th |
Elected in 2002. Re-elected in 2004. Re-elected in 2006. Retired. |
2003–2013: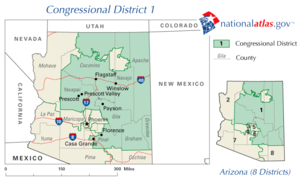 North and East Arizona: Apache County, Gila County, Graham County, Greenlee County, Yavapai County, and parts of Coconino County, Navajo County, and Pinal County |
 Ann Kirkpatrick |
Democratic | January 3, 2009 – January 3, 2011 |
111th | Elected in 2008. Lost re-election. | |
 Paul Gosar |
Republican | January 3, 2011 – January 3, 2013 |
112th | Elected in 2010. Redistricted to the 4th district. | |
Ann Kirkpatrick |
Democratic | January 3, 2013 – January 3, 2017 |
113th 114th |
Elected in 2012. Re-elected in 2014. Retired to run for U.S. senator. |
2013–present: Apache County, and parts of Coconino County, Gila County, Graham County, Greenlee County, Maricopa County (part Navajo County, Pima County, Pinal County |
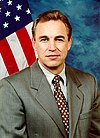
 Tom O'Halleran |
Democratic | January 3, 2017 – Present |
115th 116th 117th |
Elected in 2016. Re-elected in 2018. Re-elected in 2020. |
Recent election results[]
2002[]
| Party | Candidate | Votes | % | ±% | |
|---|---|---|---|---|---|
| Republican | Rick Renzi | 85,967 | 49.2% | ||
| Democratic | George Cordova | 79,730 | 45.6% | ||
| Libertarian | Edwin Porr | 8,990 | 5.2% | ||
| Majority | 6,237 | 3.6% | |||
| Total votes | 174,687 | 100.0 | |||
| Republican hold | |||||
2004[]
| Party | Candidate | Votes | % | ±% | |
|---|---|---|---|---|---|
| Republican | Rick Renzi (Incumbent) | 148,315 | 58.5% | ||
| Democratic | Paul Babbitt | 91,776 | 36.2% | ||
| Libertarian | John Crockett | 13,260 | 5.2% | ||
| Majority | 56,539 | 22.3% | |||
| Total votes | 253,351 | 100.0 | |||
| Republican hold | |||||
2006[]
| Party | Candidate | Votes | % | ±% | |
|---|---|---|---|---|---|
| Republican | Rick Renzi (Incumbent) | 105,646 | 53.2% | ||
| Democratic | Ellen Simon | 88,691 | 44.7% | ||
| Libertarian | David Schlosser | 4,205 | 2.1% | ||
| Majority | 16,955 | 8.5% | |||
| Total votes | 198,542 | 100.0 | |||
| Republican hold | |||||
2008[]
| Party | Candidate | Votes | % | ±% | |
|---|---|---|---|---|---|
| Democratic | Ann Kirkpatrick | 155,791 | 57.5% | ||
| Republican | Sydney Ann Hay | 109,924 | 40.5% | ||
| Independent | Brent Maupin | 4,124 | 1.5% | ||
| Libertarian | Thane Eichenauer | 1,316 | 0.5% | ||
| Majority | 45,867 | 16.9% | |||
| Total votes | 271,155 | 100.0 | |||
| Democratic gain from Republican | |||||
2010[]
| Party | Candidate | Votes | % | ±% | |
|---|---|---|---|---|---|
| Republican | Paul Gosar | 112,816 | 49.7% | ||
| Democratic | Ann Kirkpatrick (Incumbent) | 99,233 | 43.7% | ||
| Libertarian | Nicole Patti | 14,869 | 6.6% | ||
| Majority | 13,583 | 6.0% | |||
| Total votes | 226,918 | 100.0 | |||
| Republican gain from Democratic | |||||
2012[]
| Party | Candidate | Votes | % | ±% | |
|---|---|---|---|---|---|
| Democratic | Ann Kirkpatrick | 122,774 | 48.8% | ||
| Republican | Jonathan Paton | 113,594 | 45.2% | ||
| Libertarian | Kim Allen | 15,227 | 6.0% | ||
| Majority | 9,180 | 3.7% | |||
| Total votes | 251,595 | 100.0 | |||
| Democratic gain from Republican | |||||
2014[]
| Party | Candidate | Votes | % | ±% | |
|---|---|---|---|---|---|
| Democratic | Ann Kirkpatrick (Incumbent) | 97,391 | 52.6% | +3.8% | |
| Republican | Andy Tobin | 87,723 | 47.4% | +2.3% | |
| Majority | 9,568 | 5.2% | +1.6% | ||
| Total votes | 185,114 | 100.0 | |||
| Democratic hold | |||||
2016[]
| Party | Candidate | Votes | % | ±% | |
|---|---|---|---|---|---|
| Democratic | Tom O'Halleran | 142,219 | 50.7% | ||
| Republican | Paul Babeu | 121,745 | 43.3% | ||
| Green | Ray Parrish | 16,746 | 6.0% | ||
| Majority | 20,474 | 7.4% | |||
| Total votes | 280,710 | 100.0 | |||
| Democratic hold | |||||
2018[]
| Party | Candidate | Votes | % | ±% | |
|---|---|---|---|---|---|
| Democratic | Tom O'Halleran (Incumbent) | 143,240 | 53.8% | ||
| Republican | Wendy Rogers | 122,784 | 46.2% | ||
| Majority | 20,456 | 7.6% | |||
| Total votes | 266,024 | 100.0 | |||
| Democratic hold | |||||
2020[]
| Party | Candidate | Votes | % | ±% | |
|---|---|---|---|---|---|
| Democratic | Tom O'Halleran (Incumbent) | 188,469 | 51.6% | -2.2 | |
| Republican | Tiffany Shedd | 176,709 | 48.4% | +2.2 | |
| Total votes | 365,178 | 100.0 | |||
| Democratic hold | |||||
See also[]
References[]
- General
- ^ Center for New Media & Promotion (CNMP), US Census Bureau. "My Congressional District". www.census.gov.
- ^ Center for New Media & Promotion (CNMP), US Census Bureau. "My Congressional District". www.census.gov.
- ^ "Introducing the 2021 Cook Political Report Partisan Voter Index". The Cook Political Report. April 15, 2021. Retrieved April 15, 2021.
- ^ "Can Navajo Nation help rescue endangered Dem Congresswoman?". ABC News. October 8, 2010.
- ^ Martis, Kenneth C. (1982). The Historical Atlas of United States Congressional Districts, 1789–1983. New York: Macmillan Publishing.
- ^ Martis, Kenneth C. (1989). The Historical Atlas of Political Parties in the United States Congress, 1789–1989. New York: Macmillan Publishing.
- ^ Congressional Directory: Browse 105th Congress Archived February 17, 2011, at the Wayback Machine
- Specific
- Demographic data from census.gov
- 1998 election data from CNN.com
- 2000 election data from CNN.com
- 2002 Election Data from CBSNews
- 2004 Election Data from CNN.com
- Martis, Kenneth C. (1989). The Historical Atlas of Political Parties in the United States Congress. New York: Macmillan Publishing Company.
- Martis, Kenneth C. (1982). The Historical Atlas of United States Congressional Districts. New York: Macmillan Publishing Company.
- Congressional Biographical Directory of the United States 1774–present
External links[]
- Rose Institute of State and Local Government, "Arizona: 2010 Redistricting Changes: First District", Redistricting by State, Claremont, CA: Claremont McKenna College, archived from the original on September 15, 2020
Coordinates: 34°58′16″N 110°43′33″W / 34.97111°N 110.72583°W

- Congressional districts of Arizona
- Government of Apache County, Arizona
- Government of Coconino County, Arizona
- Government of Gila County, Arizona
- Government of Graham County, Arizona
- Government of Maricopa County, Arizona
- Government of Navajo County, Arizona
- Government of Pinal County, Arizona
- Casa Grande, Arizona
- Flagstaff, Arizona
- Gila River Indian Community
- Holbrook, Arizona
- Hopi Reservation
- Navajo Nation government
- Safford, Arizona
- Winslow, Arizona
- Constituencies established in 1949
- 1949 establishments in Arizona