Ohio's 9th congressional district
| Ohio's 9th congressional district | |||
|---|---|---|---|
 Ohio's 9th congressional district since January 3, 2013 | |||
| Representative |
| ||
| Distribution |
| ||
| Population (2016) | 706,201 | ||
| Median household income | $43,182[1] | ||
| Ethnicity |
| ||
| Cook PVI | D+9[2] | ||
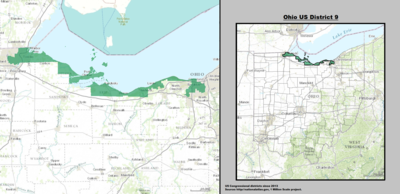
Ohio's 9th congressional district has been represented by Representative Marcy Kaptur (D) since 1983.
This district is in the northern part of the state, bordering Michigan and Ontario, Canada (via Lake Erie), and includes portions of Cuyahoga, Erie, Lorain, Lucas, and Ottawa counties. Due to redistricting by the Republican-controlled state legislature following the 2010 state elections, the 9th district absorbed part of western Cuyahoga County[3] pitting 10th district Democratic incumbent Dennis Kucinich against Kaptur in the 2012 Democratic primary.[4][5][6]
The redesigned 9th district has been called "The Snake by the Lake" due to its long and skinny appearance on the map[7] and one of the "Top 5 Ugliest Districts" due to gerrymandering. The two parts of the district are connected only via the Thomas Edison Memorial Bridge between Erie and Ottawa counties, as well as Crane Creek State Park. Some Ohio Democrats argued that when the beach floods, the reconfigured 9th is not contiguous.[8]
It was one of several districts challenged in a 2018 lawsuit seeking to overturn Ohio's congressional map as unconstitutional gerrymandering.[9] According to the lawsuit, the 9th "eats its way across the southern border of Lake Erie" while fragmenting Cleveland and Toledo.[10] In 2019, the Supreme Court refused to hear the case meaning that Ohio's congressional districts, including district 9, would not need to be redrawn.[11]
List of largest municipalities[]
All or part of ten cities (whose population is greater than 5,000) are in the district.
The largest municipalities[12] represented in this district include:
- Toledo, population 313,619
- Lorain, population 64,097
- Lakewood, population 52,131
- Sandusky, population 27,844
- Avon Lake, population 22,816
- Oregon, population 19,355
- Sylvania, population 18,971
- Maumee, population 14,286
Election results from presidential races[]
| Year | Office | Result |
|---|---|---|
| 2000 | President | Al Gore 55% - George W. Bush 41% |
| 2004 | President | John Kerry 58% - George W. Bush 42% |
| 2008 | President | Barack Obama 66.8% - John McCain 31.6% |
| 2012 | President | Barack Obama 67.6% - Mitt Romney 30.9% |
| 2016 | President | Hillary Clinton 58.7% - Donald Trump 36.5% |
| 2020 | President | Joe Biden 58.8% - Donald Trump 39.7% |
List of members representing the district[]
| Member | Party | Years | Cong ress |
Electoral history |
|---|---|---|---|---|
| District created | March 4, 1823 | |||
| Philemon Beecher | Adams-Clay Democratic-Republican |
March 4, 1823 – March 3, 1825 |
18th 19th 20th |
Elected in 1822. Re-elected in 1824. Re-elected in 1826. Lost re-election. |
| Anti-Jacksonian | March 4, 1825 – March 3, 1829 | |||
 William W. Irvin |
Jacksonian | March 4, 1829 – March 3, 1833 |
21st 22nd |
Elected in 1828. Re-elected in 1830. [data unknown/missing] |
 John Chaney |
Jacksonian | March 4, 1833 – March 3, 1837 |
23rd 24th 25th |
Elected in 1832. Re-elected in 1834. Re-elected in 1836. [data unknown/missing] |
| Democratic | March 4, 1837 – March 3, 1839 | |||
 William Medill |
Democratic | March 4, 1839 – March 3, 1843 |
26th 27th |
Elected in 1838. Re-elected in 1840. [data unknown/missing] |
 Elias Florence |
Whig | March 4, 1843 – March 3, 1845 |
28th | Elected in 1843. [data unknown/missing] |
| Augustus L. Perrill | Democratic | March 4, 1845 – March 3, 1847 |
29th | Elected in 1844. [data unknown/missing] |
| Thomas O. Edwards | Whig | March 4, 1847 – March 3, 1849 |
30th | Elected in 1846. [data unknown/missing] |
 Edson B. Olds |
Democratic | March 4, 1849 – March 3, 1853 |
31st 32nd |
Elected in 1848. Re-elected in 1850. Redistricted to the 12th district. |
| Frederick W. Green | Democratic | March 4, 1853 – March 3, 1855 |
33rd | Redistricted from the 6th district and re-elected in 1852. [data unknown/missing] |
 Cooper K. Watson |
Opposition | March 4, 1855 – March 3, 1857 |
34th | Elected in 1854. [data unknown/missing] |
| Lawrence W. Hall | Democratic | March 4, 1857 – March 3, 1859 |
35th | Elected in 1856. [data unknown/missing] |
 John Carey |
Republican | March 4, 1859 – March 3, 1861 |
36th | Elected in 1858. [data unknown/missing] |
 Warren P. Noble |
Democratic | March 4, 1861 – March 3, 1865 |
37th 38th |
Elected in 1860. Re-elected in 1862. [data unknown/missing] |
 Ralph P. Buckland |
Republican | March 4, 1865 – March 3, 1869 |
39th 40th |
Elected in 1864. Re-elected in 1866. [data unknown/missing] |
| Edward F. Dickinson | Democratic | March 4, 1869 – March 3, 1871 |
41st | Elected in 1868. [data unknown/missing] |
 Charles Foster |
Republican | March 4, 1871 – March 3, 1873 |
42nd | Elected in 1870. Redistricted to the 10th district. |
 James W. Robinson |
Republican | March 4, 1873 – March 3, 1875 |
43rd | Elected in 1872. [data unknown/missing] |
| Earley F. Poppleton | Democratic | March 4, 1875 – March 3, 1877 |
44th | Elected in 1874. [data unknown/missing] |
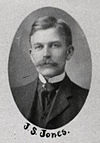 John S. Jones |
Republican | March 4, 1877 – March 3, 1879 |
45th | Elected in 1876. [data unknown/missing] |
 George L. Converse |
Democratic | March 4, 1879 – March 3, 1881 |
46th | Elected in 1878. Redistricted to the 12th district. |
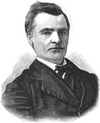
 James S. Robinson |
Republican | March 4, 1881 – January 12, 1885 |
47th 48th |
Elected in 1880. Re-elected in 1882. Resigned to become Ohio Secretary of State. |
| Vacant | January 12, 1885 – March 3, 1885 |
48th | ||
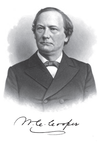 William C. Cooper |
Republican | March 4, 1885 – March 3, 1891 |
49th 50th 51st |
Elected in 1884. Re-elected in 1886. Re-elected in 1888. [data unknown/missing] |
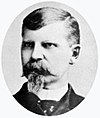 Joseph H. Outhwaite |
Democratic | March 4, 1891 – March 3, 1893 |
52nd | Redistricted from the 13th district and re-elected in 1890. Redistricted to the 12th district. |
 Byron F. Ritchie |
Democratic | March 4, 1893 – March 3, 1895 |
53rd | Elected in 1892. [data unknown/missing] |
 James H. Southard |
Republican | March 4, 1895 – March 3, 1907 |
54th 55th 56th 57th 58th 59th |
Elected in 1894. Re-elected in 1896. Re-elected in 1898. Re-elected in 1900. Re-elected in 1902. Re-elected in 1904. [data unknown/missing] |
 Isaac R. Sherwood |
Democratic | March 4, 1907 – March 3, 1921 |
60th 61st 62nd 63rd 64th 65th 66th |
Elected in 1906. Re-elected in 1908. Re-elected in 1910 Re-elected in 1912. Re-elected in 1914. Re-elected in 1916. Re-elected in 1918. Lost re-election. |
 William W. Chalmers |
Republican | March 4, 1921 – March 3, 1923 |
67th | Elected in 1920. Lost re-election. |
 Isaac R. Sherwood |
Democratic | March 4, 1923 – March 3, 1925 |
68th | Elected in 1922. Lost re-election. |
William W. Chalmers |
Republican | March 4, 1925 – March 3, 1931 |
69th 70th 71st |
Elected in 1924. Re-elected in 1926. Re-elected in 1928. Lost renomination. |
 Wilbur M. White |
Republican | March 4, 1931 – March 3, 1933 |
72nd | Elected in 1930. Lost re-election. |
 Warren J. Duffey |
Democratic | March 4, 1933 – July 7, 1936 |
73rd 74th |
Elected in 1932. Re-elected in 1934. Died. |
| Vacant | July 7, 1936 – January 3, 1937 |
74th | ||
| John F. Hunter | Democratic | January 3, 1937 – January 3, 1943 |
75th 76th 77th |
Elected in 1936. Re-elected in 1938. Re-elected in 1940. Lost re-election. |
 Homer A. Ramey |
Republican | January 3, 1943 – January 3, 1949 |
78th 79th 80th |
Elected in 1942. Re-elected in 1944. Re-elected in 1946. Lost re-election. |
| Thomas Henry Burke | Democratic | January 3, 1949 – January 3, 1951 |
81st | Elected in 1948. Lost renomination. |
 Frazier Reams |
Independent | January 3, 1951 – January 3, 1955 |
82nd 83rd |
Elected in 1950. Re-elected in 1952. Lost re-election. |
 Thomas L. Ashley |
Democratic | January 3, 1955 – January 3, 1981 |
84th 85th 86th 87th 88th 89th 90th 91st 92nd 93rd 94th 95th 96th |
Elected in 1954. Re-elected in 1956. Re-elected in 1958. Re-elected in 1960. Re-elected in 1962. Re-elected in 1964. Re-elected in 1966. Re-elected in 1968. Re-elected in 1970. Re-elected in 1972. Re-elected in 1974. Re-elected in 1976. Re-elected in 1978. Lost re-election. |
 Ed Weber |
Republican | January 3, 1981 – January 3, 1983 |
97th | Elected in 1980. Lost re-election. |
 Marcy Kaptur |
Democratic | January 3, 1983 – Present |
98th 99th 100th 101st 102nd 103rd 104th 105th 106th 107th 108th 109th 110th 111th 112th 113th 114th 115th 116th 117th |
Elected in 1982. Re-elected in 1984. Re-elected in 1986. Re-elected in 1988. Re-elected in 1990. Re-elected in 1992. Re-elected in 1994. Re-elected in 1996. Re-elected in 1998. Re-elected in 2000. Re-elected in 2002. Re-elected in 2004. Re-elected in 2006. Re-elected in 2008. Re-elected in 2010. Re-elected in 2012. Re-elected in 2014. Re-elected in 2016. Re-elected in 2018. Re-elected in 2020. |
Election results[]
The following chart shows historic election results. Bold type indicates victor. Italic type indicates incumbent.
| Year | Democratic | Republican | Other |
|---|---|---|---|
| 1920 | Isaac R. Sherwood: 38,292 | Karl E. Pauli: 47 | |
| 1922 | William W. Chalmers (Incumbent): 42,712 | (none) | |
| 1924 | Isaac R. Sherwood (Incumbent): 48,482 | Millard Price (Prohibition): 2,159 John Kocinski: 747 | |
| 1926 | : 23,947 | George F. Parrish (TRI): 1,110 Millard Price (Socialist): 1,018 | |
| 1928 | : 50,601 | Charles V. Stephenson (): 190 | |
| 1930 | : 36,375 | (none) | |
| 1932 | Wilbur M. White (Incumbent): 54,078 | Silas E. Hurin: 4,200 Clyde E. Kiker: 2,135 Karl Pauli (Socialist): 1,314 Eugene Stoll (Communist): 620 | |
| 1934 | : 35,732 | Kenneth Eggert (Communist): 684 Karl Pauli (Socialist): 510 | |
| 1936 | : 55,043 | Earl O. Lehman: 3,739 | |
| 1938 | Homer A. Ramey: 55,441 | (none) | |
| 1940 | Wilbur M. White: 71,927 | (none) | |
| 1942 | John F. Hunter (Incumbent): 44,027 | (none) | |
| 1944 | John F. Hunter: 77,693 | (none) | |
| 1946 | Michael DiSalle: 59,057 | (none) | |
| 1948 | Homer A. Ramey (Incumbent): 73,394 | (none) | |
| 1950 | Thomas H. Burke (Incumbent): 45,268 | Homer A. Ramey: 43,301 | |
| 1952 | Thomas H. Burke: 61,047 | : 46,989 | |
| 1954 | : 39,933 | Frazier Reams (Independent, Incumbent): 44,656 | |
| 1956 | : 81,562 | (none) | |
| 1958 | : 63,660 | (none) | |
| 1960 | Howard C. Cook: 82,433 | (none) | |
| 1962 | Martin A. Janis: 64,279 | (none) | |
| 1964 | : 64,401 | (none) | |
| 1966 | : 53,777 | (none) | |
| 1968 | Ben Marsh: 63,290 | (none) | |
| 1970 | : 33,947 | (none) | |
| 1972 | : 49,388 | (none) | |
| 1974 | Carty Finkbeiner: 57,892 | (none) | |
| 1976 | Carty Finkbeiner: 73,919 | Edward S. Emery: 1,533 Lynn Galonsky: 1,477 | |
| 1978 | : 34,326 | Edward S. Emery: 2,563 Michael James Lewinski: 4,530 | |
| 1980 | Thomas L. Ashley (Incumbent): 68,728 | Edward S. Emery: 4,357 Toby Elizabeth Emmerich: 2,411 | |
| 1982 | Ed Weber (Incumbent): 64,459 | David Muir (Libertarian): 1,217 Susan A. Skinner: 1,785 James J. Somers: 1,594 | |
| 1984 | : 93,210 | Other: 3,714 | |
| 1986 | : 30,643 | (none) | |
| 1988 | Al Hawkins: 36,183 | (none) | |
| 1990 | : 33,791 | (none) | |
| 1992 | : 53,011 | Edward Howard: 11,162 | |
| 1994 | : 38,665 | (none) | |
| 1996 | : 46,040 | Elizabeth A. Slotnick (Natural Law): 4,677 | |
| 1998 | Edward S. Emery: 30,312 | (none) | |
| 2000 | : 49,446 | Galen Fries (Libertarian): 4,239 Dennis Slotnick (Natural Law): 3,096 | |
| 2002 | Edward S. Emery: 46,481 | (none) | |
| 2004 | Larry A. Kaczala: 93,930 | (none) | |
| 2006 | : 55,119 | (none) | |
| 2008 | : 73,610 | (none) | |
| 2010 | Rich Iott: 83,423 | (none) | |
| 2012 | Joe Wurzelbacher: 68,666 | Sean Stipe (Libertarian): 11,725 | |
| 2014[13] | Richard May: 50,792 | Cory Hoffman, George A. Skalsky (Both Write-in): 0 | |
| 2016 | Donald P. Larson: 88,427 | George Skalsky (Write-in): 5 | |
| 2018 | Steve Kraus: 74,670 | McKenzie Levindofske (Write-in): 48 | |
| 2020 | Rob Weber: 111,385 | Other: 39 |
Gerrymandering[]
The current district lines were drawn by Republicans in 2011, following the redistricting based on the 2010 census. The boundaries of the 9th district have been cited as a signature example of the partisan gerrymandering of the Ohio redistricting.[9] In 2011, Roll Call criticized it as a product of gerrymandering, naming it one of the United States' "Top 5 Ugliest Districts".[8]
Historical district boundaries[]

See also[]
References[]
- ^ "My Congressional District".
- ^ "Introducing the 2021 Cook Political Report Partisan Voter Index". The Cook Political Report. April 15, 2021. Retrieved April 15, 2021.
- ^ "Ohio's 9th congressional district elections, 2012". Ballotpedia. Retrieved February 12, 2012.
- ^ Alex M. Parker (February 9, 2012). "Friendly Fire Coming in House Re-Elections?". U.S. News and World Report.
- ^ Andrea Billups (February 6, 2012). "Kaptur, Kucinich face off in Ohio". The Washington Times.
- ^ Kevin Milliken (January 16, 2012). "Kaptur, Kucinich square off for one congressional seat". La Prensa.
- ^ "Kill the Snake by the Lake", Toledo Blade, Jan. 16, 2018. Retrieved August 7, 2018.
- ^ a b Shira Toeplitz (November 10, 2011). "Top 5 Ugliest Districts: Partisan Gerrymandering 101". Roll Call.
- ^ a b Todd Ruger, "Voters Challenge Ohio Congressional Map as Partisan Gerrymander", Roll Call, May 23, 2018. Retrieved 7 August 2018.
- ^ Ohio A. Philip Randolph Institute et al., v. John Kasich, UNITED STATES DISTRICT COURT FOR THE SOUTHERN DISTRICT OF OHIO, filed 05/23/2018. Retrieved 7 August 2018.
- ^ "U.S. Supreme Court tosses challenge to Republican-drawn Ohio congressional maps". Reuters. October 7, 2019. Retrieved November 28, 2021.
- ^ "U.S. Census Bureau, Census 2000" (PDF). Archived from the original (PDF) on May 6, 2012. Retrieved December 3, 2009.
- ^ http://www.sos.state.oh.us/SOS/elections/Research/electResultsMain/2014Results.aspx
- Martis, Kenneth C. (1989). The Historical Atlas of Political Parties in the United States Congress. New York: Macmillan Publishing Company.
- Martis, Kenneth C. (1982). The Historical Atlas of United States Congressional Districts. New York: Macmillan Publishing Company.
- Congressional Biographical Directory of the United States 1774–present
- Congressional districts of Ohio
- Constituencies established in 1823
- 1823 establishments in Ohio