Ohio's 5th congressional district
| Ohio's 5th congressional district | |||
|---|---|---|---|
 Ohio's 5th congressional district - since January 3, 2013. | |||
| Representative |
| ||
| Distribution |
| ||
| Population (2019) | 721,212[2] | ||
| Median household income | $63,702[3] | ||
| Ethnicity |
| ||
| Cook PVI | R+15[4] | ||
Ohio's 5th congressional district is in northwestern and north central Ohio and borders Michigan and Indiana. The district is currently represented by Republican Bob Latta. The district borders have changed somewhat from the previous redistrict as some of the easternmost counties were redistricted to other districts.
From 2003 to 2013 all of Crawford, Defiance, Fulton, Henry, Huron, Paulding, Putnam, Sandusky, Seneca, Van Wert, Williams, and Wood Counties were included in this district. Portions of Ashland, Lucas, Mercer, and Wyandot Counties were also a part of the 5th District.
Election results from presidential races[]
| Year | President | Result |
|---|---|---|
| 2000 | President | George W. Bush 59% - Al Gore 37% |
| 2004 | President | George W. Bush 61% - John Kerry 39% |
| 2008 | President | John McCain 52% - Barack Obama 46% |
| 2012 | President | Mitt Romney 53.9% - Barack Obama 44.1% |
| 2016 | President | Donald Trump 59.7% - Hillary Clinton 34.6% |
| 2020 | President | Donald Trump 61.1% - Joe Biden 36.7% |
List of Largest Municipalities[]
All or part of twenty-one cities (whose population is greater than 5,000) are in the district.
The largest municipalities[5] represented in this district include:
- Toledo(*), population 272,779
- Findlay, population 41,202
- Bowling Green, population 29,636
- Perrysburg, population 16,945
- Fremont, population 16,734
- Defiance, population 17,400
- Norwalk, population 16,238
- Fostoria(*), population 13,931
- Bucyrus, population 13,224
- Galion(*), population 11,341
- Van Wert, population 10,690
- Napoleon, population 9,318
- Bryan, population 8,333
- Wauseon, population 7,091
- Upper Sandusky(*), population 6,533
- Rossford, population 6,406
- Northwood, population 5,471
(*) Denotes that areas of the city are located in another Congressional District.
List of members representing the district[]
| Member | Party | Years | Cong ress |
Electoral history |
|---|---|---|---|---|
| District created March 4, 1813 | ||||
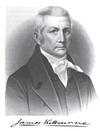 James Kilbourne |
Democratic-Republican | March 4, 1813 – March 3, 1817 |
13th 14th |
Elected in 1812. Re-elected in 1814. Retired. |
| Philemon Beecher | Democratic-Republican | March 4, 1817 – March 3, 1821 |
15th 16th |
Elected in 1816. Re-elected in 1818. Lost re-election. |
 Joseph Vance |
Democratic-Republican | March 4, 1821 – March 3, 1823 |
17th | Elected in 1820. Redistricted to the 4th district. |
 John Wilson Campbell |
Democratic-Republican | March 4, 1823 – March 3, 1825 |
18th 19th |
Redistricted from the 2nd district and re-elected in 1822. Re-elected in 1824. Retired. |
| Anti-Jacksonian | March 4, 1825 – March 3, 1827 | |||
 William Russell |
Jacksonian | March 4, 1827 – March 3, 1833 |
20th 21st 22nd |
Elected in 1826. Re-elected in 1828. Re-elected in 1830. Lost re-election. |
 Thomas L. Hamer |
Jacksonian | March 4, 1833 – March 3, 1837 |
23rd 24th 25th |
Elected in 1832. Re-elected in 1834. Re-elected in 1836. [data unknown/missing] |
| Democratic | March 4, 1837 – March 3, 1839 | |||
| William Doan | Democratic | March 4, 1839 – March 3, 1843 |
26th 27th |
Elected in 1838. Re-elected in 1840. Retired. |
 Emery D. Potter |
Democratic | March 4, 1843 – March 3, 1845 |
28th | Elected in 1843. Retired. |
| William Sawyer | Democratic | March 4, 1845 – March 3, 1849 |
29th 30th |
Elected in 1844. Re-elected in 1846. Lost re-election. |
Emery D. Potter |
Democratic | March 4, 1849 – March 3, 1851 |
31st | Elected in 1848. [data unknown/missing] |
 Alfred Edgerton |
Democratic | March 4, 1851 – March 3, 1855 |
32nd 33rd |
Elected in 1850. Re-elected in 1852. [data unknown/missing] |
 Richard Mott |
Opposition | March 4, 1855 – March 3, 1857 |
34th 35th |
Elected in 1854. Re-elected in 1856. [data unknown/missing] |
| Republican | March 4, 1857 – March 3, 1859 | |||
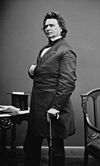 James Mitchell Ashley |
Republican | March 4, 1859 – March 3, 1863 |
36th 37th |
Elected in 1858. Re-elected in 1860. Redistricted to the 10th district. |
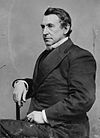
 Francis Celeste Le Blond |
Democratic | March 4, 1863 – March 3, 1867 |
38th 39th |
Elected in 1862. Re-elected in 1864. [data unknown/missing] |
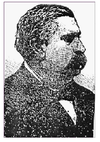
 William Mungen |
Democratic | March 4, 1867 – March 3, 1871 |
40th 41st |
Elected in 1866. Re-elected in 1868. [data unknown/missing] |
 Charles Nelson Lamison |
Democratic | March 4, 1871 – March 3, 1875 |
42nd 43rd |
Elected in 1870. Re-elected in 1872. [data unknown/missing] |
 Americus Vespucius Rice |
Democratic | March 4, 1875 – March 3, 1879 |
44th 45th |
Elected in 1874. Re-elected in 1876. [data unknown/missing] |
 Benjamin Le Fevre |
Democratic | March 4, 1879 – March 3, 1883 |
46th 47th |
Elected in 1878. Re-elected in 1880. Redistricted to the 4th district. |
 George E. Seney |
Democratic | March 4, 1883 – March 3, 1885 |
48th | Elected in 1882. Redistricted to the 7th district. |
Benjamin Le Fevre |
Democratic | March 4, 1885 – March 3, 1887 |
49th | Redistricted from the 4th district and re-elected in 1884. [data unknown/missing] |
 George E. Seney |
Democratic | March 4, 1887 – March 3, 1891 |
50th 51st |
Redistricted from the 7th district and re-elected in 1886. Re-elected in 1888. [data unknown/missing] |
 Fernando C. Layton |
Democratic | March 4, 1891 – March 3, 1893 |
52nd | Elected in 1890. Redistricted to the 4th district. |
 Dennis D. Donovan |
Democratic | March 4, 1893 – March 3, 1895 |
53rd | Redistricted from the 6th district and re-elected in 1892. [data unknown/missing] |
| Francis B. De Witt | Republican | March 4, 1895 – March 3, 1897 |
54th | Elected in 1894. [data unknown/missing] |
 David Meekison |
Democratic | March 4, 1897 – March 3, 1901 |
55th 56th |
Elected in 1896. Re-elected in 1898. Retired. |
 John S. Snook |
Democratic | March 4, 1901 – March 3, 1905 |
57th 58th |
Elected in 1900. Re-elected in 1902. Retired. |
 William W. Campbell |
Republican | March 4, 1905 – March 3, 1907 |
59th | Elected in 1904. Lost re-election |
 Timothy T. Ansberry |
Democratic | March 4, 1907 – January 9, 1915 |
60th 61st 62nd 63rd |
Elected in 1906. Re-elected in 1908. Re-elected in 1910. Re-elected in 1912. Resigned when appointed to the Ohio Court of Appeals |
| Vacant | January 9, 1915 – March 3, 1915 |
63rd | ||
| Nelson E. Matthews | Republican | March 4, 1915 – March 3, 1917 |
64th | Elected in 1914. [data unknown/missing] |
John S. Snook |
Democratic | March 4, 1917 – March 3, 1919 |
65th | Elected in 1916. Retired. |
 Charles J. Thompson |
Republican | March 4, 1919 – March 3, 1931 |
66th 67th 68th 69th 70th 71st |
Elected in 1918. Re-elected in 1920. Re-elected in 1922. Re-elected in 1924. Re-elected in 1926. Re-elected in 1928. [data unknown/missing] |
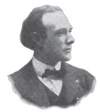
 Frank C. Kniffin |
Democratic | March 4, 1931 – January 3, 1939 |
72nd 73rd 74th 75th |
Elected in 1930. Re-elected in 1932. Re-elected in 1934. Re-elected in 1936. Lost re-election. |
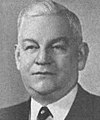 Cliff Clevenger |
Republican | January 3, 1939 – January 3, 1959 |
76th 77th 78th 79th 80th 81st 82nd 83rd 84th 85th |
Elected in 1938. Re-elected in 1940. Re-elected in 1942. Re-elected in 1944. Re-elected in 1946. Re-elected in 1948. Re-elected in 1950. Re-elected in 1952. Re-elected in 1954. Re-elected in 1956. Retired. |
 Del Latta |
Republican | January 3, 1959 – January 3, 1989 |
86th 87th 88th 89th 90th 91st 92nd 93rd 94th 95th 96th 97th 98th 99th 100th |
Elected in 1958. Re-elected in 1960. Re-elected in 1962. Re-elected in 1964. Re-elected in 1966. Re-elected in 1968. Re-elected in 1970. Re-elected in 1972. Re-elected in 1974. Re-elected in 1976. Re-elected in 1978. Re-elected in 1980. Re-elected in 1982. Re-elected in 1984. Re-elected in 1986. Retired. |
 Paul Gillmor |
Republican | January 3, 1989 – September 5, 2007 |
101st 102nd 103rd 104th 105th 106th 107th 108th 109th 110th |
Elected in 1988. Re-elected in 1990. Re-elected in 1992. Re-elected in 1994. Re-elected in 1996. Re-elected in 1998. Re-elected in 2000. Re-elected in 2002. Re-elected in 2004. Re-elected in 2006. Died. |
| Vacant | September 5, 2007 – December 11, 2007 |
110th | ||
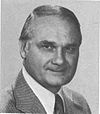
 Bob Latta |
Republican | December 11, 2007 – Present |
110th 111th 112th 113th 114th 115th 116th 117th |
Elected to finish Gillmor's term. Re-elected in 2008. Re-elected in 2010. Re-elected in 2012. Re-elected in 2014. Re-elected in 2016. Re-elected in 2018. Re-elected in 2020. |
Election results[]
The following chart shows historic election results. Bold type indicates victor. Italic type indicates incumbent.
| Year | Democratic | Republican | Other |
|---|---|---|---|
| 1812 | District created following the 1810 Census. | ||
| … | |||
| 1920 | : 25,395 | Charles J. Thompson: 40,381 | |
| 1922 | Frank C. Kniffin: 28,067 | Charles J. Thompson: 31,700 | |
| 1924 | Frank C. Kniffin: 29,245 | Charles J. Thompson: 31,045 | |
| 1926 | Frank C. Kniffin: 23,022 | Charles J. Thompson: 23,638 | |
| 1928 | Frank C. Kniffin: 31,385 | Charles J. Thompson: 36,096 | |
| 1930 | Frank C. Kniffin: 29,117 | Charles J. Thompson: 27,497 | |
| 1932 | Frank C. Kniffin: 44,433 | : 29,605 | |
| 1934 | Frank C. Kniffin: 34,249 | : 27,423 | |
| 1936 | Frank C. Kniffin: 41,693 | : 33,212 | Fred L. Hay: 3,663 |
| 1938 | Frank C. Kniffin: 28,109 | Cliff Clevenger: 37,027 | |
| 1940 | : 31,063 | Cliff Clevenger: 48,040 | |
| 1942 | : 17,514 | Cliff Clevenger: 30,667 | |
| 1944 | : 22,740 | Cliff Clevenger: 48,490 | |
| 1946 | : 20,163 | Cliff Clevenger: 30,623 | |
| 1948 | : 32,076 | Cliff Clevenger: 34,950 | |
| 1950 | : 26,689 | Cliff Clevenger: 36,096 | |
| 1952 | : 42,104 | Cliff Clevenger: 72,168 | |
| 1954 | : 33,483 | Cliff Clevenger: 49,265 | |
| 1956 | : 42,181 | Cliff Clevenger: 69,774 | |
| 1958 | : 44,971 | Delbert L. Latta: 52,612 | |
| 1960 | : 41,375 | Delbert L. Latta: 85,175 | |
| 1962 | : 29,114 | Delbert L. Latta: 69,272 | |
| 1964 | : 41,621 | Delbert L. Latta: 80,394 | |
| 1966 | : 26,503 | Delbert L. Latta: 80,906 | |
| 1968 | : 45,884 | Delbert L. Latta: 113,381 | |
| 1970 | : 37,545 | Delbert L. Latta: 92,577 | |
| 1972 | : 49,465 | Delbert L. Latta: 132,032 | |
| 1974 | : 53,391 | Delbert L. Latta: 89,161 | |
| 1976 | : 60,304 | Delbert L. Latta: 124,910 | |
| 1978 | James R. Sherck: 51,071 | Delbert L. Latta: 85,547 | |
| 1980 | James R. Sherck: 57,704 | Delbert L. Latta: 137,003 | |
| 1982 | James R. Sherck: 70,120 | Delbert L. Latta: 86,450 | |
| 1984 | James R. Sherck: 78,809 | Delbert L. Latta: 132,582 | |
| 1986 | : 54,864 | Delbert L. Latta: 102,016 | |
| 1988 | : 80,472 | Paul E. Gillmor: 128,838 | |
| 1990 | : 41,693 | Paul E. Gillmor: 113,615 | John E. Jackson: 10,612 |
| 1992 | Paul E. Gillmor: 187,860 | ||
| 1994 | : 49,335 | Paul E. Gillmor: 135,879 | |
| 1996 | : 81,170 | Paul E. Gillmor: 145,892 | David J. Schaffer (N): 11,461 |
| 1998 | : 61,926 | Paul E. Gillmor: 123,979 | |
| 2000 | : 62,138 | Paul E. Gillmor: 169,857 | John F. Green (L): 5,464 David J. Schaffer (N): 5,881 |
| 2002 | Roger Anderson: 51,872 | Paul E. Gillmor: 126,286 | John F. Green: 10,096 |
| 2004 | Robin Weirauch: 95,481 | Paul E. Gillmor: 194,559 | |
| 2006 | Robin Weirauch: 95,955 | Paul E. Gillmor : 126,898 | |
| 2007* | Robin Weirauch: 32,246 | Robert E. Latta: 41,740 | |
| 2008 | : 105,840 | Robert E. Latta: 188,905 | [6] |
| 2012[7] | : 137,806 | Robert E. Latta: 201,514 | Eric Eberly (L) : 12,558 |
| 2014[8] | Robert Fry: 57,328 | Robert E. Latta: 132,448 | Eric Eberly (L) : 9,142 |
| 2016 | James L. Neu Jr.: 100,392 | Robert E. Latta: 244,599 | |
| 2018 | J. Michael Galbraith: 99,655 | Robert E. Latta: 176,569 | Don Kissick (L): 7,393 |
| 2020 | Nick Rubando: 120,962 | Robert E. Latta: 257,019 | |
2010[]
| Party | Candidate | Votes | % | |
|---|---|---|---|---|
| Republican | Bob Latta* | 140,703 | 67.82 | |
| Democratic | Caleb Finkenbiner | 54,919 | 26.47 | |
| Libertarian | Brian Smith | 11,831 | 5.70 | |
| Total votes | 207,453 | 100.00 | ||
| Turnout | ||||
| Republican hold | ||||
2012[]
| Party | Candidate | Votes | % | |
|---|---|---|---|---|
| Republican | Bob Latta (incumbent) | 201,514 | 57.3 | |
| Democratic | Angela Zimmann | 137,806 | 39.2 | |
| Libertarian | Eric Eberly | 12,558 | 3.5 | |
| Total votes | 351,878 | 100.0 | ||
| Republican hold | ||||
2014[]
| Party | Candidate | Votes | % | |
|---|---|---|---|---|
| Republican | Bob Latta (incumbent) | 134,449 | 66.5 | |
| Democratic | Robert Fry | 58,507 | 28.9 | |
| Libertarian | Eric Eberly | 9,344 | 4.6 | |
| Total votes | 202,300 | 100.0 | ||
| Republican hold | ||||
2016[]
| Party | Candidate | Votes | % | |
|---|---|---|---|---|
| Republican | Bob Latta (incumbent) | 244,599 | 70.9 | |
| Democratic | James L. Neu Jr. | 100,392 | 29.1 | |
| Total votes | 344,991 | 100.0 | ||
| Republican hold | ||||
2018[]
| Party | Candidate | Votes | % | ||
|---|---|---|---|---|---|
| Republican | Bob Latta (incumbent) | 176,569 | 62.3 | ||
| Democratic | J. Michael Galbraith | 99,655 | 35.1 | ||
| Libertarian | Don Kissick | 7,393 | 2.6 | ||
| Total votes | 283,617 | 100.0 | |||
| Republican hold | |||||
2020[]
| Party | Candidate | Votes | % | |
|---|---|---|---|---|
| Republican | Bob Latta (incumbent) | 257,019 | 68.0 | |
| Democratic | Nick Rubando | 120,962 | 32.0 | |
| Total votes | 377,981 | 100.0 | ||
| Republican hold | ||||
Historical district boundaries[]

See also[]
- Ohio's congressional districts
- List of United States congressional districts
- Ohio's 5th congressional district special election, 2007
References[]
- ^ Geography, US Census Bureau. "Congressional Districts Relationship Files (state-based)". www.census.gov. Retrieved April 9, 2018.
- ^ Bureau, Center for New Media & Promotion (CNMP), US Census. "My Congressional District". www.census.gov. Retrieved April 9, 2018.
- ^ https://www.census.gov/mycd/?st=39&cd=05
- ^ "Introducing the 2021 Cook Political Report Partisan Voter Index". The Cook Political Report. April 15, 2021. Retrieved April 15, 2021.
- ^ "U.S. Census Bureau, Census 2000" (PDF). census.gov. Archived from the original (PDF) on May 6, 2012. Retrieved April 9, 2018.
- ^ Federal Elections 2008. Federal Elections Commission, Washington DC, July 2009
- ^ "2012 Election Results". Ohio Secretary of State.
- ^ "2014 Election Results". Ohio Secretary of State.
- Martis, Kenneth C. (1989). The Historical Atlas of Political Parties in the United States Congress. New York: Macmillan Publishing Company.
- Martis, Kenneth C. (1982). The Historical Atlas of United States Congressional Districts. New York: Macmillan Publishing Company.
- Congressional Biographical Directory of the United States 1774–present
| Authority control |
|
|---|
Coordinates: 41°09′21″N 84°02′41″W / 41.15583°N 84.04472°W

- Congressional districts of Ohio
- Constituencies established in 1813
- 1813 establishments in Ohio