Peñablanca
Peñablanca | |
|---|---|
| Municipality of Peñablanca | |
 | |
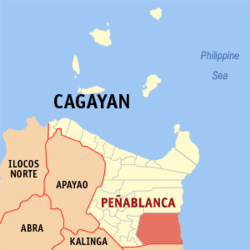 Map of Cagayan with Peñablanca highlighted | |
OpenStreetMap  | |
 Peñablanca Location within the Philippines | |
| Coordinates: 17°38′N 121°47′E / 17.63°N 121.78°ECoordinates: 17°38′N 121°47′E / 17.63°N 121.78°E | |
| Country | Philippines |
| Region | Cagayan Valley |
| Province | Cagayan |
| District | 3rd district |
| Barangays | 24 (see Barangays) |
| Government | |
| • Type | Sangguniang Bayan |
| • Mayor | Washington M. Taguinod |
| • Vice Mayor | Marilyn J. Taguinod |
| • Representative | Joseph L. Lara |
| • Electorate | 27,104 voters (2019) |
| Area | |
| • Total | 1,193.20 km2 (460.70 sq mi) |
| Elevation | 58 m (190 ft) |
| Highest elevation | 301 m (988 ft) |
| Lowest elevation | 14 m (46 ft) |
| Population (2020 census) [3] | |
| • Total | 50,300 |
| • Density | 42/km2 (110/sq mi) |
| • Households | 10,681 |
| Economy | |
| • Income class | 1st municipal income class |
| • Poverty incidence | 12.62% (2015)[4] |
| • Revenue | ₱357,338,808.75 (2020) |
| • Assets | ₱539,460,132.58 (2020) |
| • Expenditure | ₱299,898,066.03 (2020) |
| • Liabilities | ₱15,995,732.48 (2020) |
| Service provider | |
| • Electricity | Cagayan 1 Electric Cooperative (CAGELCO 1) |
| Time zone | UTC+8 (PST) |
| ZIP code | 3502 |
| PSGC | |
| IDD : area code | +63 (0)78 |
| Native languages | Ibanag Ilocano Itawis Atta language Tagalog |
| Website | www |

Peñablanca, officially the Municipality of Peñablanca (Ibanag: Ili nat Peñablanca; Ilocano: Ili ti Peñablanca; Tagalog: Bayan ng Peñablanca), is a 1st class municipality in the province of Cagayan, Philippines. According to the 2020 census, it has a population of 50,300 people. [3]
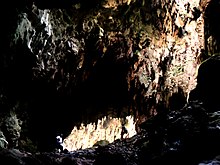
Situated east of the provincial capital Tuguegarao, the municipality is home to the Peñablanca Protected Landscape and Seascape which contains the Callao Cave (part of the Callao Limestone Formation Paleolithic Archaeological Site), one of the province's well-known landmarks and tourist spots.
It is also home to the charcoal-drawn Peñablanca petrographs. Both the Peñablanca petrographs and the Callao Limestone Formation are included as tentative sites of the Philippines for future inclusion in the UNESCO World Heritage List.[5] The Callao Limestone Formation has at least 93 archaeological sites that yielded stone tools of Paleolithic industry and bones and shells of animals still living in the vicinity.
Barangays[]
Peñablanca is divided into 24 barangays.
- Aggugaddan
- Alimanao
- Baliuag
- Bical
- Bugatay
- Buyun
- Cabasan
- Cabbo
- Callao
- Camasi
- Centro (Poblacion)
- Dodan
- Lapi
- Malibabag
- Mangga
- Minanga
- Nabbabalayan
- Nanguilattan
- Nannarian
- Parabba
- Patagueleg
- Quibal
- San Roque (Litto)
- Sisim
Climate[]
| Climate data for Peñablanca, Cagayan | |||||||||||||
|---|---|---|---|---|---|---|---|---|---|---|---|---|---|
| Month | Jan | Feb | Mar | Apr | May | Jun | Jul | Aug | Sep | Oct | Nov | Dec | Year |
| Average high °C (°F) | 25 (77) |
26 (79) |
28 (82) |
31 (88) |
31 (88) |
31 (88) |
30 (86) |
30 (86) |
30 (86) |
28 (82) |
27 (81) |
25 (77) |
29 (83) |
| Average low °C (°F) | 21 (70) |
21 (70) |
22 (72) |
23 (73) |
24 (75) |
24 (75) |
24 (75) |
24 (75) |
24 (75) |
23 (73) |
23 (73) |
22 (72) |
23 (73) |
| Average precipitation mm (inches) | 155 (6.1) |
113 (4.4) |
89 (3.5) |
58 (2.3) |
127 (5.0) |
131 (5.2) |
154 (6.1) |
184 (7.2) |
151 (5.9) |
247 (9.7) |
221 (8.7) |
292 (11.5) |
1,922 (75.6) |
| Average rainy days | 19.6 | 14.8 | 13.4 | 12.0 | 19.4 | 19.8 | 23.0 | 25.0 | 23.0 | 19.4 | 19.1 | 21.6 | 230.1 |
| Source: Meteoblue [6] | |||||||||||||
Demographics[]
| Year | Pop. | ±% p.a. |
|---|---|---|
| 1903 | 4,969 | — |
| 1918 | 6,478 | +1.78% |
| 1939 | 8,864 | +1.50% |
| 1948 | 8,799 | −0.08% |
| 1960 | 13,119 | +3.38% |
| 1970 | 18,218 | +3.33% |
| 1975 | 21,638 | +3.51% |
| 1980 | 24,888 | +2.84% |
| 1990 | 30,527 | +2.06% |
| 1995 | 33,190 | +1.58% |
| 2000 | 37,872 | +2.87% |
| 2007 | 40,336 | +0.87% |
| 2010 | 42,736 | +2.13% |
| 2015 | 48,584 | +2.47% |
| 2020 | 50,300 | +0.68% |
| Source: Philippine Statistics Authority [7] [8] [9][10] | ||
In the 2020 census, the population of Peñablanca, Cagayan, was 50,300 people, [3] with a density of 42 inhabitants per square kilometre or 110 inhabitants per square mile.
Economy[]
| Poverty Incidence of Peñablanca | |
| Source: Philippine Statistics Authority[11][12][13][14][15][16] | |
References[]
- ^ Municipality of Peñablanca | (DILG)
- ^ "2015 Census of Population, Report No. 3 – Population, Land Area, and Population Density" (PDF). Philippine Statistics Authority. Quezon City, Philippines. August 2016. ISSN 0117-1453. Archived (PDF) from the original on May 25, 2021. Retrieved July 16, 2021.
- ^ a b c Census of Population (2020). "Region II (Cagayan Valley)". Total Population by Province, City, Municipality and Barangay. PSA. Retrieved 8 July 2021.
- ^ https://psa.gov.ph/sites/default/files/City%20and%20Municipal-level%20Small%20Area%20Poverty%20Estimates_%202009%2C%202012%20and%202015_0.xlsx; publication date: 10 July 2019; publisher: Philippine Statistics Authority.
- ^ "Petroglyphs and Petrographs of the Philippines". whc.unesco.org. UNESCO World Heritage Centre. Retrieved 23 March 2018.
- ^ "Peñablanca, Cagayan: Average Temperatures and Rainfall". Meteoblue. Retrieved 15 December 2018.
- ^ Census of Population (2015). "Region II (Cagayan Valley)". Total Population by Province, City, Municipality and Barangay. PSA. Retrieved 20 June 2016.
- ^ Census of Population and Housing (2010). "Region II (Cagayan Valley)". Total Population by Province, City, Municipality and Barangay. NSO. Retrieved 29 June 2016.
- ^ Censuses of Population (1903–2007). "Region II (Cagayan Valley)". Table 1. Population Enumerated in Various Censuses by Province/Highly Urbanized City: 1903 to 2007. NSO.
- ^ "Province of Cagayan". Municipality Population Data. Local Water Utilities Administration Research Division. Retrieved 17 December 2016.
- ^ "Poverty incidence (PI):". Philippine Statistics Authority. Retrieved 28 December 2020.
- ^ https://psa.gov.ph/sites/default/files/NSCB_LocalPovertyPhilippines_0.pdf; publication date: 29 November 2005; publisher: Philippine Statistics Authority.
- ^ https://psa.gov.ph/sites/default/files/2003%20SAE%20of%20poverty%20%28Full%20Report%29_1.pdf; publication date: 23 March 2009; publisher: Philippine Statistics Authority.
- ^ https://psa.gov.ph/sites/default/files/2006%20and%202009%20City%20and%20Municipal%20Level%20Poverty%20Estimates_0_1.pdf; publication date: 3 August 2012; publisher: Philippine Statistics Authority.
- ^ https://psa.gov.ph/sites/default/files/2012%20Municipal%20and%20City%20Level%20Poverty%20Estima7tes%20Publication%20%281%29.pdf; publication date: 31 May 2016; publisher: Philippine Statistics Authority.
- ^ https://psa.gov.ph/sites/default/files/City%20and%20Municipal-level%20Small%20Area%20Poverty%20Estimates_%202009%2C%202012%20and%202015_0.xlsx; publication date: 10 July 2019; publisher: Philippine Statistics Authority.
External links[]
| Wikimedia Commons has media related to Peñablanca, Cagayan. |
- Peñablanca Profile at PhilAtlas.com
- Philippine Standard Geographic Code
- Philippine Census Information
Places adjacent to Peñablanca | ||||||||||||||||
|---|---|---|---|---|---|---|---|---|---|---|---|---|---|---|---|---|
| ||||||||||||||||
Tuguegarao (capital) | |
| Municipalities | |
| Component city | |
| Barangays | |
This article about a location in Cagayan Valley region is a stub. You can help Wikipedia by . |
- Municipalities of Cagayan
- Philippines geography stubs