Pingyuan County, Guangdong
This article does not cite any sources. (October 2008) |
Pingyuan
平远县 Pingyun; Pingyün; Pingyüan | |
|---|---|
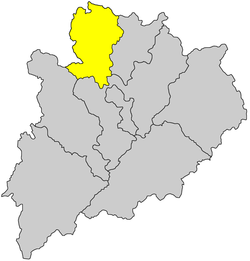 Pingyuan County in Meizhou | |
 Meizhou in Guangdong | |
| Country | People's Republic of China |
| Province | Guangdong |
| Prefecture-level city | Meizhou |
| Area | |
| • Total | 1,381 km2 (533 sq mi) |
| Time zone | UTC+8 (China standard) |
| Website | www |
Pingyuan County (postal: Pingyun; simplified Chinese: 平远县; traditional Chinese: 平遠縣; pinyin: Píngyuǎn Xiàn, Hakka: Phin-yen) is a county in the northeast of Guangdong Province, People's Republic of China. It is under the administration of Meizhou City.
Geography[]
Pingyuan County is located in the northeast of Guangdong province, on the border between Guangdong, Jiangxi and Fujian province. It was founded in the Ming Dynasty Jiajing in the 42nd year (year 1863). Because it is located between Wuping (in Fujian) and Anyuan County (in Jiangxi), it was named ‘Pingyuan’.
Pingyuan County is under the jurisdiction of Mei County which is known as the home of standard Hakka. The total area of Pingyuan is 1381 square kilometers. Now it has 12 towns with the population of 250 thousand.
Climate[]
| showClimate data for Pingyuan (1981−2010) |
|---|
External links[]
Coordinates: 24°39′38″N 115°54′36″E / 24.66056°N 115.91000°E

| show Authority control |
|---|
- County-level divisions of Guangdong
- Meizhou