Scarborough and Whitby (UK Parliament constituency)

From Wikipedia, the free encyclopedia

Scarborough and Whitby
County constituency
for the House of Commons
Outline map
Boundary of Scarborough and Whitby in North Yorkshire
Outline map
Location of North Yorkshire within England
CountyNorth Yorkshire
Electorate72,191 (December 2019)[1]
Major settlementsScarborough and Whitby
Current constituency
Created1997
Member of ParliamentRobert Goodwill (Conservative)
Number of membersOne
Created fromScarborough
19181974 (1974)
Number of membersOne
Type of constituencyCounty constituency
Replaced byScarborough
Created fromScarborough and Whitby

Scarborough and Whitby is a constituency[n 1] represented in the House of Commons of the UK Parliament since 2005 by Robert Goodwill, a Conservative.[n 2]

History[]

The constituency name has had two separate periods of existence.

1918–1974

A Scarborough and Whitby division of the North Riding of Yorkshire was created by the Representation of the People Act 1918 after the Boundary Commission of 1917 and first elected a Member of Parliament in the 1918 general election. This division took the entirety of the abolished Parliamentary borough of Scarborough together with the majority of the previous Whitby division and a very small part of Cleveland division[n 3]. It had a population, in the middle of 1914, of 72,979.[2] The Boundary Commission had initially recommended that the division simply be called 'Scarborough' but an amendment moved by the Government during enactment of their recommendations enacted it from the outset as Scarborough and Whitby.[3] Throughout its 56-year first creation which allowed a full franchise for all resident men it was represented by a Conservative, including during the Attlee Ministry and First Wilson Ministry.

Changes to boundaries

The Initial Report of the Boundary Commission in 1947 made minor changes to the constituency, in line with local government changes which had abolished Guisborough Rural District in 1932 and absorbed it into Whitby Rural District. The new constituency again included the whole of Whitby Rural District, and so gained Hinderwell which was previously within Cleveland constituency. It had an electorate of 67,884 on 15 October 1946.[4] No change was made in the First Periodical Report of the Boundary Commission in 1954.[5]

The Second Periodical Report, published in 1969 recommended that the constituency be divided and its recommendations came into effect at the February 1974 general election abolishing the seat. The Scarborough constituency was thereby re-established, and Whitby joined with Guisborough, Loftus, Saltburn and Brotton to form Cleveland and Whitby.

By the beginning of the Third Periodical Report of the Boundary Commission, Cleveland had been created as a new county, which would normally prevent the Commission from recommending a constituency crossing the border. Several representations were made to the Commission to try to preserve Cleveland and Whitby constituency, but the Commission found itself unable to accept them and recommended putting Scarborough and Whitby together in a new Scarborough despite including the other coastal town, its old name, including Whitby, was finally reinstated in the next review.[n 4] This constituency did not include Pickering, which was placed in a new Ryedale constituency.[6]

1997-date

In the Fourth Periodical Report of the Boundary Commission for England, published in 1995 and coming into effect at the 1997 general election, the Scarborough constituency was renamed as Scarborough and Whitby with no change in boundaries.[7]

When the constituency was recreated in 1997, the Labour candidate, Lawrie Quinn, defeated John Sykes, the sitting Conservative MP – one of many locally and national press-predicted unlikely gains for Labour in their landslide victory of that year. The current incumbent, Robert Goodwill, defeated Quinn in 2005 to regain the seat for Conservatives.

Prominent members[]

Sir Herbert Paul Latham was the first sitting Member of Parliament serving in the army to have been court martialled since 1815.

Sir Alexander Spearman served as the Parliamentary Private Secretary to the President of the Board of Trade from 1951 to 1952.

Sir Robert Goodwill served in as a junior minister in both the Cameron–Clegg coalition and the second Cameron ministry.

Boundaries[]

Map of current boundaries

1918–1950: The Municipal Borough of Scarborough, the Urban Districts of Pickering, Scalby, and Whitby, the Rural Districts of Scarborough and Whitby, and parts of the Rural District of Pickering and Guisborough.

1950–1974: The Municipal Borough of Scarborough, the Urban Districts of Pickering, Scalby, and Whitby, and the Rural Districts of Scarborough and Whitby.

1997–2010: The Borough of Scarborough wards of Ayton, Castle, Cayton, Central, Danby, Derwent, Eastfield, Eskdaleside, Falsgrave, Fylingdales, Lindhead, Mayfield, Mulgrave, Newby, Northstead, Scalby, Seamer, Streonshalh, Weaponness, and Woodlands.

2010–present: The Borough of Scarborough wards of Castle, Cayton, Central, Danby, Derwent Valley, Eastfield, Esk Valley, Falsgrave Park, Fylingdales, Lindhead, Mayfield, Mulgrave, Newby, North Bay, Northstead, Ramshill, Scalby Hackness and Staintondale, Seamer, Stepney, Streonshalh, Weaponness, Whitby West Cliff, and Woodlands.

Constituency profile[]

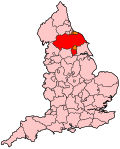
The constituency covers the towns of Scarborough and Whitby. Both of these are seaside towns in North Yorkshire on the north-east coast of England. However, the constituency is largely rural and semi-rural, such issues tend to influence voting preferences, with Scarborough itself mostly Labour and the rural areas Conservative. At the last two general elections, it was the most marginal seat in North Yorkshire.

In statistics

The constituency consists of Census Output Areas of a Borough with a working population whose income is close to the national average and lower than average reliance upon social housing.[8] At the end of 2012 the unemployment rate in the constituency stood as 4.8% of the population claiming jobseekers allowance, compared to the regional average of 4.7%.[9] The borough has a medium-high 28.8% of its population without a car, a high 26.0% of the population without qualifications and a medium 22.7% with level 4 qualifications or above.

In terms of tenure, a high 75.8% of homes are owned outright or on a mortgage as at the 2011 UK Census across the borough.[10]

Members of Parliament[]

MPs 1918–1974[]

Scarborough and Whitby 1918-1950
Year Member[11] Party
1918 Gervase Beckett Unionist
1922 Sidney Herbert Unionist
1931 Paul Latham Conservative
1941 Alexander Spearman Conservative
1966 Michael Shaw Conservative
1974 constituency abolished

MPs since 1997[]

Election Member[11] Party
1997 Lawrie Quinn Labour
2005 Robert Goodwill Conservative

Elections[]

Elections in the 2010s[]

General election 2019: Scarborough and Whitby[12]
Party Candidate Votes % ±%
Conservative Robert Goodwill 27,593 55.5 +7.1
Labour Hugo Fearnley 17,323 34.8 -6.8
Liberal Democrats Robert Lockwood 3,038 6.1 +3.4
Yorkshire Lee Derrick 1,770 3.6 +2.9
Majority 10,270 20.7 +13.9
Turnout 49,724 66.8 -1.8
Conservative hold Swing +6.9
General election 2017: Scarborough and Whitby[13]
Party Candidate Votes % ±%
Conservative Robert Goodwill 24,401 48.4 +5.2
Labour Eric Broadbent 20,966 41.6 +11.4
UKIP Sam Cross 1,682 3.3 -13.8
Liberal Democrats Robert Lockwood 1,354 2.7 -1.8
Green David Malone 915 1.8 -2.8
Independent John Freeman 680 1.4 New
Yorkshire Bill Black 369 0.7 New
Independent Gordon Johnson 82 0.2 New
Majority 3,435 6.8 -6.2
Turnout 50,523 68.6 +3.7
Conservative hold Swing -3.1
General election 2015: Scarborough and Whitby[14][15]
Party Candidate Votes % ±%
Conservative Robert Goodwill 20,613 43.2 +0.4
Labour Ian McInnes 14,413 30.2 +3.9
UKIP Sam Cross 8,162 17.1 +14.1
Green David Malone 2,185 4.6 +3.1
Liberal Democrats Michael Beckett 2,159 4.5 -18.0
Alliance for Green Socialism Juliet Boddington 207 0.4 +0.2
Majority 6,200 13.0 -3.5
Turnout 47,739 64.9 -0.4
Conservative hold Swing -1.8
Scarborough & Whitby 1997-
General election 2010: Scarborough and Whitby[16][17]
Party Candidate Votes % ±%
Conservative Robert Goodwill 21,108 42.8 +1.8
Labour Annajoy David 12,978 26.3 -12.0
Liberal Democrats Tania Exley-Moore 11,093 22.5 +6.5
UKIP Michael James 1,484 3.0 +1.0
BNP Trisha Scott 1,445 2.9 New
Green Dilys Cluer 734 1.5 -1.1
Independent Peter Popple 329 0.7 New
Alliance for Green Socialism Juliet Boddington 111 0.2 New
Majority 8,130 16.5 +13.9
Turnout 49,282 65.3 +1.8
Conservative hold Swing +6.9

Elections in the 2000s[]

General election 2005: Scarborough and Whitby[18]
Party Candidate Votes % ±%
Conservative Robert Goodwill 19,248 41.0 +1.4
Labour Lawrie Quinn 18,003 38.4 -8.8
Liberal Democrats Tania Exley-Moore 7,495 16.0 +7.6
Green Jonathan Dixon 1,214 2.6 +0.4
UKIP Paul Abbott 952 2.0 0.0
Majority 1,245 2.6 N/A
Turnout 46.912 71.7 +8.5
Conservative gain from Labour Swing +5.1
General election 2001: Scarborough and Whitby[19]
Party Candidate Votes % ±%
Labour Lawrie Quinn 22,426 47.2 +1.6
Conservative John Sykes 18,841 39.6 +3.4
Liberal Democrats Thomas Pearce 3,977 8.4 -5.7
Green Jonathan Dixon 1,049 2.2 New
UKIP John Jacob 970 2.0 New
ProLife Alliance Theresa Murray 260 0.5 New
Majority 3,585 7.6 -1.8
Turnout 47,523 63.2 -8.4
Labour hold Swing

Elections in the 1990s[]

General election 1997: Scarborough and Whitby[20]
Party Candidate Votes % ±%
Labour Lawrie Quinn 24,791 45.6 +15.7
Conservative John Sykes 19,667 36.2 -13.6
Liberal Democrats Martin Allinson 7,672 14.1 -4.8
Referendum Shelagh Murray 2,191 4.0 New
Majority 5,124 9.4 N/A
Turnout 54,321 71.6 -5.6
Labour gain from Conservative Swing +14.7

Election in the 1970s[]

General election 1970: Scarborough & Whitby
Party Candidate Votes % ±%
Conservative Michael Shaw 26,154 49.8 +6.7
Liberal Michael Ford Pitts 16,517 31.5 -0.3
Labour Jean B Hewitson 9,802 18.7 -5.5
Majority 9,637 18.3 +7.0
Turnout 52,473 71.5 -2.6
Conservative hold Swing

Elections in the 1960s[]

General election 1966: Scarborough & Whitby
Party Candidate Votes % ±%
Conservative Michael Shaw 21,141 43.1 -2.9
Liberal Richard S Rowntree 15,599 31.8 +1.9
Labour Jack Goodhand 11,848 24.2 +0.2
Ind. Conservative Jane Ellis 429 0.9 New
Majority 5,542 11.3 -4.8
Turnout 49,017 74.1 -0.8
Conservative hold Swing
General election 1964: Scarborough & Whitby
Party Candidate Votes % ±%
Conservative Alexander Spearman 22,632 46.0 -8.3
Liberal Richard S Rowntree 14,725 29.9 +6.7
Labour Peter Hardy 11,818 24.0 +1.5
Majority 7,907 16.1 -15.0
Turnout 49,175 74.9 +2.3
Conservative hold Swing

Elections in the 1950s[]

General election 1959: Scarborough & Whitby
Party Candidate Votes % ±%
Conservative Alexander Spearman 25,226 54.3 -3.6
Liberal Gilbert Gray 10,759 23.2 +3.5
Labour Guy Barnett 10,468 22.5 +0.1
Majority 14,467 31.1 -4.4
Turnout 46,453 72.6 0.0
Conservative hold Swing
General election 1955: Scarborough & Whitby
Party Candidate Votes % ±%
Conservative Alexander Spearman 27,133 57.9 -8.6
Labour John Archer 10,488 22.4 -11.1
Liberal Gilbert Gray 9,215 19.7 New
Majority 16,645 35.5 +2.5
Turnout 46,453 72.6 -3.3
Conservative hold Swing
General election 1951: Scarborough & Whitby
Party Candidate Votes % ±%
Conservative Alexander Spearman 32,988 66.5 +11.3
Labour Henry Brinton 16,621 33.5 +5.9
Majority 16,367 33.0 +2.4
Turnout 49,609 75.9 -4.9
Conservative hold Swing
General election 1950: Scarborough & Whitby
Party Candidate Votes % ±%
Conservative Alexander Spearman 28,896 55.2 +4.3
Labour Philip Taylor 14,421 27.6 +4.8
Liberal Ronald William Sykes 8,989 17.2 -9.1
Majority 14,475 27.6 +3.0
Turnout 52,306 80.8 +11.6
Conservative hold Swing

Elections in the 1940s[]

General election 1945: Scarborough & Whitby
Party Candidate Votes % ±%
Conservative Alexander Spearman 20,786 50.9 -3.0
Liberal Humphrey Razzall 10,739 26.3 -12.4
Labour Douglas H Curry 9,289 22.8 +15.4
Majority 10,047 24.6 +9.4
Turnout 40,814 69.2 -5.5
Conservative hold Swing
1941 Scarborough and Whitby by-election
Party Candidate Votes % ±%
Conservative Alexander Spearman 12,518 60.8 +6.9
Independent Progressive William Hipwell 8,086 39.2 New
Majority 4,432 21.6 +6.4
Turnout 20,604 35.9 -38.8
Conservative hold Swing

General Election 1939/40:

Another general election was required to take place before the end of 1940. The political parties had been making preparations for an election to take place from 1939 and by the end of this year, the following candidates had been selected;

Elections in the 1930s[]

General election 1935: Scarborough & Whitby
Party Candidate Votes % ±%
Conservative Paul Latham 23,210 53.9 -29.1
Liberal Ramsay Muir 16,668 38.7 New
Labour T Wilson Coates 3,195 7.4 -9.6
Majority 6,542 15.19 -50.7
Turnout 43,073 74.7 +5.2
Conservative hold Swing
General election 1931: Scarborough & Whitby
Party Candidate Votes % ±%
Conservative Paul Latham 32,025 82.97
Labour Philip Sidney Eastman 6,575 17.03
Majority 25,450 65.94
Turnout 38,600 69.49
Conservative hold Swing
1931 Scarborough and Whitby by-election
Party Candidate Votes % ±%
Conservative Paul Latham 21,618 52.7 +4.4
Liberal Ramsay Muir 19,429 47.3 +6.4
Majority 2,189 5.4 -2.0
Turnout 41,047 75.5 -4.2
Conservative hold Swing

Elections in the 1920s[]

General election 1929: Scarborough and Whitby[22]
Party Candidate Votes % ±%
Unionist Sidney Herbert 20,710 48.3 -9.2
Liberal Henry Gisborne 17,544 40.9 +6.7
Labour Howard Doncaster Rowntree 4,645 10.8 +2.5
Majority 3,166 7.4 -15.9
Turnout 42,899 79.7 +0.8
Unionist hold Swing -8.0
General election 1924: Scarborough and Whitby[22]
Party Candidate Votes % ±%
Unionist Sidney Herbert 18,911 57.5 +2.3
Liberal Ashley Mitchell 11,223 34.2 -14.2
Labour Howard Doncaster Rowntree 2,713 8.3 New
Majority 7,688 23.3 +20.1
Turnout 32,847 78.9 +2.5
Unionist hold Swing
General election 1923: Scarborough and Whitby[22]
Party Candidate Votes % ±%
Unionist Sidney Herbert 15,927 51.6 -3.6
Liberal Ashley Mitchell 14,933 48.4 +3.6
Majority 994 3.2 -7.2
Turnout 30,860 76.4 +0.2
Unionist hold Swing -3.6
General election 1922: Scarborough and Whitby[22]
Party Candidate Votes % ±%
Unionist Sidney Herbert 16,358 55.2 -1.6
Liberal Sydney Peverill Turnball 13,262 44.8 +6.3
Majority 3,096 10.4 -7.7
Turnout 29,620 76.2 +16.1
Unionist hold Swing

Elections in the 1910s[]

General election 1918: Scarborough & Whitby[22]
Party Candidate Votes % ±%
C Unionist Gervase Beckett 11,764 56.6
Liberal Osbert Sitwell 7,994 38.5
Labour John Watson Rowntree 1,025 4.9
Majority 3,770 18.1
Turnout 20,783 60.1
Unionist win (new seat)
C indicates candidate endorsed by the coalition government.

See also[]

Notes[]

  1. ^ A county constituency (for the purposes of election expenses and type of returning officer)
  2. ^ As with all constituencies, the constituency elects one Member of Parliament (MP) by the first past the post system of election at least every five years.
  3. ^ The parishes of Westerdale and Commondale
  4. ^ Still as a county constituency

References[]

Specific
  1. ^ "Constituency data: electorates – House of Commons Library". Parliament UK. 15 June 2020. Retrieved 22 July 2020.
  2. ^ Statement 45 (County of York, North Riding), Schedule, "Report of the Boundary Commission (England & Wales)", Cd. 8756.
  3. ^ Hansard, HC 5ser vol 99 col 2395.
  4. ^ "Initial Report of the Boundary Commission for England", Cmd. 7260, p. 52.
  5. ^ "First Periodical Report of the Boundary Commission for England", Cmd. 9311, p. 39.
  6. ^ "Third Periodical Report", Boundary Commission for England, vol I, Cmnd. 8797-I, p. 130.
  7. ^ "Media Guide to the New Parliamentary Constituencies", ed. by Colin Rallings and Michael Thrasher, BBC/ITN/PA News/Sky, 1995, p. 8 note 1.
  8. ^ "Local statistics - Office for National Statistics". www.ons.gov.uk.
  9. ^ Unemployment claimants by constituency The Guardian
  10. ^ "2011 census interactive maps". Archived from the original on 29 January 2016.
  11. ^ a b Leigh Rayment's Historical List of MPs – Constituencies beginning with "S" (part 2)
  12. ^ "Scarborough & Whitby Parliamentary constituency". BBC News. BBC. Retrieved 4 December 2019.
  13. ^ "General Election 2017". Gazette & Herald. 11 May 2017.
  14. ^ "Election Data 2015". Electoral Calculus. Archived from the original on 17 October 2015. Retrieved 17 October 2015.
  15. ^ "Scarborough & Whitby". BBC News. Retrieved 13 May 2015.
  16. ^ "Election Data 2010". Electoral Calculus. Archived from the original on 26 July 2013. Retrieved 17 October 2015.
  17. ^ "Scarborough & Whitby". BBC News. Retrieved 7 May 2010.
  18. ^ "Election Data 2005". Electoral Calculus. Archived from the original on 15 October 2011. Retrieved 18 October 2015.
  19. ^ "Election Data 2001". Electoral Calculus. Archived from the original on 15 October 2011. Retrieved 18 October 2015.
  20. ^ "Election Data 1997". Electoral Calculus. Archived from the original on 15 October 2011. Retrieved 18 October 2015.
  21. ^ Hull Daily Mail, 21 July 1938
  22. ^ a b c d e British Parliamentary Election Results 1918-1949, Craig
General

Craig, F. W. S. (1983). British parliamentary election results 1918-1949 (3 ed.). Chichester: Parliamentary Research Services. ISBN 0-900178-06-X.

Sources[]

  • Craig, F. W. S. (1983) [1969]. British parliamentary election results 1918–1949 (3rd ed.). Chichester: Parliamentary Research Services. p. 509. ISBN 0-900178-06-X.
Retrieved from ""