1946 Australian federal election
| |||||||||||||||||||||||||||||||
All 74 seats of the House of Representatives 38 seats were needed for a majority in the House 19 (of the 36) seats of the Senate | |||||||||||||||||||||||||||||||
|---|---|---|---|---|---|---|---|---|---|---|---|---|---|---|---|---|---|---|---|---|---|---|---|---|---|---|---|---|---|---|---|
| |||||||||||||||||||||||||||||||
 Popular vote by state with graphs indicating the number of seats won. As this is an IRV election, seat totals are not determined by popular vote by state but instead via results in each electorate. | |||||||||||||||||||||||||||||||
| |||||||||||||||||||||||||||||||
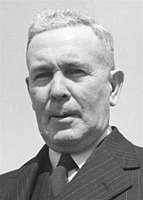

The 1946 Australian federal election was held in Australia on 28 September 1946. All 74 seats in the House of Representatives and 19 of the 36 seats in the Senate were up for election. The incumbent Labor Party led by Prime Minister Ben Chifley defeated the opposition Liberal–Country coalition, led by Robert Menzies. It was the Liberal Party's first federal election since its creation. This was the first time the Labor party had won a second consecutive election. This was also the last time the Labor party would win a federal election until the 1972 election.
The election was held in conjunction with three referendum questions, one of which was carried.
Results[]
House of Representatives[]
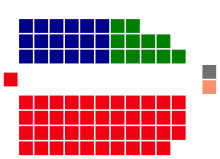
Labor: 43 seats
Liberal: 18 seats
Country: 11 seats
Lang Labor: 1 seat
Independent: 1 seat
| Party | Votes | % | Swing | Seats | Change | ||
|---|---|---|---|---|---|---|---|
| Labor | 2,159,953 | 49.71 | −0.22 | 43 | −6 | ||
| Liberal–Country coalition | 1,896,349 | 43.65 | +13.20 | 29 | +6 | ||
| Liberal | 1,431,682 | 32.95 | +11.05 | 18 | +4 | ||
| Country | 464,667 | 10.70 | +2.16 | 11 | +2 | ||
| Lang Labor | 69,138 | 1.59 | +0.87 | 1 | +1 | ||
| Communist | 64,811 | 1.49 | +1.49 | 0 | 0 | ||
| Services | 55,140 | 1.27 | +1.27 | 0 | 0 | ||
| Protestant People's | 20,111 | 0.46 | +0.46 | 0 | 0 | ||
| Independents | 79,040 | 1.82 | −10.34 | 1 | -1 | ||
| Total | 4,344,542 | 74 | |||||
| Two-party-preferred (estimated) | |||||||
| Labor | Win | 54.10 | −4.10 | 43 | −6 | ||
| Liberal–Country coalition | 45.90 | +4.10 | 29 | +6 | |||
- Notes
- Independent: Doris Blackburn (Bourke, Vic.)
- In South Australia, the Liberal Party was known as the Liberal and Country League.
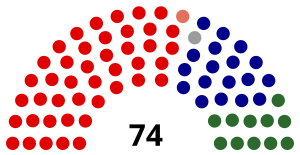
Senate[]
| Party | Votes | % | Swing | Seats won | Seats held | Change | ||
|---|---|---|---|---|---|---|---|---|
| Labor | 2,133,272 | 52.06 | −3.02 | 16 | 33 | +11 | ||
| Liberal–Country coalition | 1,775,022 | 43.33 | N/A | 3 | 3 | –11 | ||
| Liberal–Country joint ticket | 1,561,718 | 38.12 | N/A | 3 | N/A | N/A | ||
| Liberal | 213,304 | 5.21 | N/A | 0 | 2 | –10 | ||
| Country | N/A | N/A | N/A | 0 | 1 | –1 | ||
| Protestant People's | 123,541 | 3.02 | +3.02 | 0 | 0 | 0 | ||
| Services | 37,724 | 0.92 | +0.92 | 0 | 0 | 0 | ||
| Independents | 27,767 | 0.68 | –3.83 | 0 | 0 | 0 | ||
| Total | 4,097,326 | 19 | 36 | |||||

- Notes
- Of the three senators elected on Liberal–Country joint tickets, two were Liberal Party members and one was a Country Party member.
Seats changing hands[]
| Seat | Pre-1946 | Swing | Post-1946 | ||||||
|---|---|---|---|---|---|---|---|---|---|
| Party | Member | Margin | Margin | Member | Party | ||||
| Bourke, Vic | Labor | Bill Bryson | 3.6 | 4.7 | 1.1 | Doris Blackburn | Independent | ||
| Calare, NSW | Labor | John Breen | 9.9 | 11.7 | 1.8 | John Howse | Liberal | ||
| Capricornia, Qld | Labor | Frank Forde | 5.9 | 8.8 | 2.9 | Charles Davidson | Liberal | ||
| Franklin, Tas | Labor | Charles Frost | 9.9 | 10.0 | 0.1 | Bill Falkinder | Liberal | ||
| Henty, Vic | Independent | Arthur Coles | 5.5 | 9.8 | 4.3 | Jo Gullett | Liberal | ||
| Reid, NSW | Labor | Charles Morgan | N/A | 7.4 | 4.2 | Jack Lang | Lang Labor | ||
| Swan, WA | Labor | Don Mountjoy | 3.0 | 3.2 | 0.2 | Len Hamilton | Country | ||
| Wakefield, SA | Labor | Albert Smith | 1.2 | 3.9 | 2.7 | Philip McBride | Liberal | ||
| Wilmot, Tas | Liberal | Allan Guy | 1.7 | 3.4 | 1.7 | Gil Duthie | Labor | ||
- Members listed in italics did not contest their seat at this election.
See also[]
- Candidates of the Australian federal election, 1946
- Members of the Australian House of Representatives, 1946–1949
- Members of the Australian Senate, 1947–1950
References[]
- University of WA election results in Australia since 1890
- Two-party-preferred vote since 1937
| Federal elections | |
|---|---|
| Referendums | |
| |
Categories:
- Federal elections in Australia
- 1946 elections in Australia
- September 1946 events
- Aftermath of World War II in Australia