1990 Australian federal election
| |||||||||||||||||||||||||||||||
All 148 seats in the House of Representatives 75 seats were needed for a majority in the House 40 (of the 76) seats in the Senate | |||||||||||||||||||||||||||||||
|---|---|---|---|---|---|---|---|---|---|---|---|---|---|---|---|---|---|---|---|---|---|---|---|---|---|---|---|---|---|---|---|
| |||||||||||||||||||||||||||||||
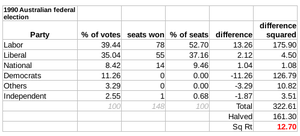
 Popular vote by state and territory with graphs indicating the number of seats won. As this is an IRV election, seat totals are not determined by popular vote by state or territory but instead via results in each electorate. | |||||||||||||||||||||||||||||||
| |||||||||||||||||||||||||||||||


The 1990 Australian federal election was held in Australia on 24 March 1990. All 148 seats in the House of Representatives and 40 seats in the 76-member Senate were up for election. The incumbent Australian Labor Party led by Bob Hawke defeated the opposition Liberal Party of Australia led by Andrew Peacock with coalition partner the National Party of Australia led by Charles Blunt despite losing the two-party-preferred vote. The election saw the reelection of a Hawke government, the fourth successive term.
This was the first, and to date only, time the Labor party won a fourth consecutive election. As of 2021, this is the most recent federal election in which both leaders of the two largest parties represented divisions outside New South Wales.
Background[]
John Howard lost the 1987 election to Hawke, and Andrew Peacock was elected Deputy Leader in a show of party unity. In May 1989 Peacock's supporters mounted a party room coup which returned Peacock to the leadership. Hawke's Treasurer, Keating, ridiculed him by asking: "Can the soufflé rise twice?" and calling him "all feathers and no meat". Hawke's government was in political trouble, with high interest rates and a financial crisis in Victoria.
The controversy over the Multifunction Polis boiled over during the federal election campaign. Peacock, declared that a future Coalition Government would abandon the project.[1] Peacock shared the Asian "enclave" fears of RSL president Alf Garland and others.[2] The following day, The Australian newspaper ran a headline "Peacock a 'danger in the Lodge'".[3]
Results[]
House of Representatives results[]
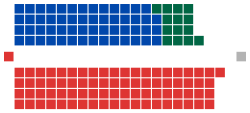
Labor (78)
Opposition (69)
Coalition
Liberal (55)
National (14)
Crossbench (1)
Independent (1)

| Party | Votes | % | Swing | Seats | Change | ||||
|---|---|---|---|---|---|---|---|---|---|
| Liberal–National coalition | 4,302,127 | 43.46 | –2.44 | 69 | +7 | ||||
| Liberal | 3,440,902 | 34.76 | +0.35 | 55 | +12 | ||||
| National | 833,557 | 8.42 | –3.10 | 14 | –5 | ||||
| Country Liberal | 27,668 | 0.28 | +0.05 | 0 | +0 | ||||
| Labor | 3,904,138 | 39.44 | –6.46 | 78 | –8 | ||||
| Democrats | 1,114,216 | 11.26 | +5.26 | 0 | 0 | ||||
| Greens* (state-based) | 137,351 | 1.37 | +1.37 | 0 | 0 | ||||
| Call to Australia | 96,497 | 0.97 | +0.97 | 0 | 0 | ||||
| Grey Power | 20,984 | 0.21 | +0.21 | 0 | 0 | ||||
| Democratic Socialist | 20,668 | 0.21 | +0.20 | 0 | 0 | ||||
| Rex Connor Labor | 8,277 | 0.08 | +0.08 | 0 | 0 | ||||
| New Australia | 7,043 | 0.07 | +0.07 | 0 | 0 | ||||
| Nuclear Disarmament | 5,578 | 0.06 | –0.05 | 0 | 0 | ||||
| Environment Independents | 4,866 | 0.05 | +0.05 | 0 | 0 | ||||
| Socialist | 2,255 | 0.02 | +0.02 | 0 | 0 | ||||
| Conservative | 1,734 | 0.02 | +0.02 | 0 | 0 | ||||
| Pensioner | 1,170 | 0.01 | –0.03 | 0 | 0 | ||||
| Independents | 272,770 | 2.76 | +0.90 | 1 | +1 | ||||
| Total | 9,899,674 | 148 | |||||||
| Two-party-preferred vote | |||||||||
| Labor | Win | 49.90 | −0.93 | 78 | −8 | ||||
| Liberal–National coalition | 50.10 | +0.93 | 69 | +7 | |||||
- Note: there was no federal Australian Greens party as yet. The Greens total includes Greens Western Australia (67,164), Green Alliance (47,697), Queensland Greens (10,054), United Tasmania Group (6,367), and ACT Green Democratic Alliance (6,069).
- Independents: Ted Mack
Senate results[]
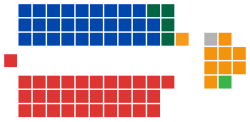
Labor (32)
Opposition (34)
Coalition
Liberal (29)
National (4)
CLP (1)
Crossbench (10)
Democrats (8)
WA Greens (1)
Independent (1)

| Party | Votes | % | Swing | Seats won | Seats held | Change | ||
|---|---|---|---|---|---|---|---|---|
| Liberal–National coalition | 4,162,633 | 41.92 | –0.12 | 19 | 34 | 0 | ||
| Liberal–National joint ticket | 2,429,552 | 24.47 | +10.71 | 5 | N/A | N/A | ||
| Liberal | 1,445,872 | 14.56 | –6.41 | 12 | 29 | +2 | ||
| National | 258,164 | 2.60 | −4.49 | 1 | 4 | –2 | ||
| Country Liberal | 29,045 | 0.29 | +0.08 | 1 | 1 | 0 | ||
| Labor | 3,813,547 | 38.41 | −4.42 | 15 | 32 | 0 | ||
| Democrats | 1,253,807 | 12.63 | +4.15 | 5 | 8 | +1 | ||
| Greens[a] | 208,157 | 2.10 | +1.66 | 1 | 1 | +1 | ||
| Call to Australia | 136,522 | 1.37 | –0.09 | 0 | 0 | 0 | ||
| Environment Independents | 74,668 | 0.75 | +0.75 | 0 | 0 | 0 | ||
| Independent EFF | 63,378 | 0.64 | +0.64 | 0 | 0 | 0 | ||
| Nuclear Disarmament | 38,079 | 0.38 | –0.71 | 0 | 0 | –1 | ||
| Grey Power | 37,600 | 0.38 | +0.38 | 0 | 0 | 0 | ||
| Democratic Socialist | 36,140 | 0.36 | +0.36 | 0 | 0 | 0 | ||
| Against Further Immigration | 19,439 | 0.20 | +0.20 | 0 | 0 | 0 | ||
| Pensioner | 18,235 | 0.18 | +0.00 | 0 | 0 | 0 | ||
| Democratic Labor | 14,744 | 0.15 | –0.39 | 0 | 0 | 0 | ||
| New Australia | 8,332 | 0.08 | +0.08 | 0 | 0 | 0 | ||
| Conservative | 7,381 | 0.07 | +0.07 | 0 | 0 | 0 | ||
| Citizens Electoral Council | 7,129 | 0.07 | +0.07 | 0 | 0 | 0 | ||
| Independent | 29,974 | 0.30 | –1.59 | 0 | 1 | –1 | ||
| Total | 9,929,765 | 40 | 76 | |||||
- Notes
- ^ There was no nation-wide Greens party. The total includes 76,381 votes for the Greens Western Australia (who elected one senator), 64,583 votes for the Green Alliance (NSW), 23,420 votes for the Victorian Greens, 19,499 votes for the Greens South Australia, 14,160 votes for the United Tasmania Group, 5,288 votes for the ACT Green Democratic Alliance, and 4,826 votes for the Greens New South Wales.
Seats changing hands[]
Members listed in italics did not contest their seat at this election. Where redistributions occurred, the pre-1990 margin represents the redistributed margin.
| Seat | Pre-1990 | Swing | Post-1990 | ||||||
|---|---|---|---|---|---|---|---|---|---|
| Party | Member | Margin | Margin | Member | Party | ||||
| Adelaide, SA | Liberal | Mike Pratt | 6.5* | N/A | 3.7 | Bob Catley | Labor | ||
| Aston, Vic | Labor | John Saunderson | 2.6 | 7.2 | 4.6 | Peter Nugent | Liberal | ||
| Ballarat, Vic | Labor | John Mildren | 2.1 | 4.0 | 1.9 | Michael Ronaldson | Liberal | ||
| Bendigo, Vic | Labor | John Brumby | 4.0 | 5.1 | 1.1 | Bruce Reid | Liberal | ||
| Corinella, Vic | Labor | notional – new seat | 5.3 | 6.0 | 0.7 | Russell Broadbent | Liberal | ||
| Dunkley, Vic | Labor | Bob Chynoweth | 5.6 | 6.8 | 1.2 | Frank Ford | Liberal | ||
| Fairfax, Qld | National | Evan Adermann | N/A | N/A | 7.5 | Alex Somlyay | Liberal | ||
| Hawker, SA | Labor | Elizabeth Harvey | 1.2 | 1.2 | 0.0 | Chris Gallus | Liberal | ||
| Kennedy, Qld | National | Bob Katter | 3.0 | 4.4 | 1.4 | Rob Hulls | Labor | ||
| La Trobe, Vic | Labor | Peter Milton | 4.2 | 4.6 | 1.4 | Bob Charles | Liberal | ||
| McEwen, Vic | Labor | Peter Cleeland | 2.9 | 6.1 | 3.2 | Fran Bailey | Liberal | ||
| McMillan, Vic | Labor | Barry Cunningham | 3.0 | 7.4 | 4.4 | John Riggall | Liberal | ||
| Moreton, Qld | Liberal | Don Cameron | 0.7 | 3.0 | 2.3 | Garrie Gibson | Labor | ||
| North Sydney, NSW | Liberal | John Spender | N/A | N/A | 7.7 | Ted Mack | Independent | ||
| Page, NSW | National | Ian Robinson | 4.5 | 5.2 | 0.7 | Harry Woods | Labor | ||
| Richmond, NSW | National | Charles Blunt | 6.6 | 7.1 | 0.5 | Neville Newell | Labor | ||
Notes[]
- Adelaide, SA, won by Labor at the previous election, was won by Liberal in a by-election. The margin listed above is the by-election margin.
- Deakin, Vic, won by Liberal at the previous election, was made notionally Labor in the redistribution and is considered a Liberal gain.
- Isaacs, Vic and Moore, WA, won by Labor at the previous election, were made notionally Liberal in the redistribution and are considered Liberal retains.
- Henty, Vic and Streeton, Vic, won by Labor at the previous election, were abolished.
Outcome[]
The 1990 election resulted in a modest swing to the opposition Coalition. Though Labor had to contend with the late 80s/early 90s recession, they won a record fourth successive election and a record 10 years in government with Bob Hawke as leader, a level of political success not previously seen by federal Labor. The election was to be Hawke's last as Prime Minister and Labor leader, he was replaced by Paul Keating on 20 December 1991 who would go on to lead Labor to win a record fifth successive election and a record 13 years (to the day) in government resulting from the 1993 election.
At the election, the Coalition won a slim majority of the two-party vote, and slashed Labor's majority from 24 seats to nine, most of the gains made in Victoria.[4] However, it only managed a two-party swing of 0.9 percent, which was not nearly enough to deliver the additional seven seats the Coalition needed to make Peacock Prime Minister. Despite having regained much of what the non-Labor forces had lost three years earlier, Peacock was forced to resign after the election.
This election saw the peak of the Australian Democrats' popularity under Janine Haines, and a WA Greens candidate won a seat in the Australian Senate for the first time – although the successful candidate, Jo Vallentine, was already a two-term senator, having previously won a seat for the Nuclear Disarmament Party at the 1984 election, and the Vallentine Peace Group at the 1987 election. Until 2010, this was the only post-war election where a third party (excluding splinter state parties and the Nationals) has won more than 10% of the primary vote for elections to the Australian House of Representatives.
Since the 1918 Swan by-election which Labor unexpectedly won with the largest primary vote, a predecessor of the Liberals, the Nationalist Party of Australia, changed the lower house voting system from first-past-the-post to full-preference preferential voting as of the subsequent 1919 election which has remained in place since, allowing the Coalition parties to safely contest the same seats. Full-preference preferential voting re-elected the Hawke government, the first time in federal history that Labor had obtained a net benefit from preferential voting.[5]
It also saw the Nationals' leader, Charles Blunt, defeated in his own seat of Richmond by Labor challenger Neville Newell—only the second time that a major party leader had lost his own seat. Newell benefited from the presence of independent and anti-nuclear activist Helen Caldicott. Her preferences flowed overwhelmingly to Newell on the third count, allowing Newell to win despite having been second on the primary vote.
See also[]
- Candidates of the Australian federal election, 1990
- Members of the Australian House of Representatives, 1990–1993
- Members of the Australian Senate, 1990–1993
Notes[]
- ^ Hamilton, "Serendipity City", pp. 152-55.
- ^ Jupp, James (2 April 2007). From White Australia to Woomera: The Story of Australian Immigration. Cambridge University Press. pp. 107–219. ISBN 978-0-521-69789-7. Retrieved 12 January 2008.
- ^ "The more opinion, the less it matters". 23 May 2016.
- ^ Megalogenis, George (25 June 2021). "Hard lessons: On unis, Coalition has embraced Howard's way". The Sydney Morning Herald. Retrieved 27 June 2021.
- ^ Antony Green (23 September 2015). "The Origin of Senate Group Ticket Voting, and it didn't come from the Major Parties". Blogs.abc.net.au. Retrieved 30 July 2016.
References[]
- University of WA election results in Australia since 1890
- AEC 2PP vote
- AustralianPolitics.com election details
External links[]
| Federal elections | |
|---|---|
| Referendums | |
| |
- 1990 elections in Australia
- Federal elections in Australia
- Bob Hawke
- March 1990 events in Australia