1975 Australian federal election
| |||||||||||||||||||||||||||||||
All 127 seats of the House of Representatives 64 seats were needed for a majority in the House All 64 seats of the Senate | |||||||||||||||||||||||||||||||
|---|---|---|---|---|---|---|---|---|---|---|---|---|---|---|---|---|---|---|---|---|---|---|---|---|---|---|---|---|---|---|---|
| |||||||||||||||||||||||||||||||
 Popular vote by state and territory with graphs indicating the number of seats won. As this is an IRV election, seat totals are not determined by popular vote by state or territory but instead via results in each electorate. | |||||||||||||||||||||||||||||||
| |||||||||||||||||||||||||||||||

The 1975 Australian federal election was held in Australia on 13 December 1975. All 127 seats in the House of Representatives and all 64 seats in the Senate were up for election, due to a double dissolution.
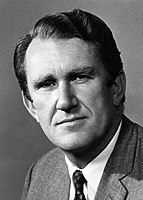
Malcolm Fraser had been commissioned as caretaker prime minister following the dismissal of Gough Whitlam's three-year-old Labor government by Governor-General Sir John Kerr, on 11 November 1975. The same day, Fraser advised an immediate double dissolution, in accordance with Kerr's stipulated conditions (see 1975 Australian constitutional crisis).
The Coalition of Fraser's Liberal Party of Australia and Doug Anthony's National Country Party secured government in its own right, winning the largest majority government to date in Australian history. The Liberals actually won a majority in their own right, with 68 seats–the first time that the main non-Labor party had done so since adopting the Liberal banner in 1944. Although Fraser had no need for the support of the National Country Party, the Coalition was retained.
Labor suffered a 30-seat swing and saw its lower house caucus cut almost in half, to 36 seats—fewer than it had when Whitlam became leader in the aftermath of the Coalition landslide nearly 10 years earlier, in the 1966 election.
Results[]
House of Representatives results[]

| Party | Votes | % | Swing | Seats | Change | ||
|---|---|---|---|---|---|---|---|
| Liberal–NCP coalition | 4,102,078 | 53.05 | +7.32 | 91 | +30 | ||
| Liberal | 3,232,159 | 41.80 | +6.85 | 68 | +28 | ||
| National Country | 853,943 | 11.04 | +0.28 | 22 | +1 | ||
| Country Liberal | 15,976 | 0.21 | +0.21 | 1 | +1 | ||
| Labor | 3,313,004 | 42.84 | −6.46 | 36 | −30 | ||
| Democratic Labor | 101,750 | 1.32 | −0.10 | 0 | 0 | ||
| Workers | 60,130 | 0.78 | +0.78 | 0 | 0 | ||
| Liberal Movement | 49,484 | 0.64 | –0.14 | 0 | 0 | ||
| Australia | 33,630 | 0.43 | −1.89 | 0 | 0 | ||
| Communist | 9,393 | 0.12 | +0.11 | 0 | 0 | ||
| Independent | 63,109 | 0.82 | +0.42 | 0 | 0 | ||
| Total | 7,732,578 | 127 | |||||
| Two-party-preferred (estimated) | |||||||
| Liberal–NCP coalition | Win | 55.70 | +7.40 | 91 | +30 | ||
| Labor | 44.30 | −7.40 | 36 | −30 | |||

Senate results[]

Coalition
Liberal (26)
NCP (8)
CLP (1)
Opposition (27)
Labor (27)
Crossbench (2)
Liberal Movement (1)
Independent (1)
| Party | Votes | % | Swing | Seats won | Seats held | Change | ||
|---|---|---|---|---|---|---|---|---|
| Liberal–NCP coalition (total) | 3,706,989 | 51.74 | +7.85 | 35 | 35 | +6 | ||
| Liberal–NCP joint ticket | 2,855,721 | 39.86 | +5.09 | 17 | * | * | ||
| Liberal | 793,772 | 11.08 | +3.26 | 16 | 26 | +3 | ||
| National Country | 41,977 | 0.59 | −0.71 | 1 | 8 | +2 | ||
| Country Liberal | 15,519 | 0.22 | +0.22 | 1 | 1 | +1 | ||
| Labor | 2,931,310 | 40.91 | −6.38 | 27 | 27 | −2 | ||
| Democratic Labor | 191,049 | 2.67 | −0.89 | 0 | 0 | 0 | ||
| Liberal Movement | 76,426 | 1.07 | +0.11 | 1 | 1 | 0 | ||
| Workers | 62,385 | 0.87 | +0.87 | 0 | 0 | 0 | ||
| Family Movement | 45,658 | 0.64 | +0.64 | 0 | 0 | 0 | ||
| Australia | 34,632 | 0.48 | –0.91 | 0 | 0 | 0 | ||
| United Tasmania | 1,227 | 0.02 | –0.01 | 0 | 0 | 0 | ||
| Socialist | 727 | 0.01 | +0.01 | 0 | 0 | 0 | ||
| Independents | 114,310 | 1.60 | –0.52 | 1 | 1 | 0 | ||
| Total | 7,164,713 | 64 | 64 | +4 | ||||

- Notes
- Independent: Brian Harradine (Tasmania)
Seats changing hands[]
| Seat | Pre-1975 | Swing | Post-1975 | ||||||
|---|---|---|---|---|---|---|---|---|---|
| Party | Member | Margin | Margin | Member | Party | ||||
| Barton, NSW | Labor | Len Reynolds | 5.1 | 10.0 | 4.9 | Jim Bradfield | Liberal | ||
| Bowman, Qld | Labor | Len Keogh | 1.3 | 8.4 | 7.1 | David Jull | Liberal | ||
| Braddon, Tas | Labor | Ron Davies | 4.8 | 8.6 | 3.8 | Ray Groom | Liberal | ||
| Brisbane, Qld | Labor | Manfred Cross | 1.1 | 5.0 | 3.9 | Peter Johnson | Liberal | ||
| Canberra, ACT | Labor | Kep Enderby | 7.1 | 10.4 | 3.3 | John Haslem | Liberal | ||
| Capricornia, Qld | Labor | Doug Everingham | 4.9 | 5.0 | 0.1 | Colin Carige | National Country | ||
| Casey, Vic | Labor | Race Mathews | 1.5 | 9.0 | 7.5 | Peter Falconer | Liberal | ||
| Cook, NSW | Labor | Ray Thorburn | 0.5 | 8.3 | 7.8 | Don Dobie | Liberal | ||
| Dawson, Qld | Labor | Rex Patterson | 0.6 | 4.2 | 3.6 | Ray Braithwaite | National Country | ||
| Denison, Tas | Labor | John Coates | 2.8 | 7.7 | 4.9 | Michael Hodgman | Liberal | ||
| Diamond Valley, Vic | Labor | David McKenzie | 0.7 | 9.8 | 9.1 | Neil Brown | Liberal | ||
| Eden-Monaro, NSW | Labor | Bob Whan | 0.1 | 5.6 | 5.5 | Murray Sainsbury | Liberal | ||
| Evans, NSW | Labor | Allan Mulder | 4.9 | 6.9 | 2.0 | John Abel | Liberal | ||
| Franklin, Tas | Labor | Ray Sherry | 12.9 | 14.7 | 1.8 | Bruce Goodluck | Liberal | ||
| Henty, Vic | Labor | Joan Child | 1.5 | 6.7 | 5.2 | Ken Aldred | Liberal | ||
| Holt, Vic | Labor | Max Oldmeadow | 6.9 | 8.5 | 1.6 | William Yates | Liberal | ||
| Isaacs, Vic | Labor | Gareth Clayton | 0.6 | 7.5 | 6.9 | David Hamer | Liberal | ||
| Kalgoorlie, WA | Labor | Fred Collard | 2.1 | 6.3 | 4.3 | Mick Cotter | Liberal | ||
| Kingston, SA | Labor | Richard Gun | 6.1 | 12.7 | 6.6 | Grant Chapman | Liberal | ||
| La Trobe, Vic | Labor | Tony Lamb | 4.6 | 8.9 | 4.3 | Marshall Baillieu | Liberal | ||
| Leichhardt, Qld | Labor | Bill Fulton | 3.3 | 5.7 | 2.4 | David Thomson | National Country | ||
| Macarthur, NSW | Labor | John Kerin | 4.4 | 8.5 | 4.1 | Michael Baume | Liberal | ||
| Macquarie, NSW | Labor | Tony Luchetti | 8.7 | 10.3 | 1.6 | Reg Gillard | Liberal | ||
| McMillan, Vic | National Country | Arthur Hewson | N/A | 2.1 | 6.7 | Barry Simon | Liberal | ||
| Perth, WA | Labor | Joe Berinson | 8.2 | 9.0 | 0.8 | Ross McLean | Liberal | ||
| Phillip, NSW | Labor | Joe Riordan | 4.5 | 7.1 | 2.6 | Jack Birney | Liberal | ||
| St George, NSW | Labor | Bill Morrison | 5.8 | 5.8 | 0.0 | Maurice Neil | Liberal | ||
| Swan, WA | Labor | Adrian Bennett | 5.6 | 7.7 | 2.1 | John Martyr | Liberal | ||
| Tangney, WA | Labor | John Dawkins | 3.1 | 9.7 | 6.6 | Peter Richardson | Liberal | ||
- Members listed in italics did not contest their seat at this election.
Issues and significance[]

The election followed the controversial dismissal of the Whitlam government by Governor-General Sir John Kerr in the 1975 constitutional crisis. Labor campaigners hoped that the electorate would "maintain [its] rage" and punish the Coalition for its part in bringing down the government, proclaiming "Shame Fraser, Shame". However, the Coalition focused on economic issues following the 1973 oil crisis and 1973–75 recession, the so-called Loans Affair, alleged Labor mismanagement of inflation, and campaigned under the slogan "Turn on the lights, Australia" (drawing on a contemporary cynicism: "Would the last businessman leaving Australia please turn out the lights?").
The Australian Capital Territory and the Northern Territory received an entitlement to elect two senators each as a consequence of the Senate (Representation of Territories) Act 1973, passed during the 1974 Joint Sitting of the Australian Parliament.
See also[]
- Candidates of the Australian federal election, 1975
- Members of the Australian House of Representatives, 1975–1977
- Members of the Australian Senate, 1975–1978
References[]
- AustralianPolitics.com 1975 election details
- University of WA election results in Australia since 1890
- AEC 2PP vote
| Federal elections | |
|---|---|
| Referendums | |
| |
- 1975 Australian constitutional crisis
- 1975 elections in Australia
- Federal elections in Australia
- Gough Whitlam
- Malcolm Fraser
- December 1975 events in Australia