1996 Australian federal election
| ||||||||||||||||||||||||||||||||||
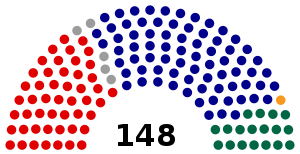
All 148 seats in the House of Representatives 75 seats were needed for a majority in the House 40 (of the 76) seats in the Senate | ||||||||||||||||||||||||||||||||||
|---|---|---|---|---|---|---|---|---|---|---|---|---|---|---|---|---|---|---|---|---|---|---|---|---|---|---|---|---|---|---|---|---|---|---|
| ||||||||||||||||||||||||||||||||||
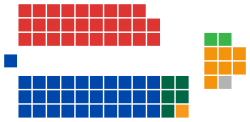
 Popular vote by state and territory with graphs indicating the number of seats won. As this is an IRV election, seat totals are not determined by popular vote by state or territory but instead via results in each electorate. | ||||||||||||||||||||||||||||||||||
| ||||||||||||||||||||||||||||||||||


The 1996 Australian federal election was held to determine the members of the 38th Parliament of Australia. It was held on 2 March 1996. All 148 seats of the House of Representatives and 40 seats of the 76-seat Senate were up for election. The centre-right Liberal/National Coalition led by Opposition Leader John Howard of the Liberal Party and coalition partner Tim Fischer of the National Party defeated the incumbent centre-left Australian Labor Party government led by Prime Minister Paul Keating in a landslide.
The election marked the end of the 5-term, 13-year Hawke-Keating Government that began in 1983. Howard was sworn in as the new Prime Minister of Australia on 11 March 1996, along with the First Howard Ministry. This election was the start of the 11-year Howard Government; the Labor party would spend this period in opposition and would not return to government until the 2007 election.
This was the first federal election that future Prime Minister Tony Abbott contested as a member of parliament, having entered parliament at the 1994 Warringah by-election. Future opposition leaders Brendan Nelson and Anthony Albanese also entered parliament at this election.
Howard became the first Liberal leader to win an election from opposition since Robert Menzies in 1949. (Malcolm Fraser was caretaker prime minister in the 1975 election.)
Background[]
John Howard, who had previously led the Liberal Party from 1985 to 1989, had returned to the leadership in January 1995 following a disastrous 8 months under the leadership of Alexander Downer. Downer and Peter Costello had succeeded Dr. John Hewson and Michael Wooldridge early in 1994 and were touted as the leaders of the new-generation Liberals. In the end, the party opted for the seasoned Howard, perhaps an acknowledgment that he was the only one left standing after a decade of party infighting.
Howard approached the campaign with a determination to present as small a target as possible. Throughout 1995, he refused to detail specific policy proposals, focusing the Coalition's attacks mainly on the longevity and governing record of the Labor government. By 1996, however, it was clear that the electorate had tired of Labor and Paul Keating in particular. "The recession we had to have" line resonated with deadly force throughout the electorate. Although Keating's big picture approach to republicanism, reconciliation with Australia's Indigenous peoples and engagement with Asia galvanised support within Labor's urban constituencies, Howard was able to attract support amongst disaffected mainstream Australians – including traditionally Labor-voting blue-collar workers and middle-class suburban residents. He also promised to retain Medicare and hold a constitutional convention to decide whether Australia would become a republic.
The election-eve Newspoll reported the Liberal/National Coalition held an estimated 53.5 percent two-party-preferred vote.[1]
Result[]
House of Representatives results[]
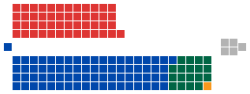
Coalition
Liberal (75)
National (18)
CLP (1)
Opposition (49)
Labor (49)
Crossbench (5)
Independent (5)
| Party | Votes | % | Swing | Seats | Change | |||
|---|---|---|---|---|---|---|---|---|
| Liberal–National coalition | 5,142,161 | 47.25 | +2.98 | 94 | +29 | |||
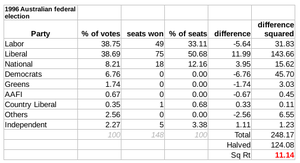
| Liberal | 4,210,689 | 38.69 | +1.92 | 75 | +26 | |||
| National | 893,170 | 8.21 | +1.04 | 18 | +2 | |||
| Country Liberal | 38,302 | 0.35 | +0.02 | 1 | +1 | |||
| Labor | 4,217,765 | 38.75 | −6.17 | 49 | −31 | |||
| Democrats | 735,848 | 6.76 | +3.01 | 0 | 0 | |||
| Greens* | 317,654 | 2.92 | +1.09 | 0 | 0 | |||
| Against Further Immigration | 73,023 | 0.67 | +0.64 | 0 | 0 | |||
| Call to Australia | 43,183 | 0.40 | −0.08 | 0 | 0 | |||
| Natural Law | 41,573 | 0.38 | −0.36 | 0 | 0 | |||
| No Aircraft Noise | 18,626 | 0.17 | +0.17 | 0 | 0 | |||
| Indigenous Peoples | 12,507 | 0.11 | +0.08 | 0 | 0 | |||
| Reclaim Australia | 6,457 | 0.06 | +0.06 | 0 | 0 | |||
| Women's | 6,173 | 0.06 | +0.06 | 0 | 0 | |||
| One Australia | 3,159 | 0.03 | +0.03 | 0 | 0 | |||
| Grey Power | 2,815 | 0.03 | +0.01 | 0 | 0 | |||
| Pensioner & CIR Alliance | 332 | 0.00 | +0.00 | 0 | 0 | |||
| Republican | 156 | 0.00 | +0.00 | 0 | 0 | |||
| Independents | 262,420 | 2.41 | −0.73 | 5 | +3 | |||
| Total | 10,883,852 | 148 | +1 | |||||
| Two-party-preferred vote | ||||||||
| Liberal–National coalition | Win | 53.63 | +5.07 | 94 | +29 | |||
| Labor | 46.37 | −5.07 | 49 | −31 | ||||
- Note: the federal Australian Greens were founded in 1992, but not all local organisations immediately affiliated. The Greens total includes Australian Greens (188,994), Greens Western Australia (53,101), Victorian Greens (52,810), Tasmanian Greens (19,689), Central Coast Green Party (1,887), and Richmond/Clarence Greens (1,173).
- Independents: Peter Andren, Pauline Hanson, Allan Rocher, Graeme Campbell, Paul Filing
Senate results[]
Coalition
Liberal (31)
National (5)
CLP (1)
Opposition (29)
Labor (29)
Crossbench (10)
Democrats (7)
Greens (2)
Independent (1)

| Party | Votes | % | Swing | Seats won | Seats held | ||
|---|---|---|---|---|---|---|---|
| Liberal–National coalition | 4,792,682 | 43.97 | +0.92 | 20 | 37 | ||
| Liberal–National joint ticket | 2,669,377 | 24.49 | +0.09 | 6 | N/A | ||
| Liberal | 1,770,486 | 16.24 | +0.65 | 12 | 31 | ||
| National | 312,769 | 2.87 | +0.15 | 1 | 5 | ||
| Country Liberal | 40,050 | 0.37 | +0.04 | 1 | 1 | ||
| Labor | 3,940,150 | 36.15 | −7.35 | 14 | 29 | ||
| Democrats | 1,179,357 | 10.82 | +5.51 | 5 | 7 | ||
| Greens[a] | 345,513 | 3.17 | +0.67 | 1 | 2 | ||
| Against Further Immigration | 137,604 | 1.26 | +0.82 | 0 | 0 | ||
| Call to Australia | 117,274 | 1.08 | +0.25 | 0 | 0 | ||
| Shooters | 114,724 | 1.05 | +0.45 | 0 | 0 | ||
| Women's | 49,131 | 0.45 | +0.45 | 0 | 0 | ||
| Reclaim Australia | 44,545 | 0.41 | +0.41 | 0 | 0 | ||
| Democratic Labor | 36,156 | 0.33 | −0.03 | 0 | 0 | ||
| Better Future | 18,960 | 0.17 | +0.17 | 0 | 0 | ||
| Natural Law | 17,082 | 0.16 | −0.20 | 0 | 0 | ||
| No Aircraft Noise | 17,043 | 0.16 | −0.20 | 0 | 0 | ||
| Grey Power | 13,401 | 0.12 | −0.04 | 0 | 0 | ||
| Pensioner & CIR Alliance | 9,040 | 0.08 | −0.13 | 0 | 0 | ||
| Seniors | 8,268 | 0.08 | +0.08 | 0 | 0 | ||
| Republican | 7,778 | 0.07 | −0.06 | 0 | 0 | ||
| One Australia | 3,638 | 0.03 | +0.03 | 0 | 0 | ||
| Indigenous Peoples | 2,772 | 0.03 | −0.03 | 0 | 0 | ||
| Independent EFF | 2,430 | 0.02 | +0.02 | 0 | 0 | ||
| Independents | 41,489 | 0.38 | −1.99 | 0 | 1 | ||
| Total | 10,899,037 | 40 | 76 | ||||
- Notes
- ^ Includes votes for the federal Australian Greens (261,677) as well as Greens Western Australia (57,006) and the Tasmanian Greens (26,830), which had not yet aligned with the federal party
Analysis[]
Overall the coalition won 29 seats from Labor while the ALP won 4 seats from the Liberals. These 4 seats were Canberra and Namadgi in the ACT and Isaacs and Bruce in Victoria. The ACT seats, which had been won by the Liberals in a by-election, fell to Labor due to a strong return to the ALP in a traditional Labor town by public servants fearing conservative cuts. The division of Brendan Smyth's seat of Canberra into the two new (of the three) ACT seats limited his campaign to the southernmost Tuggeranong seat of Namadgi where the ACT Labor right wing stood former MLA Annette Ellis who ran a tight grassroots campaign. Isaacs and Bruce fell to Labor due to demographic changes due to a redistribution of electoral boundaries.
Labor lost five percent of its two-party vote from 1993, and tallied its lowest primary vote since 1934 (an additional eight percent coming from preferences). The swing against Labor was not in and of itself enough to cause a change of government. However, Labor lost 13 of its 33 seats in New South Wales, and all but two of its 13 seats in Queensland. The 29-seat swing was the second-largest defeat, in terms of seats lost, by a sitting government in Australia. Three members of Keating's government—including Attorney-General Michael Lavarch —lost their seats. Keating resigned as Labor leader on the night of the election, and was succeeded by former Deputy Prime Minister and Finance Minister Kim Beazley.
Due in part to this large swing, Howard entered office with a 45-seat majority, the second-largest in Australian history (behind only the 55-seat majority won by Malcolm Fraser in 1975). The Liberals actually won a majority in their own right at this election with 75 seats, the most the party had ever won. Although Howard had no need for the support of the Nationals, the Coalition was retained. As of 2022, this is the last time the Liberals have won a majority in their own right at a federal election.
Exit polling showed the Coalition winning 47 percent of the blue-collar vote, compared with Labor's 39 percent; there was a 16-point drop in Labor's vote among members of trade unions. The Coalition won 48 percent of the Catholic vote and Labor 37 percent, a reversal of the usual figures.[2]
House of Reps preference flows[]
- The Democrats contested 138 electorates with preferences slightly favouring Labor (54.02%)
- The Greens contested 102 electorates with preferences favouring Labor (67.10%)
Seats changing hands[]
| Seat | Pre-1996 | Swing | Post-1996 | ||||||
|---|---|---|---|---|---|---|---|---|---|
| Party | Member | Margin | Margin | Member | Party | ||||
| Bass, Tas | Labor | Silvia Smith | 0.03 | 4.60 | 4.57 | Warwick Smith | Liberal | ||
| Bowman, Qld | Labor | Hon Con Sciacca | 8.14 | 9.03 | 0.89 | Andrea West | Liberal | ||
| Calare, NSW | Labor | David Simmons | N/A | N/A | 13.32 | Peter Andren | Independent | ||
| Canberra, ACT | Liberal | Brendan Smyth | 6.58 | 14.1 | 7.52 | Bob McMullan | Labor | ||
| Canning, WA | Labor | Hon George Gear | 0.19 | 0.88 | 0.69 | Ricky Johnston | Liberal | ||
| Capricornia, Qld | Labor | Marjorie Henzell | 2.78 | 6.40 | 3.62 | Paul Marek | National | ||
| Curtin, WA | Liberal | Allan Rocher | N/A | N/A | 7.28 | Allan Rocher | Independent | ||
| Dickson, Qld | Labor | Hon Michael Lavarch | 2.55 | 5.72 | 3.17 | Tony Smith | Liberal | ||
| Eden-Monaro, NSW | Labor | Jim Snow | 4.27 | 9.03 | 4.76 | Gary Nairn | Liberal | ||
| Gilmore, NSW | Labor | Peter Knott | 0.45 | 6.69 | 6.24 | Joanna Gash | Liberal | ||
| Griffith, Qld | Labor | Ben Humphreys | 5.90 | 7.37 | 1.47 | Graeme McDougall | Liberal | ||
| Herbert, Qld | Labor | Hon Ted Lindsay | 3.31 | 9.90 | 6.59 | Peter Lindsay | Liberal | ||
| Hughes, NSW | Labor | Hon Robert Tickner | 6.42 | 11.31 | 4.89 | Danna Vale | Liberal | ||
| Kalgoorlie, WA | Labor | Graeme Campbell | N/A | N/A | 10.35 | Graeme Campbell | Independent | ||
| Kingston, SA | Labor | Gordon Bilney | 1.45 | 3.46 | 2.01 | Susan Jeanes | Liberal | ||
| Leichhardt, Qld | Labor | Peter Dodd | 1.33 | 5.51 | 4.18 | Warren Entsch | Liberal | ||
| Lilley, Qld | Labor | Wayne Swan | 6.18 | 6.91 | 0.73 | Elizabeth Grace | Liberal | ||
| Lindsay, NSW | Labor | Ross Free | 10.22 | 11.80 | 1.58 | Jackie Kelly [3] | Liberal | ||
| Lowe, NSW | Labor | Mary Easson | 5.01 | 7.48 | 2.47 | Paul Zammit | Liberal | ||
| Macarthur, NSW | Labor | Chris Haviland | 1.28 | 11.97 | 10.69 | John Fahey | Liberal | ||
| Macquarie, NSW | Labor | Maggie Deahm | 0.12 | 6.48 | 6.36 | Kerry Bartlett | Liberal | ||
| Makin, SA | Labor | Peter Duncan | 3.71 | 4.79 | 1.08 | Trish Draper | Liberal | ||
| McEwen, Vic | Labor | Peter Cleeland | 0.69 | 1.50 | 2.19 | Fran Bailey | Liberal | ||
| McMillan, Vic | Labor | Barry Cunningham | 0.53 | 2.60 | 2.07 | Russell Broadbent | Liberal | ||
| Moore, WA | Liberal | Paul Filing | N/A | N/A | 15.48 | Paul Filing | Independent | ||
| Moreton, Qld | Labor | Garrie Gibson | 0.21 | 5.30 | 5.09 | Gary Hardgrave | Liberal | ||
| Murray, Vic | National | Bruce Lloyd | N/A | N/A | 3.70* | Sharman Stone | Liberal | ||
| North Sydney, NSW | Independent | Ted Mack | 1.8 | 17.4 | 15.6 | Joe Hockey | Liberal | ||
| Northern Territory, NT | Labor | Warren Snowdon | 5.31 | 5.68 | 0.37 | Nick Dondas | Country Liberal | ||
| Oxley, Qld | Labor | Les Scott | 14.65 | 19.31** | 4.66 | Pauline Hanson | Independent | ||
| Page, NSW | Labor | Harry Woods | 0.13 | 4.44 | 4.31 | Ian Causley | National | ||
| Parramatta, NSW | Labor | Paul Elliott | 3.24 | 7.11 | 3.87 | Ross Cameron | Liberal | ||
| Paterson, NSW | Labor | Bob Horne | 3.30 | 3.73 | 0.43 | Bob Baldwin | Liberal | ||
| Petrie, Qld | Labor | Gary Johns | 2.15 | 9.85 | 7.70 | Teresa Gambaro | Liberal | ||
| Richmond, NSW | Labor | Neville Newell | 1.78 | 8.53 | 6.75 | Larry Anthony | National | ||
| Robertson, NSW | Labor | Frank Walker | 5.56 | 9.12 | 3.56 | Jim Lloyd | Liberal | ||
| Swan, WA | Labor | Kim Beazley | 0.22 | 3.93 | 3.71 | Don Randall | Liberal | ||
| Wills, Vic | Independent | Phil Cleary | n/a | 4.37 | n/a | Kelvin Thomson | Labor | ||
- *Figure is Liberal against Nationals.
- **Figure is a swing compared to Liberal vote at the last election.
See also[]
- Candidates of the 1996 Australian federal election
- Members of the Australian House of Representatives, 1996–1998
- Members of the Australian Senate, 1996–1999
References[]
- ^ "Newspoll archive since 1987". Polling.newspoll.com.au.tmp.anchor.net.au. Archived from the original on 3 March 2016. Retrieved 30 July 2016.
- ^ John Stone (15 March 1996). "Remember, it was Paul Keating". The Australian Financial Review.
- ^ Kelly conceded that she was incapable of being chosen as a member of the House of Representatives while serving as an officer of the RAAF and won the subsequent by-election with an increased margin: Holland, I (2004). "Section 44 of the Constitution". Parliamentary Library of Australia.
External links[]
- Australian Electoral Commission Results
- University of WA election results in Australia since 1890
- AEC 2PP vote
- AustralianPolitics.com election details
- Preference flows – ABC
| Federal elections | |
|---|---|
| Referendums | |
| |
Politics of Australia | ||
|---|---|---|
| Commonwealth |
|  |
| Federal elections | ||
| State/territory governments |
| |
| State/territory elections | ||
| Local government | ||
| Political parties |
| |
| Political terminology |
| |
- Federal elections in Australia
- 1996 elections in Australia
- Keating Government
- March 1996 events in Australia