2016 United States presidential election in Oklahoma
| |||||||||||||||||||||||||||||||||
| Turnout | 49.0% | ||||||||||||||||||||||||||||||||
|---|---|---|---|---|---|---|---|---|---|---|---|---|---|---|---|---|---|---|---|---|---|---|---|---|---|---|---|---|---|---|---|---|---|
| |||||||||||||||||||||||||||||||||
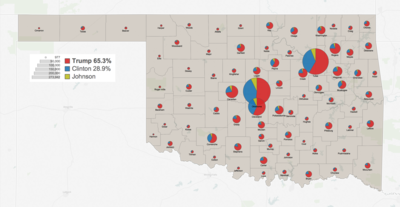
 County Results
Trump 50–60% 60–70% 70–80% 80–90%
| |||||||||||||||||||||||||||||||||
| |||||||||||||||||||||||||||||||||
| Elections in Oklahoma |
|---|
 |
|
show |
|
show |
|
|

The 2016 United States presidential election in Oklahoma was held on Tuesday, November 8, 2016, as part of the 2016 United States presidential election in which all 50 states plus the District of Columbia participated. Oklahoma voters chose electors to represent them in the Electoral College via a popular vote, pitting the Republican Party's nominee, businessman Donald Trump, and running mate Indiana Governor Mike Pence against Democratic Party nominee, former Secretary of State Hillary Clinton, and her running mate Virginia Senator Tim Kaine. Oklahoma has seven electoral votes in the Electoral College.[2]
Oklahoma has been a Republican-leaning state since 1952, and a Republican stronghold since 1980. Trump subsequently carried the state with 65.3% of the vote, while Clinton received 28.9%.[3] Considered a safe Republican state, Oklahoma has voted Republican in fifteen of the last sixteen elections. It was also one of two states where Trump won every county, the other being West Virginia. This also marked the fourth consecutive election in which the Republican candidate carried every county in the state.[4]
Gary Johnson, the Libertarian Party candidate, became the first third-party candidate to achieve ballot access in Oklahoma since 2000. He received 5.75% of the vote, the highest percentage for a third party in the state since Ross Perot's campaign in 1996. He was also the only third-party candidate to successfully file for ballot access in Oklahoma.
Primary elections[]
Democratic primary[]
This section should include a summary of 2016 Oklahoma Democratic primary. (July 2016) |
- Results
| |||||||||||||||||||
| |||||||||||||||||||
 Oklahoma results by county
Bernie Sanders
Hillary Clinton | |||||||||||||||||||
| hideOklahoma Democratic primary, March 1, 2016 | |||||
|---|---|---|---|---|---|
| Candidate | Popular vote | Estimated delegates | |||
| Count | Percentage | Pledged | Unpledged | Total | |
| Bernie Sanders | 174,228 | 51.88% | 21 | 1 | 22 |
| Hillary Clinton | 139,443 | 41.52% | 17 | 1 | 18 |
| Martin O'Malley (withdrawn) | 7,672 | 2.28% | |||
| Keith Judd | 4,386 | 1.31% | |||
| Michael Steinberg | 4,171 | 1.24% | |||
| (withdrawn) | 3,458 | 1.03% | |||
| Rocky De La Fuente | 2,485 | 0.74% | |||
| Uncommitted | N/A | 0 | 2 | 2 | |
| Total | 335,843 | 100% | 38 | 4 | 42 |
| Source: The Green Papers, Oklahoma State Election Board | |||||
Republican primary[]
| |||||||||||||||||||||||||||||||||||||||||
| |||||||||||||||||||||||||||||||||||||||||
 Oklahoma results by county
Ted Cruz
Donald Trump
Marco Rubio | |||||||||||||||||||||||||||||||||||||||||


Twelve candidates appeared on the Republican presidential primary ballot:[5]
| Candidate | Votes | Percentage | Actual delegate count | ||
|---|---|---|---|---|---|
| Bound | Unbound | Total | |||
| Ted Cruz | 158,078 | 34.37% | 15 | 0 | 15 |
| Donald Trump | 130,267 | 28.32% | 14 | 0 | 14 |
| Marco Rubio | 119,633 | 26.01% | 12 | 0 | 12 |
| Ben Carson | 28,601 | 6.22% | 0 | 0 | 0 |
| John Kasich | 16,524 | 3.59% | 0 | 0 | 0 |
| Jeb Bush (withdrawn) | 2,091 | 0.45% | 0 | 0 | 0 |
| Rand Paul (withdrawn) | 1,666 | 0.36% | 0 | 0 | 0 |
| Mike Huckabee (withdrawn) | 1,308 | 0.28% | 0 | 0 | 0 |
| Carly Fiorina (withdrawn) | 610 | 0.13% | 0 | 0 | 0 |
| Chris Christie (withdrawn) | 545 | 0.12% | 0 | 0 | 0 |
| Rick Santorum (withdrawn) | 375 | 0.08% | 0 | 0 | 0 |
| Lindsey Graham (withdrawn) | 224 | 0.05% | 0 | 0 | 0 |
| Unprojected delegates: | 2 | 0 | 2 | ||
| Total: | 459,922 | 100.00% | 43 | 0 | 43 |
| Source: The Green Papers | |||||
Polling[]
General election[]
Predictions[]
The following are final 2016 predictions from various organizations for Oklahoma as of Election Day.
| Source | Ranking | As of |
|---|---|---|
| Los Angeles Times[6] | Safe R | November 6, 2016 |
| CNN[7] | Safe R | November 8, 2016 |
| Rothenberg Political Report[8] | Safe R | November 7, 2016 |
| Sabato's Crystal Ball[9] | Safe R | November 7, 2016 |
| NBC[10] | Likely R | November 7, 2016 |
| RealClearPolitics[11] | Safe R | November 8, 2016 |
| Fox News[12] | Safe R | November 7, 2016 |
| ABC[13] | Safe R | November 7, 2016 |
Slates of electors[]
Republican: David Oldham, Teresa Lyn Turner, Mark Thomas, Bobby Cleveland, Lauree Elizabeth Marshall, Charles W. Potts, George W. Wiland, Jr
Libertarian: Erin Adams, Mikel Dillon, Joel Britt Dixon, Rex L. Lawhorn, Ephriam Zachary Knight, Craig A. Dawkins, Mark C. DeShazo
Democrat: Marq Lewis, Bill John Baker, Mark Hammons, Betty McElderry, W. A. Drew Edmondson, Jeannie McDaniel, Rhonda Walters[14]
Statewide results[]
Chart of popular vote
| 2016 United States presidential election in Oklahoma[15] | |||||
|---|---|---|---|---|---|
| Party | Candidate | Votes | Percentage | Electoral votes | |
| Republican | Donald Trump | 949,136 | 65.32% | 7 | |
| Democratic | Hillary Clinton | 420,375 | 28.93% | 0 | |
| Libertarian | Gary Johnson | 83,481 | 5.75% | 0 | |
| Totals | 1,452,992 | 100.00% | 7 | ||
Analysis[]
The Republican Party candidate, Donald Trump, carried Oklahoma with a victory margin of 36.39%. While Trump improved over Mitt Romney's 2012 vote total and victory margin, his vote percentage of 65.3% was down from Romney's 66.8%, making 2016 the first time since 1992 the Republican's vote percentage decreased from the previous election. Hillary Clinton's vote percentage of 28.9% is the worst for a Democratic candidate in Oklahoma since George McGovern's 24% in the 1972 election. Clinton however, did make gains in heavily populated Oklahoma County, its surrounding suburban counties, and Tulsa County. In Oklahoma County, Clinton reduced a 16.66% advantage for Romney into a 10.5% advantage for Trump, while Trump was held below the 60% mark in Tulsa.[16] Gary Johnson's total was more than twice what was needed to preserve recognized status for the Libertarian Party in the state, meaning that in 2018 the LP will be the first alternative party on the ballot for a gubernatorial election since the Reform Party in 1998.[17]
With 65.32% of the popular vote, Oklahoma would prove to be Trump's third strongest state in the 2016 election after Wyoming and West Virginia.[18] His win in the 2nd Congressional District was the second best of the five congressional districts in Oklahoma that he won, and he also carried the critical Native American vote in the state[citation needed] (this included all the counties of the proposed Native American state of Sequoyah). The state would also prove to be Gary Johnson's fourth strongest state with 5.75% of the popular vote after New Mexico, North Dakota and Alaska.
Results by county[]
| County[19] | Trump | Trump % | Clinton | Clinton % | Johnson | Johnson % | Total |
|---|---|---|---|---|---|---|---|
| Adair | 4,787 | 73.50% | 1,382 | 21.22% | 344 | 5.28% | 6,513 |
| Alfalfa | 1,933 | 85.61% | 216 | 9.57% | 109 | 4.83% | 2,253 |
| Atoka | 4,084 | 81.39% | 795 | 15.84% | 139 | 2.77% | 5,018 |
| Beaver | 1,993 | 88.85% | 176 | 7.85% | 74 | 3.30% | 2,243 |
| Beckham | 6,308 | 83.53% | 960 | 12.71% | 284 | 3.76% | 7,552 |
| Blaine | 2,884 | 76.03% | 711 | 18.75% | 198 | 5.22% | 3,793 |
| Bryan | 10,478 | 75.83% | 2,804 | 20.29% | 536 | 3.88% | 13,818 |
| Caddo | 6,482 | 69.34% | 2,420 | 25.89% | 446 | 4.77% | 9,348 |
| Canadian | 39,986 | 72.34% | 11,674 | 21.12% | 3,618 | 6.55% | 55,278 |
| Carter | 13,752 | 74.20% | 4,002 | 21.59% | 780 | 4.21% | 18,534 |
| Cherokee | 9,994 | 60.61% | 5,456 | 33.09% | 1,040 | 6.31% | 16,490 |
| Choctaw | 4,206 | 77.52% | 1,067 | 19.66% | 153 | 2.82% | 5,426 |
| Cimarron | 963 | 89.25% | 71 | 6.58% | 45 | 4.17% | 1,079 |
| Cleveland | 62,538 | 57.14% | 38,829 | 35.48% | 8,083 | 7.39% | 109,450 |
| Coal | 1,898 | 79.12% | 411 | 17.13% | 90 | 3.75% | 2,399 |
| Comanche | 19,183 | 58.91% | 11,463 | 35.20% | 1,918 | 5.89% | 32,564 |
| Cotton | 2,054 | 78.94% | 424 | 16.30% | 124 | 4.77% | 2,602 |
| Craig | 4,283 | 74.04% | 1,252 | 21.64% | 250 | 4.32% | 5,785 |
| Creek | 21,575 | 74.84% | 5,841 | 20.26% | 1,414 | 4.90% | 28,830 |
| Custer | 7,826 | 74.24% | 2,104 | 19.96% | 611 | 5.80% | 10,541 |
| Delaware | 11,826 | 75.25% | 3,311 | 21.07% | 579 | 3.68% | 15,716 |
| Dewey | 1,965 | 87.41% | 222 | 9.88% | 61 | 2.71% | 2,248 |
| Ellis | 1,611 | 88.18% | 155 | 8.48% | 61 | 3.34% | 1,827 |
| Garfield | 16,009 | 73.74% | 4,397 | 20.25% | 1,304 | 6.01% | 21,710 |
| Garvin | 8,253 | 78.26% | 1,855 | 17.59% | 438 | 4.15% | 10,546 |
| Grady | 17,316 | 77.70% | 3,882 | 17.42% | 1,088 | 4.88% | 22,286 |
| Grant | 1,827 | 83.01% | 288 | 13.08% | 86 | 3.91% | 2,201 |
| Greer | 1,482 | 78.16% | 323 | 17.04% | 91 | 4.80% | 1,896 |
| Harmon | 715 | 73.18% | 225 | 23.03% | 37 | 3.79% | 977 |
| Harper | 1,318 | 87.93% | 134 | 8.94% | 47 | 3.14% | 1,499 |
| Haskell | 3,701 | 78.11% | 882 | 18.62% | 155 | 3.27% | 4,738 |
| Hughes | 3,388 | 74.86% | 961 | 21.23% | 177 | 3.91% | 4,526 |
| Jackson | 5,969 | 76.47% | 1,473 | 18.87% | 364 | 4.66% | 7,806 |
| Jefferson | 1,910 | 81.28% | 365 | 15.53% | 75 | 3.19% | 2,350 |
| Johnston | 3,093 | 76.98% | 786 | 19.56% | 139 | 3.46% | 4,018 |
| Kay | 12,172 | 72.44% | 3,738 | 22.25% | 893 | 5.31% | 16,803 |
| Kingfisher | 5,156 | 84.10% | 786 | 12.82% | 189 | 3.08% | 6,131 |
| Kiowa | 2,596 | 74.32% | 767 | 21.96% | 130 | 3.72% | 3,493 |
| Latimer | 3,100 | 76.43% | 797 | 19.65% | 159 | 3.92% | 4,056 |
| Le Flore | 13,362 | 77.59% | 3,250 | 18.87% | 609 | 3.54% | 17,221 |
| Lincoln | 10,854 | 77.39% | 2,430 | 17.33% | 741 | 5.28% | 14,025 |
| Logan | 13,633 | 71.83% | 4,428 | 22.38% | 1,098 | 5.79% | 18,979 |
| Love | 2,922 | 77.12% | 735 | 19.40% | 132 | 3.48% | 3,789 |
| Major | 2,948 | 86.53% | 310 | 9.10% | 149 | 4.37% | 3,407 |
| Marshall | 4,206 | 76.58% | 1,096 | 19.96% | 190 | 3.46% | 5,492 |
| Mayes | 11,555 | 73.52% | 3,423 | 21.78% | 739 | 4.70% | 15,717 |
| McClain | 13,169 | 78.12% | 2,894 | 17.17% | 795 | 4.72% | 16,858 |
| McCurtain | 8,656 | 80.70% | 1,802 | 16.80% | 268 | 2.50% | 10,726 |
| McIntosh | 5,505 | 69.13% | 2,123 | 26.66% | 335 | 4.21% | 7,963 |
| Murray | 4,175 | 75.52% | 1,087 | 19.66% | 266 | 4.81% | 5,528 |
| Muskogee | 15,043 | 62.12% | 7,977 | 32.94% | 1,196 | 4.94% | 24,216 |
| Noble | 3,715 | 76.16% | 901 | 18.47% | 262 | 5.37% | 4,878 |
| Nowata | 3,321 | 78.38% | 742 | 17.51% | 174 | 4.11% | 4,237 |
| Okfuskee | 2,800 | 71.01% | 943 | 23.92% | 200 | 5.07% | 3,943 |
| Oklahoma | 141,569 | 51.68% | 112,813 | 41.18% | 19,560 | 7.14% | 273,943 |
| Okmulgee | 8,944 | 64.12% | 4,385 | 31.44% | 620 | 4.44% | 13,949 |
| Osage | 12,577 | 66.31% | 5,597 | 29.31% | 792 | 4.18% | 18,966 |
| Ottawa | 7,631 | 71.38% | 2,584 | 24.17% | 475 | 4.44% | 10,690 |
| Pawnee | 4,729 | 74.31% | 1,344 | 21.12% | 291 | 4.57% | 6,364 |
| Payne | 16,651 | 59.98% | 8,788 | 31.66% | 2,321 | 8.36% | 27,760 |
| Pittsburg | 12,753 | 73.84% | 3,711 | 21.49% | 807 | 4.67% | 17,271 |
| Pontotoc | 10,431 | 70.33% | 3,637 | 24.52% | 763 | 5.14% | 14,831 |
| Pottawatomie | 17,848 | 70.12% | 6,015 | 23.63% | 1,589 | 6.24% | 25,452 |
| Pushmataha | 3,581 | 79.88% | 748 | 16.69% | 154 | 3.44% | 4,483 |
| Roger Mills | 1,547 | 87.95% | 151 | 8.58% | 61 | 3.47% | 1,759 |
| Rogers | 30,913 | 75.65% | 7,902 | 19.34% | 2,047 | 5.01% | 40,862 |
| Seminole | 5,613 | 69.84% | 2,071 | 25.77% | 353 | 4.39% | 8,037 |
| Sequoyah | 10,888 | 75.42% | 3,061 | 21.20% | 488 | 3.38% | 14,437 |
| Stephens | 14,182 | 79.21% | 3,086 | 17.24% | 636 | 3.55% | 17,904 |
| Texas | 4,621 | 79.95% | 858 | 14.84% | 301 | 5.21% | 5,780 |
| Tillman | 1,944 | 71.84% | 657 | 24.28% | 105 | 3.88% | 2,706 |
| Tulsa | 144,258 | 58.39% | 87,847 | 35.56% | 14,949 | 6.05% | 247,054 |
| Wagoner | 23,005 | 73.50% | 6,723 | 21.48% | 1,572 | 5.02% | 31,300 |
| Washington | 15,825 | 71.21% | 5,048 | 22.71% | 1,351 | 6.08% | 22,224 |
| Washita | 3,854 | 83.22% | 588 | 12.70% | 189 | 4.08% | 4,631 |
| Woods | 2,947 | 80.34% | 522 | 14.23% | 199 | 5.43% | 3,668 |
| Woodward | 6,347 | 83.57% | 873 | 11.49% | 375 | 4.94% | 7,595 |
| All Counties | 949,136 | 65.32% | 420,375 | 28.93% | 83,481 | 5.75% | 1,452,992 |
By congressional district[]
Trump won all five congressional districts.[20]
| District | Trump | Clinton | Representative |
|---|---|---|---|
| 1st | 61% | 33% | Jim Bridenstine |
| 2nd | 73% | 23% | Markwayne Mullin |
| 3rd | 74% | 21% | Frank Lucas |
| 4th | 66% | 28% | Tom Cole |
| 5th | 53% | 40% | Steve Russell |
See also[]
- 2016 Democratic Party presidential debates and forums
- 2016 Democratic Party presidential primaries
- 2016 Republican Party presidential debates and forums
- 2016 Republican Party presidential primaries
References[]
- ^ "2016 General Election Turnout". United States Elections Project. Archived from the original on November 11, 2016. Retrieved April 21, 2019.
- ^ "Distribution of Electoral Votes". National Archives and Records Administration. Retrieved December 18, 2020.
- ^ "Oklahoma Election Results 2016". NYTimes.com. 2016. Archived from the original on July 17, 2017. Retrieved July 19, 2017.
- ^ "History of Oklahoma voting in presidential elections since 1932". KJRH. November 7, 2016. Archived from the original on September 9, 2017. Retrieved July 23, 2017.
- ^ "Nineteen candidates file for Oklahoma Presidential Primary". Fox23.com. Archived from the original on January 28, 2016. Retrieved January 21, 2016.
- ^ "Our final map has Clinton winning with 352 electoral votes. Compare your picks with ours". Los Angeles Times. November 6, 2016. Retrieved November 13, 2016.
- ^ "Road to 270: CNN's general election map - CNNPolitics.com". Cnn.com. November 8, 2016. Retrieved November 13, 2016.
- ^ "Presidential Ratings". The Rothenberg Political Report. Retrieved August 16, 2021.
- ^ "Larry J. Sabato's Crystal Ball » 2016 President". Centerforpolitics.org. November 7, 2016. Retrieved November 13, 2016.
- ^ Todd, Chuck. "NBC's Final Battleground Map Shows Clinton With a Significant Lead". NBC News. Retrieved November 13, 2016.
- ^ "2016 Election Maps - Battle for White House". RealClearPolitics. Retrieved November 13, 2016.
- ^ "Electoral Scorecard: Map shifts again in Trump's favor, as Clinton holds edge". Fox News. November 7, 2016. Retrieved November 13, 2016.
- ^ "The Final 15: The Latest Polls in the Swing States That Will Decide the Election". Abcnews.go.com. November 7, 2016. Retrieved November 13, 2016.
- ^ "Sample ballots for Oklahoma 2016 election". The Oklahoman. November 6, 2016.
- ^ "Archived copy" (PDF). Archived (PDF) from the original on November 12, 2016. Retrieved November 11, 2016.CS1 maint: archived copy as title (link)
- ^ "2016 Presidential Election Results". The New York Times. ISSN 0362-4331. Retrieved April 26, 2021.
- ^ "Libertarian Party makes historic strides in Oklahoma, U.S. elections". reddirtreport.com. November 11, 2016. Archived from the original on August 11, 2017. Retrieved August 10, 2017.
- ^ "2016 Presidential Election Statistics". Dave Leip’s Atlas of U.S. Presidential Elections. Archived from the original on July 13, 2018. Retrieved March 5, 2018.
- ^ "Official Results General Election — November 8, 2016", OK.gov, The State of Oklahoma, archived from the original on January 8, 2017, retrieved February 8, 2017
- ^ "Presidential Results by Congressional District, 2000-2008 – Swing State Project". www.swingstateproject.com. Archived from the original on October 16, 2015. Retrieved January 8, 2018.
| show State and district results of the 2016 United States presidential election |
|---|

- 2016 United States presidential election by state
- United States presidential elections in Oklahoma
- 2016 Oklahoma elections