Ideological leanings of United States Supreme Court justices
| This article is part of the series on the |
| Supreme Court of the United States |
|---|
 |
| The Court |
| Current membership |
|
| Lists of justices |
|
| Court functionaries |
|
The United States Supreme Court is the highest federal court of the United States. Established pursuant to Article Three of the United States Constitution in 1789, it has ultimate (and largely discretionary) appellate jurisdiction over all federal courts and state court cases involving issues of federal law plus original jurisdiction over a small range of cases. In the legal system of the United States, the Supreme Court is generally the final interpreter of federal law including the United States Constitution, but it may act only within the context of a case in which it has jurisdiction. The Court may decide cases having political overtones but does not have power to decide nonjusticiable political questions, and its enforcement arm is in the executive rather than judicial branch of government.
As established by the Judiciary Act of 1869, the Court normally consists of the Chief Justice of the United States and eight associate justices who are nominated by the president and confirmed by the Senate. The justices base their decisions on their interpretation of both legal doctrine and the precedential application of laws in the past. In most cases, interpreting the law is relatively clear-cut and the justices decide unanimously. However, in more complicated or controversial cases, the Court is often divided.
In modern discourse, the justices of the Court are often categorized as having conservative, moderate, or liberal philosophies of law and of judicial interpretation. It has long been commonly assumed that justices' votes are a reflection of their judicial decision-making philosophy as well as their ideological leanings, personal attitudes, values, political philosophies, or policy preferences. A growing body of academic research has confirmed this understanding, as scholars have found that the justices largely vote in consonance with their perceived values.[1][2] Analysts have used a variety of methods to deduce the specific perspective of each justice over time.
Ideological leanings over time[]
Researchers have carefully analyzed the judicial rulings of the Supreme Court—the votes and written opinions of the justices—as well as their upbringing, their political party affiliation, their speeches, their political contributions before appointment, editorials written about them at the time of their Senate confirmation, the political climate in which they are appointed, confirmed, and work, and the political contributions of the law clerks they hire.[3][4] From this data, scholars have inferred the ideological leanings of each justice and how the justices are likely to vote on upcoming cases.[5]
Using statistical analysis of Supreme Court votes, scholars found that an inferred value representing a Justice's ideological preference on a simple conservative–liberal scale is sufficient to predict a large number of that justice's votes.[6] Subsequently, using increasingly sophisticated statistical analysis, researchers have found that the policy preferences of many justices shift over time.[7][8][9] The ideological leanings of justices (and the drift over time) can be seen clearly in the research results of two sets of scholars using somewhat different models:
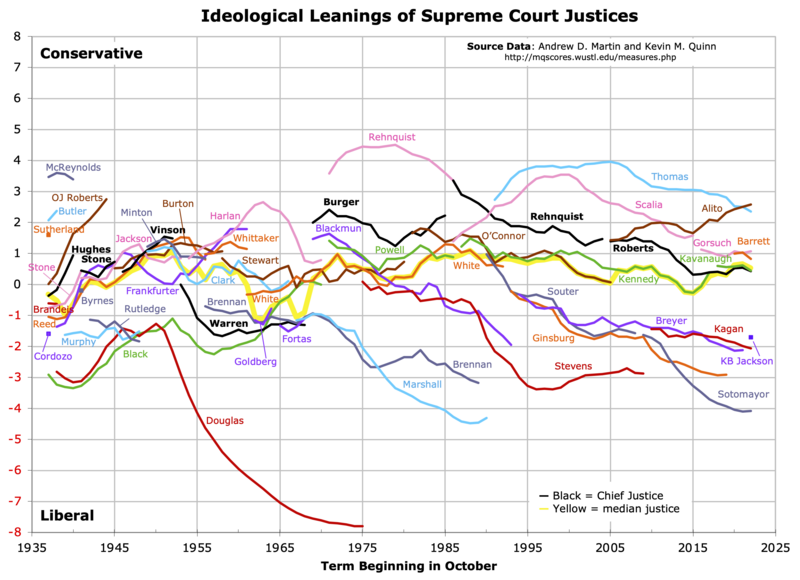
Andrew D. Martin and Kevin M. Quinn have employed Markov chain Monte Carlo methods to fit a Bayesian measurement model of ideal points (policy preferences on a one-dimensional scale) for all the justices based on the votes in every contested Supreme Court case since 1937.[10][11][12][13] The graph below shows the results of their analysis: the ideological leaning of each justice from the term that began in October 1937 to the term that began in October 2020.[14][15] Note that the scale and zero point are arbitrary—only the relative distance of the lines is important. Each unique color represents a particular Supreme Court seat, which makes the transitions from retiring justices to newly appointed justices easier to follow. The black lines represent the leanings of the Chief Justices. The yellow line represents the estimated location of the median justice—who, as Duncan Black's median voter theorem posits, is often the swing vote in closely divided decisions.[16]
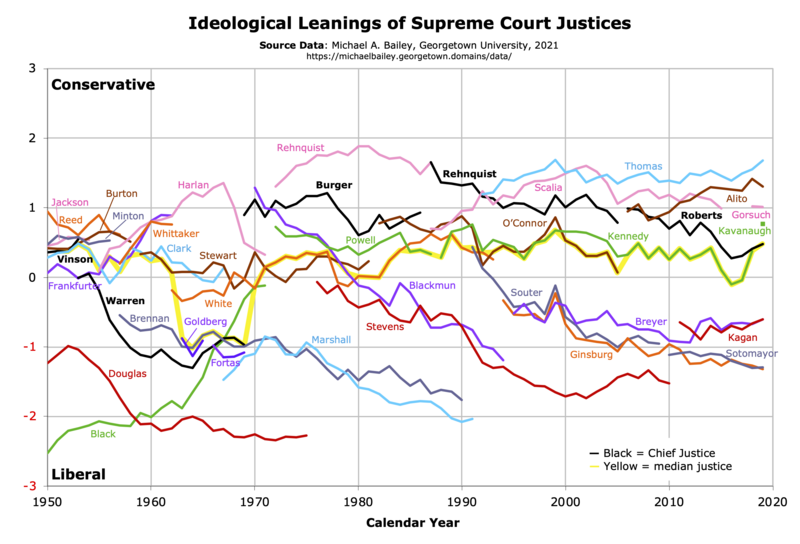
Michael A. Bailey used a slightly different Markov chain Monte Carlo Bayesian method to determine ideological leanings and made significantly different scaling assumptions.[17][18][19] He analyzed cases by calendar year and supplemented the data regarding votes in each Court case with additional information from the majority, concurring, and dissenting opinions in which justices commented on previous cases, as well as with votes made by members of Congress on similar legislation, amicus filings by Solicitors General and members of Congress, and presidential and Congressional positions on Court cases. This additional information gave him a richer dataset and also enabled him to deduce preference values that are more consistent with the DW-Nominate Common Space scores used to evaluate the ideological leanings of members of Congress and Presidents.[20] However, he only used votes and cases related to the major topics addressed by the courts in the postwar area: crime, civil rights, free speech, religion, abortion, and privacy. He did not include federalism or economic issues.[17][21]
The graph below shows the ideological leaning of each justice by calendar year from 1950 to 2011.[22] The scale and zero point roughly correspond to DW-Nominate Common Space scores, but otherwise are arbitrary. As in the graph above, each unique color represents a particular Supreme Court seat. The black lines represent the leanings of the Chief Justices. The yellow line represents the median justice.
These two graphs differ because of the choices of data sources, data coverage, coding of complicated cases, smoothing parameters, and statistical methods. Each of the lines in these graphs also has a wide band of uncertainty. Because these analyses are based on statistics and probability, it is important not to over-interpret the results.[23][24] Note that the nature of the cases the Supreme Court chooses to hear may lead the justices to appear more liberal or conservative than they would if they were hearing a different set of cases; the Court accepts only 100-200 of the more than 7,000 cases that it is asked to review each year.[25][26] In addition, all cases are valued equally even though, clearly, some cases are much more important than others.[27][28] Moreover, recent consequential cases decided through the "shadow docket" are not included at all.[29] Still, these graphs offer an indication of the overall ideological orientation of the justices and provide a visualization of changes in the Court's orientation over time.
Ideological shifts since 1937[]
In the early 1930s (earlier than the data on the Martin–Quinn graph), the "Four Horsemen" (Justices James McReynolds, Pierce Butler, George Sutherland, and Willis Van Devanter) mostly opposed the New Deal agenda proposed by President Franklin D. Roosevelt. The liberal "Three Musketeers" (Justices Harlan Stone, Benjamin Cardozo, and Louis Brandeis) generally supported the New Deal. Two justices (Chief Justice Charles Evans Hughes and Justice Owen Roberts) normally cast the swing votes.
As the Martin–Quinn graph shows, by the 1939 term, Roosevelt had moved the Court to a more liberal position by appointing four new justices including strong liberals Hugo Black, William O. Douglas, and Frank Murphy. However, led by the increasingly conservative Chief Justices Harlan Stone and Fred Vinson, the Court shifted in a more conservative direction through the early 1950s.
President Dwight Eisenhower appointed Earl Warren to be Chief Justice in 1953, and both graphs indicate that the Court then turned in a more liberal direction as Warren grew substantially more liberal and especially when he was joined by strong liberal justices William Brennan, Arthur Goldberg, Abe Fortas, and Thurgood Marshall (though Justices Black and Felix Frankfurter became more conservative over time). In the 1970s, the Court shifted in a more conservative direction when President Richard Nixon appointed Chief Justice Warren Burger and strong conservative Justices Lewis Powell, William Rehnquist, and Harry Blackmun, and more so when President Ronald Reagan elevated Rehnquist to Chief Justice (though Blackmun became more liberal over time). The Court shifted to an even more conservative orientation when it was joined by strong conservative Justices Antonin Scalia (appointed by President Ronald Reagan), Clarence Thomas (appointed by President George H.W. Bush), and Samuel Alito and Chief Justice John Roberts (both whom were appointed by President George W. Bush). During this time, Justice David Souter became more liberal.[30]
The current Roberts Court has become more conservative, now with six conservative justices that include Justices Gorsuch, Kavanaugh, and Barrett (appointed by President Trump). Dissenting in many key cases are Justices Sotomayor and Kagan (appointed by President Obama), and Justice Breyer (appointed by President Clinton).[15][31]
The most volatile seat appears to be Seat 10 (light blue lines) which was held by conservative Pierce Butler until 1939, then liberal Frank Murphy until 1949, then moderate-conservative Tom Clark until 1967, then strong liberal Thurgood Marshall until 1991, and then strong conservative Clarence Thomas. The path of Justice Harry Blackmun illustrates the ideological drift shown by many justices.[9] Blackmun (purple line) had a conservative score (Quinn–Martin = 1.465; Bailey = 0.43) in the 1969–70 term, his first on the bench, but had shifted to a liberal score (Quinn–Martin = −1.929; Bailey = −0.81) by the 1993–94 term, his last. The median justice (shown with a yellow background line) was Byron White (orange line) for most of the time from 1969 to 1989, Sandra Day O’Connor (dark brown line) from 1991 to 2005, Anthony Kennedy (green line) from 2006 to 2017, John Roberts (black line) in 2018 and 2019, and Brett Kavanaugh (green line) in 2020.[32]
As can be seen in these graphs, since the 1938 term, every Chief Justice (black lines), except Earl Warren and now John Roberts, has had a more conservative ideological lean than the median justice on the Court.
Career "liberal" voting percentage by issue area from 1946–2017[]
The following sortable table[a] lists the lifetime percentage "liberal" scores of Supreme Court justices as compiled in the Supreme Court Database.[33] The table shows data for justices whose service began at or after the 1946 term; the data ends with the 2016–2017 term.
The term liberal in the Supreme Court Database represents the voting direction of the justices across the various issue areas. It is most appropriate in the areas of criminal procedure, civil rights, and First Amendment cases, where it signifies pro-defendant votes in criminal procedure cases, pro-women or -minorities in civil rights cases, and pro-individual against the government in First Amendment cases. In takings clause cases, however, a pro-government/anti-owner vote is considered liberal. The use of the term is probably less appropriate in union cases, where it represents pro-union votes against both individuals and the government, and in economic cases, where it represents pro-government votes against challenges to federal regulatory authority and pro-competition, anti-business, pro-liability, pro-injured person, and pro-bankruptcy decisions. In federalism and federal taxation cases, the term indicates pro-national government positions.
- # (Justice number) – order that Supreme Court Justice was appointed
- Justice – Justice's name
- Year confirmed – year confirmed to the Supreme Court
- Position – Chief Justice or Associate Justice
- Criminal procedure – a higher number means pro-defendant votes in cases involving the rights of persons accused of crime, except for the due process rights of prisoners.
- Civil rights – a higher number means more votes permitting intervention on First Amendment freedom cases which pertain to classifications based on race (including Native Americans), age, indigence, voting, residence, military, or handicapped status, sex, or alienage.
- First Amendment – a higher number reflects votes that advocate individual freedoms with regard to speech.
- Union – a higher number means pro-union votes in cases involving labor activity.
- Economic – a higher number means more votes against commercial business activity, plus litigation involving injured persons or things, employee actions concerning employers, zoning regulations, and governmental regulation of corruption other than that involving campaign spending.
- Federalism – a higher number means votes for a larger, more empowered government in conflicts between the federal and state governments, excluding those between state and federal courts, and those involving the priority of federal fiscal claims.
- Federal taxes – a higher number means more votes widening the government's ability to define and enforce tax concepts and policies in cases involving the Internal Revenue Code and related statues.
A highlighted row indicates that the Justice is currently serving on the Court.
| # | Justice | Year confirmed | Year departed | Position | Criminal procedure | Civil rights | First amendment | Union | Economic | Federalism | Federal taxes |
|---|---|---|---|---|---|---|---|---|---|---|---|
| 85 | Fred M. Vinson | 1946 | 1953 | Chief Justice | 27.0% | 45.3% | 26.2% | 34.1% | 59.9% | 51.5% | 74.5% |
| 86 | Tom C. Clark | 1949 | 1967 | Associate Justice | 32.1% | 53.5% | 37.1% | 61.9% | 72.5% | 51.3% | 74.8% |
| 87 | Sherman Minton | 1949 | 1956 | Associate Justice | 23.1% | 36.2% | 27.0% | 55.9% | 62.0% | 53.3% | 75.6% |
| 88 | Earl Warren | 1953 | 1969 | Chief Justice | 73.3% | 81.0% | 83.5% | 70.2% | 81.3% | 72.1% | 80.0% |
| 89 | John Marshall Harlan II | 1955 | 1971 | Associate Justice | 37.8% | 42.0% | 44.2% | 53.8% | 36.7% | 50.0% | 70.6% |
| 90 | William J. Brennan Jr. | 1956 | 1990 | Associate Justice | 76.2% | 82.5% | 84.5% | 65.8% | 69.8% | 66.3% | 70.3% |
| 91 | Charles Evans Whittaker | 1957 | 1962 | Associate Justice | 39.8% | 44.2% | 36.5% | 40.5% | 33.6% | 52.4% | 63.2% |
| 92 | Potter Stewart | 1958 | 1981 | Associate Justice | 44.9% | 48.4% | 63.0% | 57.3% | 45.0% | 56.5% | 66.4% |
| 93 | Byron White | 1962 | 1993 | Associate Justice | 32.9% | 55.2% | 39.2% | 62.6% | 59.3% | 66.9% | 84.7% |
| 94 | Arthur Goldberg | 1962 | 1965 | Associate Justice | 75.0% | 98.0% | 96.2% | 61.1% | 63.2% | 53.3% | 77.3% |
| 95 | Abe Fortas | 1965 | 1969 | Associate Justice | 81.5% | 82.1% | 79.5% | 60.0% | 72.2% | 64.3% | 46.7% |
| 96 | Thurgood Marshall | 1967 | 1991 | Associate Justice | 80.1% | 84.5% | 83.4% | 68.9% | 63.0% | 68.6% | 74.2% |
| 97 | Warren E. Burger | 1969 | 1986 | Chief Justice | 19.0% | 37.4% | 30.9% | 43.3% | 45.0% | 66.7% | 72.1% |
| 98 | Harry Blackmun | 1970 | 1994 | Associate Justice | 42.3% | 62.1% | 56.2% | 61.8% | 55.0% | 67.4% | 74.4% |
| 99 | Lewis F. Powell Jr. | 1972 | 1987 | Associate Justice | 28.4% | 40.3% | 46.1% | 51.1% | 45.6% | 59.0% | 56.1% |
| 100 | William Rehnquist[b] | 1972 | 1986 | Associate Justice | 14.1% | 24.1% | 18.1% | 48.9% | 43.5% | 29.1% | 62.5% |
| 101 | John Paul Stevens | 1975 | 2010 | Associate Justice | 66.9% | 64.3% | 66.9% | 63.9% | 56.2% | 56.9% | 59.4% |
| 102 | Sandra Day O'Connor | 1981 | 2006 | Associate Justice | 26.4% | 45.4% | 41.8% | 42.7% | 46.5% | 48.3% | 58.9% |
| 100 | William Rehnquist[c] | 1986 | 2005 | Chief Justice | 19.6% | 30.6% | 26.1% | 33.3% | 49.4% | 46.1% | 77.8% |
| 103 | Antonin Scalia | 1986 | 2016 | Associate Justice | 27.4% | 30.6% | 30.5% | 33.8% | 46.2% | 52.0% | 69.7% |
| 104 | Anthony Kennedy | 1988 | 2018 | Associate Justice | 33.3% | 44.0% | 46.0% | 39.7% | 44.6% | 56.3% | 81.0% |
| 105 | David Souter | 1990 | 2009 | Associate Justice | 57.2% | 69.3% | 70.8% | 58.8% | 54.2% | 64.8% | 70.7% |
| 106 | Clarence Thomas | 1991 | - | Associate Justice | 22.4% | 25.0% | 32.2% | 30.8% | 46.2% | 47.4% | 58.7% |
| 107 | Ruth Bader Ginsburg | 1993 | 2020 | Associate Justice | 62.3% | 70.0% | 69.4% | 72.2% | 56.6% | 60.6% | 80.6% |
| 108 | Stephen Breyer | 1994 | - | Associate Justice | 55.6% | 69.7% | 55.8% | 77.1% | 50.0% | 67.7% | 79.4% |
| 109 | John Roberts | 2005 | - | Chief Justice | 31.1% | 42.4% | 50.0% | 41.2% | 44.5% | 73.2% | 90.9% |
| 110 | Samuel Alito | 2006 | - | Associate Justice | 18.6% | 38.8% | 39.0% | 31.3% | 42.4% | 68.4% | 81.8% |
| 111 | Sonia Sotomayor | 2009 | - | Associate Justice | 66.9% | 70.7% | 67.7% | 61.5% | 50.0% | 63.0% | 100.0% |
| 112 | Elena Kagan | 2010 | - | Associate Justice | 62.5% | 71.9% | 68.0% | 66.7% | 50.0% | 75.0% | 80.0% |
| 113 | Neil Gorsuch[d] | 2017 | - | Associate Justice | 0.0% | 50.0% | 100.0% | No cases | 33.3% | No cases | No cases |
| 114 | Brett Kavanaugh | 2018 | - | Associate Justice | |||||||
| 115 | Amy Coney Barrett | 2020 | - | Associate Justice |
- ^ To sort, click on the arrow in the header. To sort by multiple columns, click on the first column's sort arrow, then shift-click on subsequent columns' sort arrows.
- ^ William Rehnquist's terms as Associate Justice and Chief Justice are listed separately.
- ^ William Rehnquist's terms as Associate Justice and Chief Justice are listed separately.
- ^ Percentages for Neil Gorsuch may be misleading since he had participated in only a few cases through 2017.
See also[]
- Supreme Court of the United States
- Segal–Cover score
- Judicial appointment history for United States federal courts § Supreme Court
- Judicial Common Space
- Judicial discretion
- Judicial activism
- Judicial restraint
References[]
- ^ Segal, Jeffrey A.; Spaeth, Harold J. (2002). The Supreme Court and the Attitudinal Model Revisited. Cambridge: Cambridge University Press. ISBN 978-0521783514.
- ^
Epstein, Lee; Martin, Andrew D. (2012). "Is the Roberts Court Especially Activist? A Study of Invalidating (and Upholding) Federal, State, and Local Laws" (PDF). Emory Law Journal. 61: 737–758. Archived from the original (PDF) on 2012-10-09. Retrieved 2012-12-10.
…for Justices appointed since 1952, Epstein & Landes’s findings parallel ours: the vast majority were opportunistic restraintists (activists), willing to uphold laws that were consistent with their policy preferences and strike those that were not.
- ^ Zorn and Caldeira provide a good overview of these methods and their limitations: Zorn, Christopher; Caldeira, Gregory A. (5 February 2008). "Measuring Supreme Court Ideology". CiteSeerX 10.1.1.536.3992. Retrieved 23 September 2020. Cite journal requires
|journal=(help) - ^ Bonica and Sen also provide a good overview and add more recent efforts: Bonica, Adam; Sen, Maya (Winter 2021). "Estimating Judicial Ideology". Journal of Economic Perspectives. 35 (1): 97–118. Retrieved 8 February 2021.
- ^ For example:
- Segal, Jeffrey A.; Cover, Albert D. (June 1989). "Ideological Values and the Votes of U.S. Supreme Court Justices" (PDF). American Political Science Review. 83 (2): 557–565. doi:10.2307/1962405. JSTOR 1962405. Segal and Cover found (p. 561) a strong correlation (0.80) between justices' perceived ideological perspectives on civil liberties and civil rights issues as attributed to them in elite newspaper editorials written just before their confirmation (their Segal–Cover score) and their later votes in the study period 1953–1988.
- Epstein, Lee; Walker, Thomas G.; Dixon, William J. (November 1989). "The Supreme Court and Criminal Justice Disputes: A Neo-Institutional Perspective" (PDF). American Journal of Political Science. 33 (4): 825–841. doi:10.2307/2111111. JSTOR 2111111. Archived from the original (PDF) on 2010-06-21. Retrieved 2012-12-10. Epstein, Walker, and Dixon found they could explain and predict rulings in criminal justice cases (in the study period 1946–1986) using a simple model with four inputs: the political party affiliation of the majority of justices, the political party affiliation of the current president (representing the current political climate), the Supreme Court rulings in criminal justice cases in the previous year, and the percent of criminal cases the Court decides to hear in the current year (how much interest they take in the issue). In this analysis, the political party affiliation of the majority of justices provided about one-fourth of the predictive power.
- Pinello, Daniel R. (1999). "Linking Party to Judicial Ideology in American Courts: A Meta-Analysis". The Justice System Journal. 20 (3): 219–254. Pinello conducted a meta-analysis of 84 studies of American courts covering 222,789 cases and found that political party affiliation was a dependable indicator of rulings: Democratic judges voted in favor of liberal solutions more often than Republican judges did, especially in federal courts (the U.S. Supreme Court, U.S. Courts of Appeal, and U.S. District Courts).
- Bonica, Adam; Chilton, Adam S.; Goldin, Jacob; Rozema, Kyle; Sen, Maya (2017). "Measuring judicial ideology using law clerk hiring". American Law and Economics Review. 19 (1): 129–161. doi:10.1093/aler/ahw013. hdl:10.1093/aler/ahw012. Retrieved 8 February 2021. Bonica et al. utilized the ideology of the law clerks hired by federal judges (as estimated by the law clerks' political donations) to estimate the ideology of the judges themselves.
- ^
Some examples:
- Grofman, Bernard; Brazill, Timothy J. (2002). "Identifying the median justice on the Supreme Court through multidimensional scaling: Analysis of 'natural courts' 1953–1991" (PDF). Public Choice. 112: 55–79. doi:10.1023/A:1015601614637. S2CID 17435544. Grofman and Brazill performed multidimensional scaling (MDS) using SYSTAT 5.0 of the entire range of cases considered by the Supreme Court, 1953–1991. Analyzing terms with an unchanging membership ("natural courts") and a complete bench of nine members (3,363 cases), they found that a one-dimensional scale provided a satisfactory explanation of votes and that the degree of unidimensionality generally rose over the years. "On average, over the 15 courts, the mean r2 values are 0.86 for a one dimensional metric MDS solution, and 0.97 for a two dimensional metric MDS solution."
- Poole, Keith (10 July 2003). "The Unidimensional Supreme Court". Retrieved 27 November 2012.
The bottom line is that the current Court is basically unidimensional.
Poole used various statistical measures to show that a unidimensional scale provides a good measure of the Rehnquist Court during the 8-year period 1995–2002.
- ^ Martin, Andrew D.; Quinn, Kevin M. (2007). "Assessing Preference Change on the US Supreme Court" (PDF). The Journal of Law, Economics, & Organization. 23 (2): 365–385. doi:10.1093/jleo/ewm028. hdl:2027.42/116217.
- ^ Epstein, Lee; Martin, Andrew D.; Quinn, Kevin M.; Segal, Jeffrey A. (2007). "Ideological Drift among Supreme Court Justices: Who, When, and How Important?" (PDF). Northwestern University Law Review. 101 (4): 1483–1503.
- ^ a b Ruger, Theodore W. (2005). "Justice Harry Blackmun and the Phenomenon of Judicial Preference Change" (PDF). Missouri Law Review. 70: 1209. Archived from the original (PDF) on 2010-06-01. Retrieved 2012-12-10.
- ^ Martin, Andrew D.; Quinn, Kevin M. (2002). "Dynamic Ideal Point Estimation via Markov Chain Monte Carlo for the U.S. Supreme Court, 1953–1999" (PDF). Political Analysis. 10 (2): 134–153. doi:10.1093/pan/10.2.134.
- ^
Martin, Andrew D.; Quinn, Kevin M. (2 May 2001). "The Dimensions of Supreme Court Decision Making: Again Revisiting The Judicial Mind". CiteSeerX 10.1.1.24.1490. Cite journal requires
|journal=(help) - ^ Martin, Andrew D.; Quinn, Kevin M.; Epstein, Lee (2005). "The Median Justice on the United States Supreme Court". North Carolina Law Review. 83: 1275–1322.
- ^ Jackman provides a simple description of this kind of statistical analysis: Jackman, Simon (2011). "Statistical Inference, Classical and Bayesian". In Badie, Bertrand; Berg-Schlosser, Dirk; Morlino, Leonardo (eds.). International Encyclopedia of Political Science. doi:10.4135/9781412959636.n585. ISBN 9781412959636. Archived from the original on 2013-11-12.
- ^ Martin, Andrew; Quinn, Kevin. "Martin–Quinn scores: measures".
- ^ a b Silver, Nate (29 March 2012). "Supreme Court May Be Most Conservative in Modern History". FiveThirtyEight. In his FiveThirtyEight blog, Silver graphed the Martin–Quinn data to show the movement of the median, most conservative, and most liberal justices over time.
- ^ Black, Duncan (February 1948). "On the rationale of group decision-making". Journal of Political Economy. 56 (1): 23–34. doi:10.1086/256633. JSTOR 1825026. S2CID 153953456.
- ^ a b Bailey, Michael A. (August 2012). "Measuring Court Preferences, 1950–2011: Agendas, Polarity and Heterogeneity" (PDF). Retrieved 20 November 2012.
- ^ Bailey, Michael A.; Maltzman, Forrest (2011). The constrained court: law, politics, and the decisions justices make. Princeton: Princeton University Press. ISBN 978-0691151052.
- ^ Clinton, Joshua; Jackman, Simon; Rivers, Douglas (May 2004). "The Statistical Analysis of Roll Call Data" (PDF). American Political Science Review. 98 (2): 355. CiteSeerX 10.1.1.186.3440. doi:10.1017/S0003055404001194. S2CID 7487820.
- ^ Epstein, Lee; Martin, Andrew D.; Segal, Jeffrey A.; Westerland, Chad (May 2007). "The Judicial Common Space" (PDF). Journal of Law, Economics, and Organization. 23 (2): 303–325. doi:10.1093/jleo/ewm024. hdl:10.1093/jleo/ewm024. Archived from the original (PDF) on 2010-10-08. Retrieved 2012-12-10.
The [NOMINATE] Common Spaces scores are bounded below by −1 and above by 1, whereas the Martin–Quinn scores are theoretically unbounded (currently, they range from about –6 [Justice Douglas] to 4 [Justice Thomas]).
- ^ Bailey, Michael A. (July 2007). "Comparable Preference Estimates across Time and Institutions for the Court, Congress, and Presidency" (PDF). American Journal of Political Science. 51 (3): 433–448. doi:10.1111/j.1540-5907.2007.00260.x.
- ^ "Bailey dataset". Retrieved 22 November 2012.
- ^ Ho, Daniel E.; Quinn, Kevin M. (June 2010). "How Not to Lie with Judicial Votes: Misconceptions, Measurement, and Models" (PDF). California Law Review. 98 (3): 813–876. Archived from the original (PDF) on 2010-12-09. Retrieved 2012-12-10.
- ^ Carroll, Royce; Lewis, Jeffrey B.; Lo, James; Poole, Keith T.; Rosenthal, Howard (November 2009). "Comparing NOMINATE and IDEAL: Points of Difference and Monte Carlo Tests" (PDF). Legislative Studies Quarterly. 34 (4): 555–591. doi:10.3162/036298009789869727. Archived from the original (PDF) on 2013-03-30. Retrieved 2012-12-10.
- ^ "Supreme Court Procedures". United States Courts. Retrieved December 8, 2020.
- ^
"Thee Supreme Court at Work: The Term and Caseload". United States Supreme Court. Retrieved September 12, 2021.
Plenary review, with oral arguments by attorneys, is currently granted in about 80 of those cases each Term, and the Court typically disposes of about 100 or more cases without plenary review.
- ^ Farnsworth, Ward (September 2007). "The Use and Limits of Martin–Quinn Scores to Assess Supreme Court Justices, with Special Attention to the Problem of Ideological Drift". Northwestern University Law Review. 101 (4): 1891–1903. SSRN 1000986.
- ^ McGuire, Kevin T.; Vanberg, Georg; Smith Jr., Charles E.; Caldeira, Gregory A. (October 2009). "Measuring Policy Content on the U.S. Supreme Court" (PDF). The Journal of Politics. 71 (4): 1305–1321. doi:10.1017/s0022381609990107. S2CID 54045434.
- ^ Hurley, Lawrence; Chung, Andrew; Allen, Jonathan (23 March 2021). "The 'shadow docket': How the U.S. Supreme Court quietly dispatches key rulings". Reuters.
- ^ Liptak, Adam (24 July 2010). "Court Under Roberts Is Most Conservative in Decades". New York Times.
- ^
Epstein, Lee; Landes, William M.; Posner, Richard A. (2013). "How Business Fares in the Supreme Court" (PDF). Minnesota Law Review. 97: 1431–1472.
We find that five of the ten Justices who, over the span of our study (the 1946 through 2011 Terms), have been the most favorable to business are currently serving, with two of them ranking at the very top among the thirty-six Justices in our study.
- ^ Roche, Darragh (5 October 2021). "Brett Kavanaugh Is Supreme Court's Ideological Median as New Term Begins". Newsweek.
- ^ Epstein, Lee; Walker, Thomas G.; Staudt, Nancy; Hendrickson, Scott; Roberts, Jason (November 1, 2017). "The U.S. Supreme Court Justices Database". Retrieved November 2, 2017.
External links[]
- Questioning Supreme Court Nominees About Their Views on Legal or Constitutional Issues: A Recurring Issue, CRS Report for Congress
- Martin-Quinn Scores
- Supreme Court of the United States