Jarud Banner
Jarud Banner
扎鲁特旗 • ᠵᠠᠷᠤᠳᠬᠣᠰᠢᠭᠤ | |
|---|---|
Banner | |
 | |
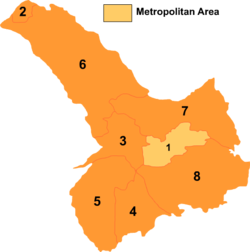 Tongliao divisions: Jarud Banner is 6 on this map | |
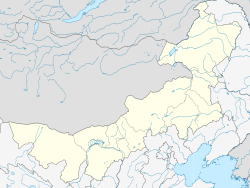 Jarud Location in Inner Mongolia | |
| Coordinates: 44°33′N 120°55′E / 44.550°N 120.917°ECoordinates: 44°33′N 120°55′E / 44.550°N 120.917°E | |
| Country | People's Republic of China |
| Region | Inner Mongolia |
| Prefecture-level city | Tongliao |
| Area | |
| • Total | 16,490 km2 (6,370 sq mi) |
| Elevation | 264 m (866 ft) |
| Population (2020)[1] | |
| • Total | 251,806 |
| • Density | 15/km2 (40/sq mi) |
| Time zone | UTC+8 (China Standard) |
| Jarud Banner | |||||||
|---|---|---|---|---|---|---|---|
| Chinese name | |||||||
| Simplified Chinese | 扎鲁特旗 | ||||||
| Traditional Chinese | 扎魯特旗 | ||||||
| |||||||
| Mongolian name | |||||||
| Mongolian Cyrillic | Жаруд қосиу | ||||||
| Mongolian script | ᠵ��ᠷᠤᠳᠬᠣᠰᠢᠭᠤ | ||||||
| |||||||
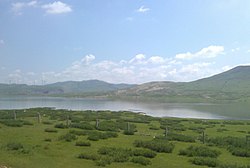
Jarud Banner (Mongolian: ᠵᠠᠷᠤᠳ ᠬᠣᠰᠢᠭᠤ; Chinese: 扎鲁特旗) is a banner of eastern Inner Mongolia, People's Republic of China. It is under the administration of Tongliao City, 150 kilometres (93 mi), and the China National Highway 304 passes through the area.
Climate[]
Jarud Banner has a monsoon-influenced, continental semi-arid climate (Köppen BSk), with very cold and dry winters, hot, somewhat humid summers, and strong winds, especially in spring. The monthly 24-hour average temperature ranges from −12.2 °C (10.0 °F) in January to 24.1 °C (75.4 °F) in July, with the annual mean at 7.06 °C (44.7 °F). The annual precipitation is 362 millimetres (14.3 in), with more than half of it falling in July and August alone. There are 2,883 hours of bright sunshine annually, with each of the winter months having over two-thirds of the possible total, and this percentage falling to 54 in July.
| Climate data for Jarud Banner (1981−2010 normals) | |||||||||||||
|---|---|---|---|---|---|---|---|---|---|---|---|---|---|
| Month | Jan | Feb | Mar | Apr | May | Jun | Jul | Aug | Sep | Oct | Nov | Dec | Year |
| Average high °C (°F) | −6.3 (20.7) |
−1.5 (29.3) |
5.9 (42.6) |
16.2 (61.2) |
23.6 (74.5) |
28.0 (82.4) |
29.4 (84.9) |
28.5 (83.3) |
23.2 (73.8) |
14.7 (58.5) |
3.2 (37.8) |
−4.4 (24.1) |
13.4 (56.1) |
| Daily mean °C (°F) | −12.2 (10.0) |
−8.1 (17.4) |
−0.9 (30.4) |
9.3 (48.7) |
17.0 (62.6) |
21.9 (71.4) |
24.1 (75.4) |
22.6 (72.7) |
16.2 (61.2) |
7.7 (45.9) |
−2.9 (26.8) |
−10.0 (14.0) |
7.1 (44.7) |
| Average low °C (°F) | −16.5 (2.3) |
−13.2 (8.2) |
−6.7 (19.9) |
2.7 (36.9) |
10.2 (50.4) |
16.0 (60.8) |
19.1 (66.4) |
17.3 (63.1) |
10.2 (50.4) |
2.0 (35.6) |
−7.6 (18.3) |
−14.2 (6.4) |
1.6 (34.9) |
| Average precipitation mm (inches) | 0.8 (0.03) |
0.7 (0.03) |
3.8 (0.15) |
12.5 (0.49) |
27.0 (1.06) |
68.7 (2.70) |
123.2 (4.85) |
79.6 (3.13) |
29.1 (1.15) |
12.1 (0.48) |
3.2 (0.13) |
1.3 (0.05) |
362.0 (14.25) |
| Average precipitation days (≥ 0.1 mm) | 1.3 | 1.3 | 2.5 | 3.3 | 6.2 | 12.2 | 12.7 | 10.7 | 6.6 | 3.8 | 2.0 | 1.6 | 64.2 |
| Average relative humidity (%) | 44 | 39 | 36 | 34 | 39 | 55 | 67 | 65 | 55 | 46 | 45 | 46 | 48 |
| Mean monthly sunshine hours | 205.1 | 213.7 | 263.2 | 260.5 | 282.2 | 262.1 | 253.3 | 262.2 | 254.0 | 240.3 | 198.4 | 187.9 | 2,882.9 |
| Percent possible sunshine | 72 | 73 | 72 | 65 | 62 | 57 | 54 | 61 | 68 | 71 | 69 | 69 | 65 |
| Source: China Meteorological Administration (precipitation days and sunshine 1971–2000)[2][3] | |||||||||||||

References[]
- www.xzqh.org (in Chinese)
- ^ Inner Mongolia: Prefectures, Cities, Districts and Counties
- ^ 中国气象数据网 - WeatherBk Data (in Chinese (China)). China Meteorological Administration. Retrieved 2020-04-15.
- ^ 中国地面国际交换站气候标准值月值数据集(1971-2000年). China Meteorological Administration. Archived from the original on 2013-09-21. Retrieved 2010-05-25.
External links[]
This Inner Mongolia location article is a stub. You can help Wikipedia by . |
- County-level divisions of Inner Mongolia
- Inner Mongolia geography stubs