Urad Middle Banner
Urad Middle Banner
乌拉特中旗 • ᠤᠷᠠᠳ ᠤᠨᠳᠤᠮᠳᠠᠳᠤᠬᠣᠰᠢᠭᠤ | |
|---|---|
Banner | |
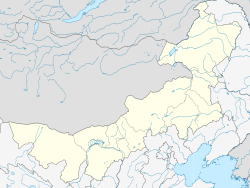 Urad Middle Banner Location in Inner Mongolia | |
| Coordinates: 41°34′N 108°32′E / 41.567°N 108.533°ECoordinates: 41°34′N 108°32′E / 41.567°N 108.533°E | |
| Country | People's Republic of China |
| Region | Inner Mongolia |
| Prefecture-level city | Bayannur |
| Time zone | UTC+8 (China Standard) |

Urad Middle Banner (Mongolian: ᠤᠷᠠᠳ ᠤᠨ ᠳᠤᠮᠳᠠᠳᠤ ᠬᠣᠰᠢᠭᠤ Урад-ун Думдаду Қосиу Urad-un Dumdadu Qosiɣu; simplified Chinese: 乌拉特中旗; traditional Chinese: 烏拉特中旗; pinyin: Wūlātè Zhōng Qí) is a banner of the Inner Mongolia Autonomous Region, People's Republic of China. It is located in the west of the region, and administratively is part of Bayan Nur City. It has a total area of 22,606 square kilometres (8,728 sq mi) and in 2004 had a population of 140,000. Its seat is located in the town of (海流图镇).
Climate[]
Urad Middle Banner has a monsoon-influenced, continental semi-arid climate (Köppen BSk), barely avoiding arid designation, with very cold and dry winters, hot, somewhat humid summers, and strong winds, especially in spring. The monthly 24-hour average temperature ranges from −13.3 °C (8.1 °F) in January to 22.9 °C (73.2 °F) in July, with the annual mean at 5.75 °C (42.3 °F). The annual precipitation is 199 mm (7.8 in), with more than half of it falling in July and August alone. With monthly percent possible sunshine ranging from 65% in July to 76% in October, sunshine is abundant year-round, and there are 3,164 hours of bright sunshine annually.
| hideClimate data for Urad Middle Banner (1981−2010 normals) | |||||||||||||
|---|---|---|---|---|---|---|---|---|---|---|---|---|---|
| Month | Jan | Feb | Mar | Apr | May | Jun | Jul | Aug | Sep | Oct | Nov | Dec | Year |
| Average high °C (°F) | −6.5 (20.3) |
−1.5 (29.3) |
6.0 (42.8) |
15.0 (59.0) |
22.2 (72.0) |
27.0 (80.6) |
28.9 (84.0) |
26.3 (79.3) |
21.1 (70.0) |
13.2 (55.8) |
2.9 (37.2) |
−4.9 (23.2) |
12.5 (54.5) |
| Daily mean °C (°F) | −13.3 (8.1) |
−8.7 (16.3) |
−1.2 (29.8) |
7.9 (46.2) |
15.4 (59.7) |
20.7 (69.3) |
22.9 (73.2) |
20.4 (68.7) |
14.4 (57.9) |
5.9 (42.6) |
−4.1 (24.6) |
−11.3 (11.7) |
5.8 (42.3) |
| Average low °C (°F) | −18.5 (−1.3) |
−14.3 (6.3) |
−7.4 (18.7) |
0.8 (33.4) |
8.2 (46.8) |
13.7 (56.7) |
16.7 (62.1) |
14.5 (58.1) |
8.2 (46.8) |
0.0 (32.0) |
−9.1 (15.6) |
−16.2 (2.8) |
−0.3 (31.5) |
| Average precipitation mm (inches) | 1.6 (0.06) |
1.7 (0.07) |
4.0 (0.16) |
3.9 (0.15) |
14.8 (0.58) |
25.8 (1.02) |
51.3 (2.02) |
56.0 (2.20) |
28.2 (1.11) |
8.0 (0.31) |
2.0 (0.08) |
1.5 (0.06) |
198.8 (7.82) |
| Average precipitation days (≥ 0.1 mm) | 2.0 | 1.9 | 2.3 | 2.1 | 3.8 | 6.2 | 10.6 | 9.9 | 5.2 | 3.1 | 1.7 | 1.7 | 50.5 |
| Average relative humidity (%) | 60 | 51 | 40 | 31 | 33 | 39 | 50 | 56 | 52 | 50 | 56 | 60 | 48 |
| Mean monthly sunshine hours | 220.7 | 217.6 | 264.6 | 282.1 | 321.6 | 311.9 | 298.5 | 286.0 | 276.7 | 258.6 | 217.7 | 208.1 | 3,164.1 |
| Percent possible sunshine | 75 | 73 | 72 | 71 | 72 | 69 | 65 | 67 | 74 | 76 | 74 | 73 | 71 |
| Source: China Meteorological Administration (precipitation days and sunshine 1971–2000)[1][2] | |||||||||||||
References[]
- ^ 中国气象数据网 - WeatherBk Data (in Chinese). China Meteorological Administration. Retrieved 2020-04-15.
- ^ 中国地面国际交换站气候标准值月值数据集(1971-2000年). China Meteorological Administration. Archived from the original on 2013-09-21. Retrieved 2010-05-25.
External links[]
| show Authority control |
|---|
This Inner Mongolia location article is a stub. You can help Wikipedia by . |
- County-level divisions of Inner Mongolia
- Inner Mongolia geography stubs