List of countries by greenhouse gas emissions per person
This article needs to be updated. (June 2019) |
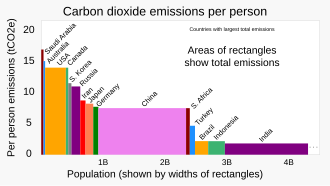
This is a list of countries by total greenhouse gas (GHG) emissions per capita by year. It provides data based on a production-based accounting of emissions of carbon dioxide, methane, nitrous oxide, perfluorocarbon, hydrofluorocarbon, and sulfur hexafluoride (meaning emissions within the territory of the given country), compiled by the World Resources Institute and divided by the population estimate by the United Nations (for July 1) of the same year.[2] The emissions data do not include land-use change and forestry (LULUCF), nor emissions from the consumption of imported goods. All countries which are party to the Paris Agreement report their greenhouse gas inventories at least biennially from 2024.[3] World total emissions are estimated to be about 50 billion tonnes a year (including LULUCF),[4] which divided by world population is about 6 and a half tonnes per person per year. In order to meet the Paris Agreement goal of under 1.5 C rise by 2050, average per person emissions would need to be around 2 tonnes per person by 2030.[5] It has been suggested that countries over the averaged be carbon taxed and the funds raised given to countries under the average.[6]
List of countries by production-based emissions[]
| Country | 1990 | 1995 | 2000 | 2005 | 2010 | 2013 | 2018 [7] |
|---|---|---|---|---|---|---|---|
| 37.32 | 73.13 | 65.64 | 76.41 | 62.47 | 54.41 | 27.31 | |
| 48.33 | 46.38 | 46.49 | 44.83 | 46.88 | 46.84 | 38.75 | |
| 16.4 | 16.8 | 19.05 | 24.3 | 28.65 | 45.6 | ||
| 29.75 | 37.3 | 41.58 | 52.1 | 39.13 | 36.82 | 35.89 | |
| 29.05 | 29.84 | 28.55 | 28.11 | 28.29 | 28.15 | 4.08 | |
| 22.0 | 22.92 | 27.97 | 25.84 | 27.82 | 27.43 | 17.04 | |
| 27.27 | 29.64 | 29.19 | 27.78 | 24.4 | 25.4 | 31.19 | |
| 28.06 | 27.28 | 30.84 | 27.6 | 25.39 | 25.06 | 24.63 | |
| 40.13 | 38.81 | 34.89 | 32.13 | 23.73 | 24.59 | 27.33 | |
| 21.16 | 19.43 | 18.66 | 20.91 | 22.63 | 21.47 | 15.43 | |
| 20.22 | 20.69 | 22.12 | 21.94 | 20.47 | 20.94 | 19.56 | |
| 13.39 | 14.51 | 18.13 | 19.44 | 20.93 | 21.38 | ||
| 21.14 | 27.86 | 23.82 | 20.72 | 16.81 | |||
| 23.23 | 23.26 | 23.86 | 22.92 | 20.97 | 19.9 | 18.44 | |
| 0.52 | 2.7 | 13.89 | 25.83 | 21.33 | 19.15 | 14.72 | |
| 12.31 | 11.22 | 12.42 | 16.4 | 19.11 | 19.15 | 16.48 | |
| 16.29 | 16.63 | 17.28 | 17.82 | 18.39 | 18.89 | 21.14 | |
| 11.49 | 13.29 | 13.39 | 14.67 | 17.69 | 18.26 | 18.94 | |
| 14.43 | 10.37 | 13.73 | 17.28 | 18.23 | 15.00 | ||
| 14.4 | 13.53 | 15.77 | 17.3 | 17.66 | 14.07 | ||
| 6.98 | 6.74 | 10.3 | 11.64 | 17.03 | 17.93 | ||
| 19.01 | 18.27 | 18.4 | 18.77 | 16.86 | 16.62 | 16.60 | |
| 14.45 | 13.92 | 14.7 | 15.21 | 15.31 | 17.60 | ||
| 12.81 | 11.28 | 11.48 | 10.13 | 10.91 | 13.47 | 16.60 | |
| 6.77 | 9.45 | 10.77 | 11.24 | 13.02 | 13.43 | 13.93 | |
| 15.04 | 15.76 | 17.39 | 16.77 | 13.57 | 12.65 | 13.37 | |
| 11.01 | 10.38 | 11.69 | 12.17 | 12.64 | 12.53 | 13.22 | |
| 14.75 | 14.62 | 13.9 | 13.26 | 14.2 | 11.69 | 9.88 | |
| 9.4 | 10.9 | 11.82 | 11.34 | 11.74 | 11.46 | 9.89 | |
| 14.05 | 13.76 | 13.47 | 12.39 | 11.42 | 11.56 | ||
| 6.31 | 6.53 | 7.08 | 8.77 | 10.69 | 11.22 | 12.59 | |
| 13.18 | 13.93 | 12.85 | 12.4 | 12.01 | 11.09 | 10.37 | |
| 14.59 | 12.9 | 11.89 | 11.36 | 11.03 | 11.0 | 9.72 | |
| 12.21 | 11.98 | 11.8 | 11.28 | 10.78 | 10.94 | 11.93 | |
| 9.4 | 9.91 | 10.04 | 10.16 | 9.54 | 10.55 | 9.38 | |
| 5.72 | 6.79 | 7.91 | 9.33 | 9.94 | 10.2 | 9.73 | |
| 13.26 | 12.16 | 11.44 | 10.17 | 9.52 | |||
| 8.38 | 9.15 | 8.83 | 9.6 | 9.71 | 9.98 | 10.48 | |
| 10.28 | 11.82 | 11.88 | 9.48 | 9.84 | 9.88 | 11.82 | |
| 8.23 | 7.84 | 8.63 | 9.66 | 9.55 | 9.29 | ||
| 8.18 | 7.77 | 7.71 | 9.23 | 9.5 | 9.49 | 8.88 | |
| 11.23 | 10.7 | 9.4 | 9.6 | 9.82 | 9.43 | 10.26 | |
| 12.97 | 14.24 | 12.48 | 11.59 | 11.03 | 9.38 | 7.92 | |
| 4.46 | 5.9 | 6.69 | 8.08 | 9.03 | 9.26 | 10.13 | |
| 10.69 | 10.59 | 10.48 | 10.41 | 10.09 | 9.18 | 8.91 | |
| 9.71 | 9.55 | 9.59 | 10.79 | 9.85 | 9.15 | 8.48 | |
| 8.31 | 6.69 | 6.32 | 6.03 | 7.58 | 9.04 | 6.85 | |
| 12.06 | 10.27 | 11.15 | 10.43 | 8.9 | 8.96 | 9.74 | |
| 8.62 | 8.73 | 8.7 | 8.85 | 9.08 | 8.85 | 8.10 | |
| 8.92 | 9.01 | 9.67 | 9.3 | 8.72 | 8.28 | ||
| 2.69 | 3.39 | 3.49 | 5.5 | 7.43 | 8.49 | 8.87 | |
| 12.9 | 11.63 | 11.0 | 10.53 | 9.03 | 8.45 | 6.80 | |
| 8.92 | 6.48 | 7.87 | 6.42 | 7.52 | 8.4 | 5.61 | |
| 10.41 | 8.25 | 8.54 | 8.13 | 8.33 | 6.15 | ||
| 4.77 | 5.47 | 5.95 | 6.57 | 7.01 | 8.04 | 7.03 | |
| 1.81 | 5.34 | 6.0 | 7.36 | 7.89 | 8.18 | ||
| 7.12 | 7.25 | 7.49 | 7.73 | 7.77 | 7.86 | 8.22 | |
| 9.39 | 9.71 | 10.53 | 10.73 | 9.0 | 7.68 | 7.90 | |
| 2.94 | 3.38 | 7.86 | 8.45 | 8.28 | 7.65 | 8.02 | |
| 11.24 | 8.28 | 7.16 | 8.03 | 8.0 | 7.55 | 7.59 | |
| 7.9 | 8.4 | 7.85 | 7.55 | 7.52 | 7.15 | ||
| 9.36 | 8.48 | 8.68 | 7.9 | 7.43 | 7.33 | ||
| 7.5 | 6.79 | 6.61 | 6.36 | 7.43 | 8.07 | ||
| 8.6 | 8.69 | 9.17 | 9.49 | 8.02 | 7.05 | 6.61 | |
| 7.0 | 7.01 | 6.24 | 7.77 | 7.48 | 7.04 | 4.20 | |
| 8.65 | 8.39 | 8.37 | 8.13 | 7.34 | 6.9 | 6.32 | |
| 6.54 | 6.62 | 8.96 | |||||
| 6.91 | 7.54 | 8.99 | 9.62 | 7.27 | 6.57 | 6.99 | |
| 6.07 | 5.55 | 6.51 | 6.65 | 6.45 | 6.73 | ||
| 5.74 | 6.85 | 6.5 | 6.5 | 6.5 | 6.44 | 4.05 | |
| 7.77 | 7.33 | 7.16 | 7.21 | 6.77 | 6.34 | 5.41 | |
| World | 5.62 | 5.4 | 5.41 | 5.85 | 6.15 | 6.27 | |
| 5.43 | 4.66 | 5.47 | 6.29 | 6.2 | 6.05 | ||
| 7.27 | 7.75 | 5.67 | 5.63 | 5.9 | 6.18 | 6.57 | |
| 9.12 | 8.45 | 8.25 | 5.58 | 9.32 | 6.07 | 7.15 | |
| 3.91 | 4.02 | 4.57 | 5.33 | 5.81 | 6.07 | ||
| 6.59 | 7.3 | 8.19 | 8.53 | 7.92 | 6.06 | 7.23 | |
| 4.29 | 4.43 | 4.2 | 5.06 | 6.32 | 5.99 | 2.59 | |
| 5.0 | 5.1 | 5.74 | 6.28 | 6.19 | 5.98 | 5.39 | |
| 3.53 | 3.95 | 4.47 | 4.69 | 5.35 | 5.93 | 5.85 | |
| 5.67 | 6.61 | 7.6 | 7.76 | 6.14 | 5.89 | 6.50 | |
| 5.25 | 5.71 | 5.08 | 4.92 | 5.56 | 5.81 | 7.07 | |
| 8.5 | 7.05 | 7.02 | 7.28 | 6.36 | 5.78 | 6.23 | |
| 4.64 | 5.41 | 6.4 | 5.99 | 5.49 | 5.52 | ||
| 10.12 | 7.31 | 5.84 | 6.29 | 5.67 | 5.46 | 5.60 | |
| 2.69 | 3.8 | 3.85 | 4.67 | 5.1 | 5.42 | 6.01 | |
| 5.81 | 5.4 | 6.11 | |||||
| 3.71 | 4.18 | 4.8 | 4.66 | 5.18 | 5.39 | 6.10 | |
| 3.29 | 4.37 | 4.4 | 4.11 | 4.79 | 5.35 | 6.46 | |
| 7.9 | 8.18 | 7.53 | 7.0 | 6.25 | 5.29 | 4.56 | |
| 2.75 | 5.39 | 5.53 | 4.86 | 5.5 | 5.11 | 5.02 | |
| 3.73 | 3.92 | 4.12 | 4.43 | 4.73 | 5.03 | 4.93 | |
| 3.5 | 3.42 | 3.75 | 4.04 | 4.58 | 4.88 | 5.18 | |
| 5.17 | 5.41 | 5.31 | 5.05 | 5.21 | 4.87 | 4.87 | |
| 14.23 | 11.02 | 8.86 | 6.71 | 4.94 | 4.53 | 6.03 | |
| 2.02 | 2.29 | 3.31 | 3.71 | 4.33 | 4.52 | 5.33 | |
| 3.04 | 3.49 | 3.38 | 3.78 | 4.38 | 4.5 | 5.01 | |
| 2.93 | 3.37 | 3.37 | 3.83 | 4.24 | 4.45 | 4.31 | |
| 3.83 | 3.9 | 4.38 | 4.57 | 4.27 | 2.62 | ||
| 5.02 | 3.43 | 3.89 | 3.54 | 4.33 | 4.08 | 3.69 | |
| 6.99 | 6.67 | 4.77 | 4.21 | 3.74 | 4.05 | 3.52 | |
| 4.08 | 4.13 | 4.14 | 4.13 | 4.26 | 4.02 | 1.22 | |
| 2.4 | 2.56 | 2.62 | 2.85 | 3.07 | 3.92 | 3.36 | |
| 6.43 | 5.91 | 5.4 | 4.77 | 4.13 | 3.85 | 3.53 | |
| 2.85 | 3.12 | 2.89 | 3.21 | 3.6 | 3.72 | 3.84 | |
| 4.87 | 4.85 | 3.82 | 4.28 | 3.66 | 3.66 | 3.60 | |
| 2.88 | 2.78 | 2.61 | 2.91 | 3.66 | 4.54 | ||
| 3.4 | 3.5 | 3.27 | 3.21 | 3.3 | 3.37 | 3.71 | |
| 2.44 | 2.66 | 3.01 | 3.13 | 3.45 | 3.33 | 3.39 | |
| 3.67 | 4.04 | 4.4 | 4.53 | 3.17 | 3.33 | 3.41 | |
| 4.35 | 4.64 | 4.46 | 4.87 | 4.31 | 3.32 | 2.74 | |
| 5.18 | 4.2 | 3.36 | 3.58 | 3.31 | 3.31 | 2.34 | |
| 2.36 | 2.52 | 2.89 | 3.04 | 3.36 | 3.24 | 3.55 | |
| 2.12 | 2.63 | 3.21 | 3.03 | 3.28 | 3.23 | 3.68 | |
| 2.38 | 2.53 | 2.32 | 2.9 | 3.04 | 3.13 | 3.20 | |
| 2.15 | 2.13 | 2.41 | 2.96 | 3.18 | 3.03 | 3.34 | |
| 1.94 | 1.82 | 2.3 | 2.46 | 2.97 | 3.17 | ||
| 2.1 | 2.43 | 2.55 | 2.69 | 2.87 | 2.95 | 3.62 | |
| 2.68 | 2.77 | 2.52 | 2.71 | 2.83 | 2.93 | 3.16 | |
| 0.84 | 1.19 | 1.83 | 2.1 | 2.69 | 2.86 | 4.61 | |
| 3.56 | 2.15 | 2.36 | 2.68 | 2.83 | 2.85 | 3.52 | |
| 3.08 | 2.81 | 3.06 | 2.94 | 2.9 | 2.84 | 3.20 | |
| 1.94 | 2.07 | 2.27 | 2.34 | 2.77 | 2.82 | 3.01 | |
| 4.12 | 2.6 | 2.91 | 3.02 | 2.82 | 4.87 | ||
| 1.03 | 1.25 | 1.63 | 2.16 | 2.8 | 2.81 | 3.94 | |
| 2.06 | 1.85 | 1.97 | 2.16 | 2.73 | 2.87 | ||
| 2.17 | 2.13 | 2.28 | 2.39 | 2.54 | 2.67 | 3.52 | |
| 3.04 | 3.07 | 2.85 | 2.5 | 2.79 | 2.66 | 2.96 | |
| 7.68 | 4.92 | 4.12 | 4.27 | 3.83 | 2.55 | 1.64 | |
| 1.41 | 1.9 | 2.09 | 2.64 | 2.65 | 2.53 | 3.32 | |
| 2.12 | 2.15 | 2.13 | 2.49 | 2.36 | 2.44 | 2.34 | |
| 2.26 | 1.94 | 2.33 | 2.43 | 2.42 | 2.37 | 2.95 | |
| 1.53 | 1.64 | 1.76 | 2.07 | 2.23 | 2.33 | 2.62 | |
| 1.37 | 1.48 | 1.59 | 1.72 | 2.11 | 2.28 | 2.50 | |
| 2.31 | 2.07 | 2.63 | 2.39 | 2.3 | 2.25 | 2.75 | |
| 2.6 | 2.37 | 2.43 | 2.87 | 2.28 | 2.17 | 5.21 | |
| 2.09 | 2.68 | 2.31 | 2.22 | 2.08 | 2.16 | 2.67 | |
| 1.18 | 1.11 | 1.16 | 1.74 | 2.04 | 1.99 | 2.77 | |
| 1.37 | 1.52 | 1.6 | 1.78 | 1.84 | 1.92 | 2.23 | |
| 1.36 | 1.68 | 1.72 | 1.55 | 1.46 | 1.91 | 3.27 | |
| 1.3 | 1.38 | 1.64 | 1.8 | 1.79 | 1.87 | 1.63 | |
| 1.28 | 1.68 | 1.76 | 2.02 | 1.96 | 1.85 | 1.92 | |
| 3.25 | 2.62 | 2.47 | 1.93 | 1.81 | 1.82 | 2.17 | |
| 1.75 | 1.69 | 1.84 | 1.88 | 1.89 | 1.8 | 1.89 | |
| 1.74 | 1.67 | 1.49 | 1.63 | 1.83 | 1.8 | 2.31 | |
| 1.43 | 1.54 | 1.6 | 1.72 | 1.8 | 1.8 | 2.03 | |
| 1.81 | 1.67 | 1.72 | 1.79 | 1.82 | 1.77 | 2.29 | |
| 2.11 | 2.04 | 1.94 | 2.05 | 1.79 | 1.77 | 1.59 | |
| 1.44 | 1.41 | 1.44 | 1.54 | 1.66 | 1.77 | 4.14 | |
| 1.45 | 1.68 | 1.73 | 1.67 | 1.65 | 1.74 | 2.18 | |
| 1.23 | 1.41 | 1.63 | 1.71 | 1.64 | 1.71 | 2.17 | |
| 1.52 | 1.52 | 1.51 | 1.49 | 1.51 | 1.55 | 1.55 | |
| 1.64 | 1.56 | 1.39 | 1.55 | 1.46 | 1.54 | 1.87 | |
| 1.07 | 1.69 | 1.41 | 1.88 | 1.67 | 1.46 | 1.79 | |
| 1.91 | 1.84 | 1.44 | 1.44 | 1.37 | 1.46 | 0.91 | |
| 1.35 | 1.4 | 1.43 | 1.44 | 1.49 | 1.44 | 2.01 | |
| 1.96 | 1.95 | 1.63 | 1.44 | 1.44 | |||
| 1.25 | 1.19 | 1.21 | 1.27 | 1.41 | 1.43 | 2.33 | |
| 1.24 | 0.84 | 0.82 | 0.76 | 1.06 | 1.4 | 2.66 | |
| 0.99 | 1.0 | 1.15 | 1.33 | 1.41 | 1.39 | 0.76 | |
| 1.25 | 1.29 | 1.27 | 1.42 | 1.38 | 1.38 | 1.56 | |
| 1.54 | 1.29 | 1.14 | 1.13 | 1.41 | 1.34 | 1.53 | |
| 1.11 | 1.09 | 1.16 | 1.31 | 1.3 | 1.58 | ||
| 1.07 | 1.11 | 1.16 | 1.12 | 1.22 | 1.29 | 1.82 | |
| 1.28 | 0.98 | 1.04 | 1.1 | 1.25 | 1.67 | ||
| 1.01 | 0.88 | 1.01 | 1.16 | 1.21 | 1.22 | 1.51 | |
| 1.22 | 1.18 | 1.13 | 1.04 | 1.18 | 1.17 | 1.49 | |
| 0.85 | 0.85 | 0.96 | 1.03 | 1.04 | 1.17 | 1.49 | |
| 0.63 | 0.73 | 0.79 | 1.1 | 1.43 | 1.15 | 1.52 | |
| 1.99 | 1.77 | 1.53 | 1.36 | 1.24 | 1.15 | 1.16 | |
| 1.38 | 1.23 | 1.03 | 1.09 | 1.09 | 1.04 | 1.19 | |
| 0.8 | 0.81 | 0.81 | 0.85 | 1.0 | 1.04 | 1.23 | |
| 0.83 | 0.85 | 0.77 | 0.9 | 0.96 | 1.01 | 0.92 | |
| 1.11 | 1.03 | 0.99 | 0.98 | 1.01 | 0.99 | 1.44 | |
| 0.89 | 0.87 | 0.73 | 0.8 | 0.83 | 0.97 | 0.94 | |
| 0.93 | 0.75 | 0.94 | 0.97 | 1.01 | 0.93 | 1.07 | |
| 0.82 | 0.78 | 0.73 | 0.8 | 0.92 | 0.89 | 1.28 | |
| 0.49 | 0.47 | 0.59 | 0.88 | 0.81 | 0.77 | 0.95 | |
| 0.66 | 0.65 | 0.76 | 0.81 | 0.78 | 0.77 | 0.89 | |
| 0.95 | 0.64 | 0.58 | 0.53 | 0.59 | 0.61 | 1.01 | |
| 0.52 | 0.63 | 0.54 | 0.56 | 0.61 | 0.6 | 0.50 | |
| 0.98 | 0.78 | 0.65 | 0.65 | 0.59 | 0.55 | 0.70 | |
| 0.56 | 0.53 | 0.52 | 0.47 | 0.5 | 0.54 | 0.71 | |
| 0.57 | 0.45 | 0.41 | 0.48 | 0.48 | 0.5 | 1.91 | |
| 0.42 | 0.42 | 0.35 | 0.26 | 0.29 | 0.32 | 0.49 |
See also[]
- List of countries by carbon dioxide emissions per capita
- List of countries by greenhouse gas emissions
- List of countries by carbon dioxide emissions
- Asian brown cloud
- Climate change
- Land use, land-use change, and forestry (LULUCF)
References[]
- ^ ● "Territorial (MtCO2)". GlobalCarbonAtlas.org. Retrieved 30 December 2021.
{{cite web}}: CS1 maint: url-status (link) (choose "Chart view"; use download link)
● Data for 2020 is also presented in Popovich, Nadja; Plumer, Brad (November 12, 2021). "Who Has The Most Historical Responsibility for Climate Change?". The New York Times. Archived from the original on December 29, 2021.
● Source for country populations: "List of the populations of the world's countries, dependencies, and territories". britannica.com. Encyclopedia Britannica.{{cite web}}: CS1 maint: url-status (link) - ^ "Climate Analysis Indicators Tool (CAIT) Version 2.0. (Washington, DC: World Resources Institute, 2014)". World Resources Institute. Archived from the original on 2016-05-26. Retrieved 2017-06-12.
- ^ "NDC reporting: making the Paris Agreement Transparency Framework work". Energy Post. 2019-07-19.
- ^ "Greenhouse gas emissions". Our World in Data. Retrieved 2021-02-03.
- ^ Bhalla, Jag (2021-02-24). "What's your "fair share" of carbon emissions? You're probably blowing way past it". Vox. Retrieved 2021-03-17.
- ^ Russell-Jones, Robin (2020-09-07). "Will the Cop26 climate conference be a national embarrassment for Britain?". the Guardian.
- ^ "Historical GHG Emissions". Climate Watch, GHG Emissions per Capita Excluding LUCF, CAIT Data. Retrieved 2021-06-16.
- Greenhouse gas emissions
- Lists of countries
- Lists of countries by per capita values
- Climate change-related lists
- International rankings
- Environment-related lists by country
- Greenhouse gas emissions by country