List of the busiest airports in Europe
This is a list of the 100 busiest airports in Europe, ranked by total passengers per year, including both terminal and transit passengers. Data is for 2020 and is sourced individually for each airport and from a variety of sources, normally the national aviation authority statistics, or those of the airport operator. The tables also show the percentage change in total passengers for each airport over the last year. Lists of the rankings for 2019, 2018, 2017, 2016, 2015, 2014, 2013, 2012, 2011 and 2010 are also presented.
2020 numbers are significantly reduced due to the ongoing Covid-19 pandemic, which has caused a significant reduction in passenger numbers and aircraft movements.
Evolution in graph[]
See source Wikidata query and sources.
2020[]
| Rank 2020 |
Rank change 2019–2020 |
Country | Airport | City served | Passengers | Change 2019–2020 | ||
|---|---|---|---|---|---|---|---|---|
| 2020 | 2019 | % | Numbers | |||||
| 1 | Istanbul Airport | Istanbul | 23,409,132[1] | 52,009,220[1] | ||||
| 2 | Charles de Gaulle Airport | Paris | 22,257,469[2] | 76,150,007[3] | ||||
| 3 | Heathrow Airport | London | 22,109,726[4] | 80,100,311[4] | ||||
| 4 | Amsterdam Airport Schiphol | Amsterdam | 20,887,174[5] | 71,707,144[6] | ||||
| 5 | Sheremetyevo International Airport | Moscow | 19,566,402[7] | 49,438,469[7] | ||||
| 6 | Frankfurt am Main Airport | Frankfurt | 18,768,601[8] | 70,560,987[9] | ||||
| 7 | Adolfo Suárez Madrid–Barajas Airport | Madrid | 17,112,389[10] | 61,734,944[10] | ||||
| 8 | Domodedovo International Airport | Moscow | 16,389,427[7] | 28,252,337[7] | ||||
| 9 | Josep Tarradellas Barcelona–El Prat Airport | Barcelona | 12,739,259[10] | 52,688,455[10] | ||||
| 10 | Vnukovo International Airport | Moscow | 12,565,241[7] | 24,001,521[7] | ||||
| 11 | Munich Airport | Munich | 11,120,224[11] | 47,959,885[12] | ||||
| 12 | Pulkovo Airport | Saint Petersburg | 10,944,421[8] | 19,581,262[7] | ||||
| 13 | Orly Airport | Paris | 10,797,105[2] | 31,853,049[13] | ||||
| 14 | Gatwick Airport | London | 10,171,867[4] | 46,081,327[4] | ||||
| 15 | Leonardo da Vinci–Fiumicino Airport | Rome | 9,830,957[14] | 43,532,573[15] | ||||
| 16 | Lisbon Airport | Lisbon | 9,268,000[16] | 31,172,774[17] | ||||
| 17 | Oslo Airport, Gardermoen | Oslo | 9,021,729[18] | 28,592,619[18] | ||||
| 18 | Zurich Airport | Zürich | 8,341,047 | 31,507,692[19] | ||||
| 19 | Athens International Airport | Athens | 8,078,383[20] | 25,573,993[21] | ||||
| 20 | Vienna International Airport | Vienna | 7,812,938[22] | 31,662,189[23] | ||||
| 21 | London Stansted Airport | London | 7,543,779[24] | 28,124,292[4] | ||||
| 22 | Copenhagen Airport | Copenhagen | 7,525,441[25] | 30,256,703[25] | ||||
| 23 | Dublin Airport | Dublin | 7,400,000[26] | 32,676,251[27] | ||||
| 24 | Malpensa Airport | Milan | 7,241,766[28] | 28,846,299[15] | ||||
| 25 | Manchester Airport | Manchester | 7,037,036[24] | 29,367,477[4] | ||||
| 26 | Brussels Airport | Brussels | 6,743,395[29] | 26,360,003[30] | ||||
| 27 | Düsseldorf Airport | Düsseldorf | 6,569,728[31] | 24,283,967[9] | ||||
| 28 | Stockholm Arlanda Airport | Stockholm | 6,535,776[32] | 25,642,623[33] | ||||
| 29 | Palma de Mallorca Airport | Palma de Mallorca | 6,108,486[10] | 29,721,142[10] | ||||
| 30 | Berlin Tegel Airport | Berlin | 5,867,601[31] | 24,227,570[9] | ||||
| 31 | Geneva Airport | Geneva | 5,600,914[34] | 17,926,629[35] | ||||
| 32 | Warsaw Chopin Airport | Warsaw | 5,482,000[36] | 18,869,302[37] | ||||
| 33 | Luton Airport | London | 5,472,826[38] | 17,999,969[39] | ||||
| 34 | Málaga Airport | Málaga | 5,161,636[10] | 19,858,656[10] | ||||
| 35 | Boryspil International Airport | Kyiv | 5,157,848[40] | 15,260,281[41] | ||||
| 36 | Helsinki Airport | Helsinki | 5,053,134[42] | 21,861,082[42] | ||||
| 37 | Simferopol International Airport | Simferopol | 4,630,000[43] | 5,146,095[44] | ||||
| 38 | Nice Côte d'Azur Airport | Nice | 4,580,459[45] | 14,485,423[46] | ||||
| 39 | Hamburg Airport | Hamburg | 4,557,372[31] | 17,234,229 | ||||
| 40 | Henri Coandă International Airport | Bucharest | 4,456,000[47] | 14,707,376[48] | ||||
| 41 | Porto Airport | Porto | 4,436,000[16] | 13,105,339[49] | ||||
| 42 | Budapest Ferenc Liszt International Airport | Budapest | 3,859,379[50] | 16,173,399[50] | ||||
| 43 | Orio al Serio International Airport | Milan/Bergamo | 3,833,063[15] | 13,857,257[15] | ||||
| 44 | Alicante Airport | Alicante | 3,739,499[10] | 15,048,240[10] | ||||
| 45 | Václav Havel Airport Prague | Prague | 3,665,871[51] | 17,804,900[52] | ||||
| 46 | Catania-Fontanarossa Airport | Catania | 3,654,457[15] | 10,223,113[15] | ||||
| 47 | Lyon–Saint-Exupéry Airport | Lyon | 3,553,918[45] | 11,037,410[53] | ||||
| 48 | Edinburgh Airport | Edinburgh | 3,473,652[4] | 14,733,966 | ||||
| 49 | Marseille Provence Airport | Marseille | 3,359,149[45] | 10,151,743 | ||||
| 50 | Berlin Schönefeld Airport | Berlin | 3,223,603[31] | 11,417,435[9] | ||||
| 51 | Stuttgart Airport | Stuttgart | 3,213,695[54] | 12,732,670[55] | ||||
| 52 | Toulouse–Blagnac Airport | Toulouse | 3,130,847[45] | 9,620,224 | ||||
| 53 | Cologne Bonn Airport | Cologne/Bonn | 3,076,587[31] | 12,369,000[56] | ||||
| 54 | Krasnodar International Airport[note 2] | Krasnodar | 3,076,447 | 4,631,000[57] | ||||
| 55 | Sofia Airport | Sofia | 2,937,846[58] | 7,107,096[59] | ||||
| 56 | Birmingham Airport | Birmingham | 2,865,845[4] | 12,454,642[4] | ||||
| 57 | Venice Marco Polo Airport | Venice | 2,799,688[15] | 11,561,594[15] | ||||
| 58 | Naples Airport | Naples | 2,779,946[15] | 10,860,068[15] | ||||
| 59 | Bergen Airport, Flesland | Bergen | 2,711,276[18] | 6,505,827[18] | ||||
| 60 | Falcone–Borsellino Airport | Palermo | 2,701,519[15] | 7,018,087[15] | ||||
| 61 | EuroAirport Basel Mulhouse Freiburg | Basel/Mulhouse/Freiburg im Breisgau | 2,598,980[60] | 9,090,125[60] | ||||
| 62 | Kraków John Paul II International Airport | Kraków | 2,592,972[61] | 8,410,817[62] | ||||
| 63 | Brussels South Charleroi Airport | Charleroi | 2,558,046[63] | 8,221,450[64] | ||||
| 64 | Bologna Guglielmo Marconi Airport | Bologna | 2,506,258[15] | 9,405,920[15] | ||||
| 65 | Valencia Airport | Valencia | 2,487,496[10] | 8,539,579[10] | ||||
| 66 | Heraklion International Airport | Heraklion | 2,378,145[65] | 7,839,255[66] | ||||
| 67 | New | Ufa International Airport | Ufa | 2,368,689[67] | 3,556,533[7] | |||
| 68 | Nantes Atlantique Airport | Nantes | 2,327,718[45] | 7,227,411 | ||||
| 69 | Thessaloniki Airport "Macedonia" | Thessaloniki | 2,317,336[68] | 6,895,331[66] | ||||
| 70 | Seville Airport | Seville | 2,315,610[10] | 7,544,357[10] | ||||
| 71 | Linate Airport | Milan | 2,274,202[15] | 6,570,984[15] | ||||
| 72 | Bordeaux–Mérignac Airport | Bordeaux | 2,253,000[69] | 7,703,135[2] | ||||
| 73 | Faro Airport | Faro | 2,208,000[16] | 9,008,991[49] | ||||
| 74 | Bristol Airport | Bristol | 2,192,725[4] | 8,696,653[4] | ||||
| 75 | New | Kazan International Airport | Kazan | 2,171,603[70] | 3,470,742[7] | |||
| 76 | New | Khrabrovo Airport | Kaliningrad | 2,117,931[71] | 2,370,157[7] | |||
| 77 | Eindhoven Airport | Eindhoven | 2,112,785[72] | 6,237,755[72] | ||||
| 78 | Ibiza Airport | Ibiza | 2,110,348[10] | 8,155,626[10] | ||||
| 79 | New | Platov International Airport | Rostov-on-Don | 2,086,000 | 3,060,000[7] | |||
| 80 | Riga International Airport | Riga | 2,010,000[73] | 7,798,382[74] | ||||
| 81 | Glasgow Airport | Glasgow | 1,944,981[4] | 9,652,216[4] | ||||
| 82 | Minsk National Airport | Minsk | 1,939,192[75] | 5,101,766[76] | ||||
| 83 | Belgrade Nikola Tesla Airport | Belgrade | 1,904,025[77] | 6,159,000[77] | ||||
| 84 | New | Anapa Airport[note 2] | Anapa | 1,813,347[7] | 1,641,000[7] | |||
| 85 | Trondheim Airport Værnes | Trondheim | 1,802,826[18] | 4,381,921[18] | ||||
| 86 | New | Mineralnye Vody Airport[note 2] | Mineralnye Vody | 1,797,989[7] | 2,526,419[7] | |||
| 87 | Cagliari Elmas Airport | Cagliari | 1,767,890[15] | 4,747,806[15] | ||||
| 88 | Malta International Airport | Malta | 1,748,050[22] | 7,310,289[22] | ||||
| 89 | Belfast International Airport | Belfast | 1,746,951[4] | 6,268,953[4] | ||||
| 90 | Gdańsk Lech Wałęsa Airport | Gdańsk | 1,711,281[78] | 5,376,120[79] | ||||
| 91 | Bari Airport | Bari | 1,703,130[15] | 5,545,588[15] | ||||
| 92 | Bilbao Airport | Bilbao | 1,690,011[10] | 5,905,820[10] | ||||
| 93 | New | Kurumoch International Airport | Samara | 1,675,034[7] | 2,999,000[7] | |||
| 94 | New | Stavanger Airport Sola | Stavanger | 1,674,900[18] | 4,309,723[18] | |||
| 95 | Ciampino Airport | Rome | 1,621,159[15] | 5,879,496[15] | ||||
| 96 | Göteborg Landvetter Airport | Gothenburg | 1,576,787[80] | 6,807,976[80] | ||||
| 97 | Rhodes International Airport | Rhodes | 1,551,123[81] | 5,542,223[66] | ||||
| 98 | Langenhagen Airport | Hanover | 1,452,361[9] | 6,324,634[9] | ||||
| 99 | Luxembourg Airport | Luxembourg City | 1,446,354[82] | 4,416,038[citation needed] | ||||
| 100 | Katowice Airport | Katowice | 1,445,781[83] | 4,843,889[83] | ||||
2019[]
| Rank 2019 |
Rank change 2018–2019 |
Country | Airport | City served | Passengers | Change 2018–2019 | ||
|---|---|---|---|---|---|---|---|---|
| 2019 | 2018 | % | Numbers | |||||
| 1 | Heathrow Airport | London | 80,886,589[4] | 80,100,311[4] | ||||
| 2 | Charles de Gaulle Airport | Paris | 76,150,007[84] | 72,229,723[13] | ||||
| 3 | Amsterdam Airport Schiphol | Amsterdam | 71,707,144[6] | 71,053,157[6] | ||||
| 4 | Frankfurt am Main Airport | Frankfurt | 70,556,072[85] | 69,510,269[86] | ||||
| 5 | Adolfo Suárez Madrid–Barajas Airport | Madrid | 61,734,037[10] | 57,891,340[10] | ||||
| 6 | Josep Tarradellas Barcelona–El Prat Airport | Barcelona | 52,686,314[10] | 50,172,457[10] | ||||
| 7 | New | Istanbul Airport | Istanbul | 52,009,220[1] | 95,205[1] | |||
| 8 | Sheremetyevo International Airport | Moscow | 49,438,545[87] | 45,348,150[7] | ||||
| 9 | Munich Airport | Munich | 47,941,348[88] | 46,253,620[9] | ||||
| 10 | Gatwick Airport | London | 46,574,786[4] | 46,081,327[4] | ||||
| 11 | Leonardo da Vinci–Fiumicino Airport | Rome | 43,532,573[15] | 42,995,119[15] | ||||
| 12 | Dublin Airport | Dublin | 32,907,673[89] | 31,497,526[90] | ||||
| 13 | Orly Airport | Paris | 31,853,049[2] | 33,120,685[13] | ||||
| 14 | Vienna International Airport | Vienna | 31,662,189[22] | 27,037,292[22] | ||||
| 15 | Zurich Airport | Zürich | 31,507,692[91] | 31,113,488[92] | ||||
| 16 | Lisbon Airport | Lisbon | 31,173,000[93] | 29,031,268[49] | ||||
| 17 | Copenhagen Airport | Copenhagen | 30,256,703[25] | 30,298,531[25] | ||||
| 18 | Palma de Mallorca Airport | Palma de Mallorca | 29,721,123[10] | 29,081,787[10] | ||||
| 19 | Manchester Airport | Manchester | 29,367,477[4] | 28,254,970[4] | ||||
| 20 | Malpensa Airport | Milan | 28,846,299[15] | 24,725,490[15] | ||||
| 21 | Oslo Airport, Gardermoen | Oslo | 28,592,619[18] | 28,518,584[18] | ||||
| 22 | Domodedovo International Airport | Moscow | 28,252,337[7] | 29,403,704[7] | ||||
| 23 | London Stansted Airport | London | 28,124,292[4] | 27,995,121[4] | ||||
| 24 | Brussels Airport | Brussels | 26,360,003[30] | 25,675,939[30] | ||||
| 25 | Stockholm Arlanda Airport | Stockholm | 25,642,703[80] | 26,845,419[80] | ||||
| 26 | Athens International Airport | Athens | 25,574,030[94] | 24,135,736[94] | ||||
| 27 | Düsseldorf Airport | Düsseldorf | 25,507,566[9] | 24,283,967[9] | ||||
| 28 | Berlin Tegel Airport | Berlin | 24,227,570[9] | 22,000,430[9] | ||||
| 29 | Vnukovo International Airport | Moscow | 24,001,521[7] | 21,478,486[7] | ||||
| 30 | Helsinki Airport | Helsinki | 21,861,082[95] | 20,848,838[95] | ||||
| 31 | Málaga Airport | Málaga | 19,856,299[10] | 19,021,704[10] | ||||
| 32 | Pulkovo Airport | Saint Petersburg | 19,581,262[7] | 18,123,064[7] | ||||
| 33 | Warsaw Chopin Airport | Warsaw | 18,869,302[96] | 17,755,543[37] | ||||
| 34 | Luton Airport | London | 18,213,901[4] | 16,766,552[4] | ||||
| 35 | Geneva Airport | Geneva | 17,926,629[97] | 17,677,035[97] | ||||
| 36 | Václav Havel Airport Prague | Prague | 17,804,900[98] | 16,797,006[98] | ||||
| 37 | Hamburg Airport | Hamburg | 17,308,773[9] | 17,234,229[9] | ||||
| 38 | Budapest Ferenc Liszt International Airport | Budapest | 16,173,399[99] | 14,867,491[99] | ||||
| 39 | Istanbul Atatürk Airport[100] | Istanbul | 16,112,804[1] | 68,346,784[1] | ||||
| 40 | Boryspil International Airport | Kyiv | 15,260,281[101][41] | 12,602,933[41] | ||||
| 41 | Alicante Airport | Alicante | 15,047,840[10] | 13,981,320[10] | ||||
| 42 | Edinburgh Airport | Edinburgh | 14,733,966[4] | 14,291,811[4] | ||||
| 43 | Henri Coandă International Airport | Bucharest | 14,707,376[102] | 13,820,428[103] | ||||
| 44 | Nice Côte d'Azur Airport | Nice | 14,485,423[2] | 13,850,561[46] | ||||
| 45 | Orio al Serio International Airport | Milan/Bergamo | 13,857,257[15] | 12,938,572[15] | ||||
| 46 | Porto Airport | Porto | 13,107,000 | 11,939,562[49] | ||||
| 47 | Stuttgart Airport | Stuttgart | 12,721,441[9] | 11,798,090[9] | ||||
| 48 | Birmingham Airport | Birmingham | 12,646,456[4] | 12,454,642[4] | ||||
| 49 | Cologne Bonn Airport | Cologne/Bonn | 12,368,519[9] | 12,957,828[9] | ||||
| 50 | Lyon–Saint-Exupéry Airport | Lyon | 11,739,600[2] | 11,037,410[53] | ||||
| 51 | Venice Marco Polo Airport | Venice | 11,561,594[15] | 11,184,608[15] | ||||
| 52 | Berlin Schönefeld Airport | Berlin | 11,417,435[9] | 12,725,937[9] | ||||
| 53 | Naples Airport | Naples | 10,860,068[15] | 9,932,029[15] | ||||
| 54 | Catania-Fontanarossa Airport | Catania | 10,223,113 | 9,933,318[15] | ||||
| 55 | Marseille Provence Airport | Marseille | 10,151,743[2] | 9,390,371[citation needed] | ||||
| 56 | Toulouse–Blagnac Airport | Toulouse | 9,620,224[2] | 9,630,308[104] | ||||
| 57 | Bologna Guglielmo Marconi Airport | Bologna | 9,405,920[15] | 8,506,658[15] | ||||
| 58 | EuroAirport Basel Mulhouse Freiburg | Basel/Mulhouse/Freiburg im Breisgau | 9,094,821[2] | 8,573,705[60] | ||||
| 59 | Faro Airport | Faro | 9,009,000[citation needed] | 8,685,571[49] | ||||
| 60 | Bristol Airport | Bristol | 8,959,679[4] | 8,696,653[4] | ||||
| 61 | Glasgow Airport | Glasgow | 8,843,214[4] | 9,652,216[4] | ||||
| 62 | Valencia Airport | Valencia | 8,539,403[10] | 7,769,867[10] | ||||
| 63 | Kraków John Paul II International Airport | Kraków | 8,410,817[105] | 6,769,369[62] | ||||
| 64 | Brussels South Charleroi Airport | Charleroi | 8,224,450[106] | 8,029,680[107] | ||||
| 65 | Ibiza Airport | Ibiza | 8,155,635[10] | 8,104,316[10] | ||||
| 66 | Heraklion International Airport | Heraklion | 7,839,255 | 7,974,887[66] | ||||
| 67 | Riga International Airport | Riga | 7,798,382[74] | 7,056,099[74] | ||||
| 68 | Bordeaux–Mérignac Airport | Bordeaux | 7,703,135[2] | 6,799,572[citation needed] | ||||
| 69 | Seville Airport | Seville | 7,544,473[10] | 6,380,465[10] | ||||
| 70 | Malta International Airport | Malta | 7,310,289[22] | 6,808,177[22] | ||||
| 71 | Keflavík International Airport | Reykjavík | 7,247,820[108] | 9,804,388[108] | ||||
| 72 | Nantes Atlantique Airport | Nantes | 7,227,411[2] | 6,199,181[citation needed] | ||||
| 73 | Sofia Airport | Sofia | 7,107,096[59] | 6,962,040[59] | ||||
| 74 | Falcone–Borsellino Airport | Palermo | 7,018,087[15] | 6,628,558[15] | ||||
| 75 | Thessaloniki Airport "Macedonia" | Thessaloniki | 6,897,057[68] | 6,689,193[66] | ||||
| 76 | Eindhoven Airport | Eindhoven | 6,780,796[72] | 6,237,755[72] | ||||
| 77 | Göteborg Landvetter Airport | Gothenburg | 6,671,361[80] | 6,807,976[80] | ||||
| 78 | Linate Airport | Milan | 6,570,984[15] | 9,233,475[15] | ||||
| 79 | Bergen Airport, Flesland | Bergen | 6,505,827[18] | 6,306,623[18] | ||||
| 80 | Langenhagen Airport | Hanover | 6,301,366[9] | 6,324,634[9] | ||||
| 81 | Belfast International Airport | Belfast | 6,278,374[4] | 6,268,953[4] | ||||
| 82 | Belgrade Nikola Tesla Airport | Belgrade | 6,159,000[77] | 5,641,105[77] | ||||
| 83 | Bilbao Airport | Bilbao | 5,905,804[10] | 5,469,453[10] | ||||
| 84 | Ciampino Airport | Rome | 5,879,496[15] | 5,839,737[15] | ||||
| 85 | Bari Airport | Bari | 5,545,588[15] | 5,030,760[15] | ||||
| 86 | Rhodes International Airport | Rhodes | 5,542,567[81] | 5,567,748[66] | ||||
| 87 | Galileo Galilei Airport | Pisa | 5,387,558[15] | 5,463,090[15] | ||||
| 88 | Gdańsk Lech Wałęsa Airport | Gdańsk | 5,376,120[79] | 4,980,647[79] | ||||
| 89 | Newcastle Airport | Newcastle upon Tyne | 5,198,952[4] | 5,332,238[4] | ||||
| 90 | Simferopol International Airport | Simferopol | 5,140,000[109] | 5,146,095[7] | ||||
| 91 | London City Airport | London | 5,122,039[4] | 4,820,292[4] | ||||
| 92 | Minsk National Airport | Minsk | 5,101,766[110] | 4,536,618[76] | ||||
| 93 | Vilnius Airport | Vilnius | 5,004,921[111] | 4,922,949[112] | ||||
| 94 | Liverpool John Lennon Airport | Liverpool | 5,000,176[4] | 5,042,312[4] | ||||
| 95 | Katowice Airport | Katowice | 4,843,889[113] | 4,838,149[113] | ||||
| 96 | Cagliari Elmas Airport | Cagliari | 4,747,806[15] | 4,370,014[15] | ||||
| 97 | East Midlands Airport | Derby/Leicester/Nottingham | 4,674,338[4] | 4,873,757[4] | ||||
| 98 | Krasnodar International Airport[note 2] | Krasnodar | 4,630,770[7] | 4,160,053[7] | ||||
| 99 | New | Luxembourg Airport | Luxembourg City | 4,416,038[citation needed] | 4,036,878[citation needed] | |||
| 100 | Trondheim Airport Værnes | Trondheim | 4,381,921[18] | 4,441,791[18] | ||||
2018[]
| Rank 2018 |
Rank change 2017–2018 |
Country | Airport | City served | Passengers 2018 |
Passengers 2017 |
Change % 2017–2018 |
Passengers change 2017–2018 |
|---|---|---|---|---|---|---|---|---|
| 1. | Heathrow Airport | London | 80,124,537[4] | 78,012,825[4] | ||||
| 2. | Charles de Gaulle Airport | Paris | 72,229,723[13] | 69,471,442[13] | ||||
| 3. | Amsterdam Airport Schiphol | Amsterdam | 71,053,157[6] | 68,515,425[6] | ||||
| 4. | Frankfurt am Main Airport | Frankfurt | 69,510,269[86] | 64,500,386[9] | ||||
| 5. | Istanbul Atatürk Airport | Istanbul | 67,981,446[1] | 63,727,448[1] | ||||
| 6. | Adolfo Suárez Madrid–Barajas Airport | Madrid | 57,891,340[10] | 53,402,506[10] | ||||
| 7. | Barcelona–El Prat Josep Tarradellas Airport | Barcelona | 50,172,457[10] | 47,284,500[10] | ||||
| 8. | Munich Airport | Munich | 46,253,623[9] | 44,577,241[9] | ||||
| 9. | Gatwick Airport | London | 46,086,089[4] | 45,556,899[4] | ||||
| 10. | Sheremetyevo International Airport | Moscow | 45,348,150[7] | 39,641,443[7] | ||||
| 11. | Leonardo da Vinci–Fiumicino Airport | Rome | 42,995,119[15] | 40,971,881[15] | ||||
| 12. | Orly Airport | Paris | 33,120,685[13] | 32,042,475[13] | ||||
| 13. | Dublin Airport | Dublin | 31,497,526[90] | 29,582,321[90] | ||||
| 14. | Zurich Airport | Zürich | 31,113,488[114] | 29,396,094[92] | ||||
| 15. | Copenhagen Airport | Copenhagen | 30,298,531[25] | 29,177,833[25] | ||||
| 16. | Domodedovo International Airport | Moscow | 29,403,704[7] | 30,657,854[7] | ||||
| 17. | Palma de Mallorca Airport | Palma de Mallorca | 29,081,787[10] | 27,970,655[10] | ||||
| 18. | Lisbon Airport | Lisbon | 29,031,268[49] | 26,646,079[49] | ||||
| 19. | Oslo Airport | Oslo | 28,518,584[18] | 27,482,486[18] | ||||
| 20. | Manchester Airport | Manchester | 28,292,797[4] | 27,826,054[4] | ||||
| 21. | London Stansted Airport | London | 27,996,116[4] | 25,904,450[4] | ||||
| 22. | Vienna International Airport | Vienna | 27,037,292[22] | 24,392,805[22] | ||||
| 23. | Stockholm Arlanda Airport | Stockholm | 26,845,419[80] | 26,623,606[80] | ||||
| 24. | Brussels Airport | Brussels | 25,675,939[30] | 24,783,911[30] | ||||
| 25. | Malpensa Airport | Milan | 24,725,490[15] | 22,169,167[15] | ||||
| 26. | Düsseldorf Airport | Düsseldorf | 24,283,967[9] | 24,640,564[9] | ||||
| 27. | Athens International Airport | Athens | 24,135,736[94] | 21,737,787[94] | ||||
| 28. | Berlin Tegel Airport | Berlin | 22,000,430[9] | 20,460,688[9] | ||||
| 29. | Vnukovo International Airport | Moscow | 21,478,486[7] | 18,138,865[7] | ||||
| 30. | Helsinki Airport | Helsinki | 20,848,838[95] | 18,892,386[95] | ||||
| 31. | Málaga Airport | Málaga | 19,021,704[10] | 18,628,876[10] | ||||
| 32. | Pulkovo Airport | Saint Petersburg | 18,123,064[7] | 16,125,520[7] | ||||
| 33. | Warsaw Chopin Airport | Warsaw | 17,755,542 | 15,730,330[37] | ||||
| 34. | Geneva Airport | Geneva | 17,677,035[97] | 17,351,816[97] | ||||
| 35. | Hamburg Airport | Hamburg | 17,234,229[9] | 17,622,997[9] | ||||
| 36. | Václav Havel Airport Prague | Prague | 16,797,006[98] | 15,415,001[98] | ||||
| 37. | Luton Airport | London | 16,769,634[4] | 15,990,276[4] | ||||
| 38. | Budapest Ferenc Liszt International Airport | Budapest | 14,867,491[99] | 13,097,239[99] | ||||
| 39. | Edinburgh Airport | Edinburgh | 14,294,305[4] | 13,410,343[4] | ||||
| 40. | Alicante Airport | Alicante | 13,981,320[10] | 13,713,061[10] | ||||
| 41. | Nice Côte d'Azur Airport | Nice | 13,850,561[46] | 13,304,782[46] | ||||
| 42. | Henri Coandă International Airport | Bucharest | 13,820,428 | 12,804,191[103] | ||||
| 43. | Cologne Bonn Airport | Cologne/Bonn | 12,957,828[9] | 12,384,223[9] | ||||
| 44. | Orio al Serio International Airport | Milan/Bergamo | 12,938,572[15] | 12,336,137[15] | ||||
| 45. | Berlin Schönefeld Airport | Berlin | 12,725,937[9] | 12,865,312[9] | ||||
| 46. | Boryspil International Airport | Kyiv | 12,602,933[41] | 10,554,757[115] | ||||
| 47. | Birmingham Airport | Birmingham | 12,457,051[4] | 12,990,303[4] | ||||
| 48. | Porto Airport | Porto | 11,939,562[49] | 10,787,630[49] | ||||
| 49. | Stuttgart Airport | Stuttgart | 11,798,090[9] | 10,962,247[9] | ||||
| 50. | Venice Marco Polo Airport | Venice | 11,184,608[15] | 10,371,380[15] | ||||
| 51. | Lyon–Saint-Exupéry Airport | Lyon | 11,037,410[116] | 10,280,192[citation needed] | ||||
| 52. | Catania-Fontanarossa Airport | Catania | 9,933,318[15] | 9,120,913[15] | ||||
| 53. | Naples Airport | Naples | 9,932,029[15] | 8,577,507[15] | ||||
| 54. | Keflavík International Airport | Reykjavík | 9,804,388[108] | 8,755,352[108] | ||||
| 55. | Glasgow Airport | Glasgow | 9,656,227[4] | 9,897,959[4] | ||||
| 56. | Toulouse–Blagnac Airport | Toulouse | 9,630,308[104] | 9,264,613[104] | ||||
| 57. | Marseille Provence Airport | Marseille | 9,390,371[citation needed] | 9,002,086[citation needed] | ||||
| 58. | Linate Airport | Milan | 9,233,475[15] | 9,548,363[15] | ||||
| 59. | Bristol Airport | Bristol | 8,699,529[4] | 8,239,250[4] | ||||
| 60. | Faro Airport | Faro | 8,685,571[49] | 8,727,132[49] | ||||
| 61. | EuroAirport Basel Mulhouse Freiburg | Basel/Mulhouse/Freiburg im Breisgau | 8,573,705[60] | 7,888,725[60] | ||||
| 62. | Bologna Guglielmo Marconi Airport | Bologna | 8,506,658[15] | 8,198,156[15] | ||||
| 63. | Ibiza Airport | Ibiza | 8,104,316[10] | 7,903,892[10] | ||||
| 64. | Brussels South Charleroi Airport | Charleroi | 8,029,680[107] | 7,698,767[107] | ||||
| 65. | Heraklion International Airport | Heraklion | 7,974,887[66] | 7,336,783[66] | ||||
| 66. | Valencia Airport | Valencia | 7,769,867[10] | 6,745,394[10] | ||||
| 67. | Riga International Airport | Riga | 7,056,099[74] | 6,097,765[74] | ||||
| 68. | Sofia Airport | Sofia | 6,962,040[59] | 6,490,096[59] | ||||
| 69. | Malta International Airport | Malta | 6,808,177[22] | 6,014,548[22] | ||||
| 70. | Göteborg Landvetter Airport | Gothenburg | 6,807,976[80] | 6,751,571[80] | ||||
| 71. | Bordeaux – Mérignac Airport | Bordeaux | 6,799,572[citation needed] | 6,223,414[citation needed] | ||||
| 72. | Kraków John Paul II International Airport | Kraków | 6,769,369[117] | 5,835,189[62] | ||||
| 73. | Falcone–Borsellino Airport | Palermo | 6,628,558[15] | 5,775,274[15] | ||||
| 74. | Thessaloniki Airport "Macedonia" | Thessaloniki | 6,403,396[66] | 6,327,174[66] | ||||
| 75. | Seville Airport | Seville | 6,380,465[10] | 5,108,807[10] | ||||
| 76. | Langenhagen Airport | Hanover | 6,324,634[9] | 5,870,104[9] | ||||
| 77. | Bergen Airport, Flesland | Bergen | 6,306,623[18] | 6,113,452[18] | ||||
| 78. | Belfast International Airport | Belfast | 6,268,960[4] | 5,836,735[4] | ||||
| 79. | Eindhoven Airport | Eindhoven | 6,237,755[72] | 5,701,220[72] | ||||
| 80. | Nantes Atlantique Airport | Nantes | 6,199,181[citation needed] | 5,489,087[citation needed] | ||||
| 81. | Ciampino Airport | Rome | 5,839,737[15] | 5,885,812[15] | ||||
| 82. | Belgrade Nikola Tesla Airport | Belgrade | 5,641,105[77] | 5,343,420[77] | ||||
| 83. | Bilbao Airport | Bilbao | 5,469,453[10] | 4,973,712[10] | ||||
| 84. | Galileo Galilei Airport | Pisa | 5,463,090[15] | 5,233,118[15] | ||||
| 85. | Newcastle Airport | Newcastle upon Tyne | 5,334,095[4] | 5,300,274[4] | ||||
| 86. | Rhodes International Airport | Rhodes | 5,245,810[66] | 5,231,159[66] | ||||
| 87. | Simferopol International Airport | Simferopol | 5,146,095[citation needed] | 5,128,743[7] | ||||
| 88. | Liverpool John Lennon Airport | Liverpool | 5,046,995[4] | 4,901,157[4] | ||||
| 89. | Bari Airport | Bari | 5,030,760[15] | 4,686,016[15] | ||||
| 90. | Gdańsk Lech Wałęsa Airport | Gdańsk | 4,980,647[118] | 4,611,714[119] | ||||
| 91. | New | Vilnius Airport | Vilnius | 4,922,949[112] | 3,761,837[120] | |||
| 92. | East Midlands Airport | Derby/Leicester/Nottingham | 4,873,831[4] | 4,878,781[4] | ||||
| 93. | Katowice Airport | Katowice | 4,838,149[113] | 3,892,941[113] | ||||
| 94. | London City Airport | London | 4,820,292[4] | 4,530,439[4] | ||||
| 95. | Minsk National Airport | Minsk | 4,536,618[121] | 4,114,512[76] | ||||
| 96. | Nuremberg Airport | Nuremberg | 4,466,864[9] | 4,186,961[9] | ||||
| 97. | Trondheim Airport Værnes | Trondheim | 4,441,791[18] | 4,428,897[18] | ||||
| 98. | Cagliari Elmas Airport | Cagliari | 4,370,014[15] | 4,157,612[15] | ||||
| 99. | Stavanger Airport Sola | Stavanger | 4,262,476[18] | 4,178,241[18] | ||||
| 100. | New | Krasnodar International Airport[note 2] | Krasnodar | 4,160,053[7] | 3,494,987[7] |
2017[]
| Rank 2017 |
Rank change 2016–2017 |
Country | Airport | City served | Passengers 2017 |
Passengers 2016 |
Change % 2016–2017 |
Passengers change 2016–2017 |
|---|---|---|---|---|---|---|---|---|
| 1. | Heathrow Airport | London | 78,012,825[4] | 75,711,130[4] | ||||
| 2. | Charles de Gaulle Airport | Paris | 69,471,442[13] | 65,933,145[13] | ||||
| 3. | Amsterdam Airport Schiphol | Amsterdam | 68,515,425[6] | 63,625,664[6] | ||||
| 4. | Frankfurt am Main Airport | Frankfurt | 64,500,386[9] | 60,786,937[9] | ||||
| 5. | Istanbul Atatürk Airport | Istanbul | 63,727,448[1] | 60,415,470[1] | ||||
| 6. | Adolfo Suárez Madrid–Barajas Airport | Madrid | 53,402,506[10] | 50,420,583[10] | ||||
| 7. | Barcelona–El Prat Josep Tarradellas Airport | Barcelona | 47,284,500[10] | 44,154,693[10] | ||||
| 8. | Gatwick Airport | London | 45,556,899[4] | 43,119,628[4] | ||||
| 9. | Munich Airport | Munich | 44,577,241[9] | 42,261,309[9] | ||||
| 10. | Leonardo da Vinci–Fiumicino Airport | Rome | 40,971,881[15] | 41,744,769[15] | ||||
| 11. | Sheremetyevo International Airport | Moscow | 39,641,443[7] | 33,655,605[7] | ||||
| 12. | Orly Airport | Paris | 32,042,475[13] | 31,237,865[13] | ||||
| 13. | Domodedovo International Airport | Moscow | 30,657,854[7] | 28,500,259[7] | ||||
| 14. | Dublin Airport | Dublin | 29,582,321[90] | 27,907,384[90] | ||||
| 15. | Zurich Airport | Zürich | 29,396,094[92] | 27,666,428[92] | ||||
| 16. | Copenhagen Airport | Copenhagen | 29,177,833[25] | 29,043,287[25] | ||||
| 17. | Palma de Mallorca Airport | Palma de Mallorca | 27,970,655[10] | 26,253,882[10] | ||||
| 18. | Manchester Airport | Manchester | 27,773,303[4] | 25,637,054[4] | ||||
| 19. | Oslo Airport | Oslo | 27,482,486[18] | 25,787,691[18] | ||||
| 20. | Lisbon Airport | Lisbon | 26,646,079[49] | 22,449,289[49] | ||||
| 21. | Stockholm Arlanda Airport | Stockholm | 26,623,606[80] | 24,682,466[80] | ||||
| 22. | London Stansted Airport | London | 25,904,450[4] | 24,320,071[4] | ||||
| 23. | Brussels Airport | Brussels | 24,783,911 | 21,818,418 | ||||
| 24. | Düsseldorf Airport | Düsseldorf | 24,640,564[9] | 23,521,919[9] | ||||
| 25. | Vienna International Airport | Vienna | 24,392,805[22] | 23,352,016[22] | ||||
| 26. | Malpensa Airport | Milan | 22,169,167[15] | 19,420,690[15] | ||||
| 27. | Athens International Airport | Athens | 21,737,787[94] | 20,017,530[94] | ||||
| 28. | Berlin Tegel Airport | Berlin | 20,460,688[9] | 21,253,959[9] | ||||
| 29. | Helsinki Airport | Helsinki | 18,892,386[95] | 17,184,681[95] | ||||
| 30. | Málaga Airport | Málaga | 18,628,876[10] | 16,672,776[10] | ||||
| 31. | Vnukovo International Airport | Moscow | 18,138,865[7] | 13,946,688[7] | ||||
| 32. | Hamburg Airport | Hamburg | 17,622,997[9] | 16,224,154[9] | ||||
| 33. | Geneva Airport | Geneva | 17,351,816[97] | 16,532,690[97] | ||||
| 34. | Pulkovo Airport | Saint Petersburg | 16,125,520[7] | 13,265,037[7] | ||||
| 35. | Luton Airport | London | 15,799,219[4] | 14,551,774[4] | ||||
| 36. | Warsaw Chopin Airport | Warsaw | 15,730,330[37] | 12,795,356[37] | ||||
| 37. | Václav Havel Airport Prague | Prague | 15,415,001[98] | 13,074,517[98] | ||||
| 38. | Alicante Airport | Alicante | 13,713,061[10] | 12,344,945[10] | ||||
| 39. | Edinburgh Airport | Edinburgh | 13,410,658[4] | 12,348,425[4] | ||||
| 40. | Nice Côte d'Azur Airport | Nice | 13,304,782[46] | 12,427,427[46] | ||||
| 41. | Budapest Ferenc Liszt International Airport | Budapest | 13,097,239[125] | 11,441,999[99] | ||||
| 42. | Birmingham Airport | Birmingham | 12,990,303[4] | 11,645,334[4] | ||||
| 43. | Berlin Schönefeld Airport | Berlin | 12,865,312[9] | 11,652,922[9] | ||||
| 44. | Henri Coandă International Airport | Bucharest | 12,804,191[103] | 10,982,967[126] | ||||
| 45. | Cologne Bonn Airport | Cologne/Bonn | 12,384,223[9] | 11,910,138[9] | ||||
| 46. | Orio al Serio International Airport | Milan/Bergamo | 12,336,137[15] | 11,159,631[15] | ||||
| 47. | Stuttgart Airport | Stuttgart | 10,962,247[9] | 10,626,430[9] | ||||
| 48. | Porto Airport | Porto | 10,787,630[49] | 9,378,082[49] | ||||
| 49. | Boryspil International Airport | Kyiv | 10,554,757[115] | 8,650,000[89] | ||||
| 50. | Venice Marco Polo Airport | Venice | 10,371,380[15] | 9,624,748[15] | ||||
| 51. | Lyon–Saint-Exupéry Airport | Lyon | 10,280,192[citation needed] | 9,553,250[127] | ||||
| 52. | Glasgow Airport | Glasgow | 9,897,959[4] | 9,346,245[4] | ||||
| 53. | Linate Airport | Milan | 9,548,363[15] | 9,682,264[15] | ||||
| 54. | Toulouse–Blagnac Airport | Toulouse | 9,264,613[104] | 8,081,179[104] | ||||
| 55. | Catania-Fontanarossa Airport | Catania | 9,120,913[15] | 7,914,117[15] | ||||
| 56. | Marseille Provence Airport | Marseille | 9,002,086[citation needed] | 8,475,809[127] | ||||
| 57. | Keflavík International Airport | Reykjavík | 8,755,352[108] | 6,821,358[108] | ||||
| 58. | Faro Airport | Faro | 8,727,132[49] | 7,630,909[49] | ||||
| 59. | Naples Airport | Naples | 8,577,507[15] | 6,775,988[15] | ||||
| 60. | Bristol Airport | Bristol | 8,239,949[4] | 7,610,780[4] | ||||
| 61. | Bologna Guglielmo Marconi Airport | Bologna | 8,198,156[15] | 7,680,992[15] | ||||
| 62. | Ibiza Airport | Ibiza | 7,903,892[10] | 7,416,368[10] | ||||
| 63. | EuroAirport Basel Mulhouse Freiburg | Basel/Mulhouse/Freiburg im Breisgau | 7,888,725[60] | 7,314,269[60] | ||||
| 64. | Brussels South Charleroi Airport | Charleroi | 7,698,767[107] | 7,303,720[107] | ||||
| 65. | Heraklion International Airport | Heraklion | 7,336,783[66] | 6,742,746[66] | ||||
| 66. | Göteborg Landvetter Airport | Gothenburg | 6,751,571[80] | 6,369,396[80] | ||||
| 67. | Valencia Airport | Valencia | 6,745,394[10] | 5,799,104[10] | ||||
| 68. | Sofia Airport | Sofia | 6,490,096[59] | 4,980,387[59] | ||||
| 69. | Thessaloniki Airport "Macedonia" | Thessaloniki | 6,327,174[66] | 5,687,325[66] | ||||
| 70. | Bordeaux – Mérignac Airport | Bordeaux | 6,223,414[citation needed] | 5,779,569[127] | ||||
| 71. | Bergen Airport, Flesland | Bergen | 6,113,452[18] | 5,949,060[18] | ||||
| 72. | Riga International Airport | Riga | 6,097,765[74] | 5,400,243[74] | ||||
| 73. | Malta International Airport | Malta | 6,014,548[22] | 5,080,071[128] | ||||
| 74. | Ciampino Airport | Rome | 5,885,812[15] | 5,395,699[15] | ||||
| 75. | Langenhagen Airport | Hanover | 5,870,104[9] | 5,408,814[9] | ||||
| 76. | Belfast International Airport | Belfast | 5,836,735[4] | 5,147,546[4] | ||||
| 77. | Kraków John Paul II International Airport | Krakow | 5,835,189[62] | 4,983,645[129] | ||||
| 78. | Falcone–Borsellino Airport | Palermo | 5,775,274[15] | 5,325,559[15] | ||||
| 79. | Eindhoven Airport | Eindhoven | 5,701,220[72] | 4,780,197[72] | ||||
| 80. | Nantes Atlantique Airport | Nantes | 5,489,087[citation needed] | 4,778,967[127] | ||||
| 81. | Belgrade Nikola Tesla Airport | Belgrade | 5,343,420[77] | 4,924,992[77] | ||||
| 82. | Newcastle Airport | Newcastle upon Tyne | 5,300,274[4] | 4,807,906[4] | ||||
| 83. | Galileo Galilei Airport | Pisa | 5,233,118[15] | 4,989,496[15] | ||||
| 84. | Rhodes International Airport | Rhodes | 5,231,159[66] | 4,942,386[66] | ||||
| 85. | Simferopol International Airport | Simferopol | 5,201,690[7] | 5,128,743[7] | ||||
| 86. | San Pablo Airport | Seville | 5,108,807[10] | 4,624,038[10] | ||||
| 87. | Bilbao Airport | Bilbao | 4,973,712[10] | 4,588,265[10] | ||||
| 88. | Liverpool John Lennon Airport | Liverpool | 4,896,603[4] | 4,778,939[4] | ||||
| 89. | East Midlands Airport | Derby/Leicester/Nottingham | 4,878,781[4] | 4,653,818[4] | ||||
| 90. | Bari Airport | Bari | 4,686,016[15] | 4,322,797[15] | ||||
| 91. | Gdańsk Lech Wałęsa Airport | Gdańsk | 4,611,714[119] | 4,004,081[119] | ||||
| 92. | London City Airport | London | 4,530,439[4] | 4,538,813[4] | ||||
| 93. | Trondheim Airport Værnes | Trondheim | 4,428,897[18] | 4,417,490[18] | ||||
| 94. | Nuremberg Airport | Nuremberg | 4,186,961[9] | 3,485,372[9] | ||||
| 95. | Stavanger Airport Sola | Stavanger | 4,178,241[18] | 4,193,665[18] | ||||
| 96. | Turin Airport | Turin | 4,176,556[15] | 3,950,908[15] | ||||
| 97. | Cagliari Elmas Airport | Cagliari | 4,157,612[15] | 3,695,045[15] | ||||
| 98. | New | Minsk National Airport | Minsk | 4,114,512[76] | 3,429,112[76] | |||
| 99. | Leeds Bradford Airport | Leeds | 4,076,616[4] | 3,612,117[4] | ||||
| 100. | New | Katowice Airport | Katowice | 3,892,941[89] | 3,221,261[89] |
2016[]
| Rank 2016 |
Rank change 2015–2016 |
Country | Airport | City served | Passengers 2015 |
Passengers 2016 |
Change 2015–2016 |
|---|---|---|---|---|---|---|---|
| 1 | United Kingdom | Heathrow Airport | London | 74,985,475[4] | 75,711,130[4] | ||
| 2 | France | Charles de Gaulle Airport | Paris | 65,766,986[13] | 65,933,145[13] | ||
| 3 | Netherlands | Amsterdam Airport Schiphol | Amsterdam | 58,284,848[6] | 63,625,664[6] | ||
| 4 | Germany | Frankfurt Airport | Frankfurt | 61,032,022[9] | 60,786,937[9] | ||
| 5 | Turkey | Istanbul Atatürk Airport | Istanbul | 61,322,729[13] | 60,415,470[13] | ||
| 6 | Spain | Adolfo Suárez Madrid–Barajas Airport | Madrid | 46,824,838[10] | 50,420,583[10] | ||
| 7 | Spain | Barcelona–El Prat Josep Tarradellas Airport | Barcelona | 39,711,237[10] | 44,154,693[10] | ||
| 8 | United Kingdom | Gatwick Airport | London | 40,269,087[4] | 43,119,628[4] | ||
| 9 | Germany | Munich Airport | Munich | 40,981,522[9] | 42,261,309[9] | ||
| 10 | Italy | Leonardo da Vinci–Fiumicino Airport | Rome | 40,463,208[15] | 41,744,769[15] | ||
| 11 | Russia | Sheremetyevo International Airport | Moscow | 31,302,068[7] | 33,679,052[7] | ||
| 12 | France | Orly Airport | Paris | 29,664,993[13] | 31,237,865[13] | ||
| 13 | Denmark | Copenhagen Airport | Copenhagen | 26,610,332[25] | 29,043,287[25] | ||
| 14 | Russia | Domodedovo International Airport | Moscow | 30,504,515[7] | 28,500,259[7] | ||
| 15 | Ireland | Dublin Airport | Dublin | 25,049,319[90] | 27,907,384[90] | ||
| 16 | Switzerland | Zurich Airport | Zürich | 26,281,228[92] | 27,666,428[92] | ||
| 17 | Spain | Palma de Mallorca Airport | Palma de Mallorca | 23,745,023[10] | 26,253,882[10] | ||
| 18 | Norway | Oslo Airport | Oslo | 24,678,195[18] | 25,787,691[18] | ||
| 19 | United Kingdom | Manchester Airport | Manchester | 23,136,047[4] | 25,637,054[4] | ||
| 20 | Sweden | Stockholm Arlanda Airport | Stockholm | 23,142,536[80] | 24,682,466[80] | ||
| 21 | United Kingdom | London Stansted Airport | London | 22,519,178[4] | 24,320,071[4] | ||
| 22 | Germany | Düsseldorf Airport | Düsseldorf | 22,476,685[9] | 23,521,919[9] | ||
| 23 | Austria | Vienna International Airport | Vienna | 22,775,054[22] | 23,352,016[22] | ||
| 24 | Portugal | Lisbon Airport | Lisbon | 20,090,418[49] | 22,449,289[49] | ||
| 25 | Belgium | Brussels Airport | Brussels | 23,460,018[30] | 21,818,418[30] | ||
| 26 | Germany | Berlin Tegel Airport | Berlin | 21,005,196[9] | 21,253,959[9] | ||
| 27 | Greece | Athens International Airport | Athens | 18,087,377[94] | 20,017,530[94] | ||
| 28 | Italy | Malpensa Airport | Milan | 18,582,043[15] | 19,420,690[15] | ||
| 29 | Finland | Helsinki Airport | Helsinki | 16,422,266[95] | 17,184,681[95] | ||
| 30 | Spain | Málaga Airport | Málaga | 14,404,206[10] | 16,672,776[10] | ||
| 31 | Switzerland | Geneva Airport | Geneva | 15,772,081[97] | 16,532,690[97] | ||
| 32 | Germany | Hamburg Airport | Hamburg | 15,610,072[9] | 16,224,154[9] | ||
| 33 | United Kingdom | Luton Airport | London | 12,263,505[4] | 14,551,774[4] | ||
| 34 | Russia | Vnukovo International Airport | Moscow | 15,815,129[7] | 13,946,688[7] | ||
| 35 | Russia | Pulkovo Airport | Saint Petersburg | 13,501,454[7] | 13,265,037[7] | ||
| 36 | Czech Republic | Václav Havel Airport Prague | Prague | 12,030,928[98] | 13,074,517[98] | ||
| 37 | Poland | Warsaw Chopin Airport | Warsaw | 11,186,688[37] | 12,795,356[37] | ||
| 38 | France | Nice Côte d'Azur Airport | Nice | 12,016,730[46] | 12,427,427[46] | ||
| 39 | United Kingdom | Edinburgh Airport | Edinburgh | 11,114,587[4] | 12,348,425[4] | ||
| 40 | Spain | Alicante Airport | Alicante | 10,575,288[10] | 12,344,945[10] | ||
| 41 | Germany | Cologne Bonn Airport | Cologne / Bonn | 10,338,375[9] | 11,910,138[9] | ||
| 42 | Germany | Berlin Schönefeld Airport | Berlin | 8,526,268[9] | 11,652,922[9] | ||
| 43 | United Kingdom | Birmingham Airport | Birmingham | 10,187,122[4] | 11,645,334[4] | ||
| 44 | Hungary | Budapest Ferenc Liszt International Airport | Budapest | 10,298,963[99] | 11,441,999[99] | ||
| 45 | Italy | Orio al Serio International Airport | Milan / Bergamo | 10,404,625[15] | 11,159,631[15] | ||
| 46 | Romania | Henri Coandă International Airport | Bucharest | 9,274,629[130] | 10,982,967[126] | ||
| 47 | Germany | Stuttgart Airport | Stuttgart | 10,512,225[9] | 10,626,430[9] | ||
| 48 | Italy | Linate Airport | Milan | 9,689,635[15] | 9,682,264[15] | ||
| 49 | Italy | Venice Marco Polo Airport | Venice | 8,751,028[15] | 9,624,748[15] | ||
| 50 | France | Lyon–Saint-Exupéry Airport | Lyon | 8,703,354[127] | 9,553,250[127] | ||
| 51 | Portugal | Porto Airport | Porto | 8,087,740[49] | 9,378,082[49] | ||
| 52 | United Kingdom | Glasgow Airport | Glasgow | 8,714,154[4] | 9,346,245[4] | ||
| 53 | Ukraine | Boryspil International Airport | Kyiv | 7,277,135[89] | 8,650,000[89] | ||
| 54 | France | Marseille Provence Airport | Marseille | 8,261,804[127] | 8,475,809[127] | ||
| 55 | France | Toulouse–Blagnac Airport | Toulouse | 7,669,054[104] | 8,081,179[104] | ||
| 56 | Italy | Catania-Fontanarossa Airport | Catania | 7,105,487[15] | 7,914,117[15] | ||
| 57 | Italy | Bologna Guglielmo Marconi Airport | Bologna | 6,889,742[15] | 7,680,992[15] | ||
| 58 | Portugal | Faro Airport | Faro | 6,436,881[49] | 7,630,909[49] | ||
| 59 | United Kingdom | Bristol Airport | Bristol | 6,786,790[4] | 7,610,780[4] | ||
| 60 | Spain | Ibiza Airport | Ibiza | 6,477,283[10] | 7,416,368[10] | ||
| 61 | France Switzerland Germany |
EuroAirport Basel Mulhouse Freiburg | Basel / Mulhouse / Freiburg im Breisgau | 7,061,059[60] | 7,314,269[60] | ||
| 62 | Belgium | Brussels South Charleroi Airport | Charleroi | 6,956,302[107] | 7,303,720[107] | ||
| 63 | Iceland | Keflavík International Airport | Reykjavík | 4,855,505[108] | 6,821,358[108] | ||
| 64 | Italy | Naples Airport | Naples | 6,163,188[15] | 6,775,988[15] | ||
| 65 | Greece | Heraklion International Airport | Heraklion | 6,057,355[66] | 6,742,746[66] | ||
| 66 | Sweden | Göteborg Landvetter Airport | Gothenburg | 6,158,334[80] | 6,369,396[80] | ||
| 67 | Norway | Bergen Airport, Flesland | Bergen | 6,020,866[18] | 5,949,060[18] | ||
| 68 | Spain | Valencia Airport | Valencia | 5,055,127[10] | 5,799,104[10] | ||
| 69 | France | Bordeaux – Mérignac Airport | Bordeaux | 5,323,294[127] | 5,779,569[127] | ||
| 70 | Greece | Thessaloniki International Airport, "Macedonia" | Thessaloniki | 5,341,293[66] | 5,687,325[66] | ||
| 71 | Germany | Langenhagen Airport | Hanover | 5,452,669[9] | 5,408,814[9] | ||
| 72 | Latvia | Riga International Airport | Riga | 5,162,149[74] | 5,400,243[74] | ||
| 73 | Italy | Rome Ciampino Airport | Rome | 5,834,201[15] | 5,395,699[15] | ||
| 74 | Italy | Falcone–Borsellino Airport | Palermo | 4,910,791[15] | 5,325,559[15] | ||
| 75 | Russia[note 1] | Simferopol International Airport | Simferopol | 5,017,758[7] | 5,201,690[7] | ||
| 76 | United Kingdom | Belfast International Airport | Belfast | 4,391,292[4] | 5,147,546[4] | ||
| 77 | Malta | Malta International Airport | Malta | 4,618,642[128] | 5,080,071[128] | ||
| 78 | Italy | Galileo Galilei Airport | Pisa | 4,804,774[15] | 4,989,496[15] | ||
| 79 | Poland | John Paul II International Airport Kraków–Balice | Kraków | 4,221,171[129] | 4,983,645[129] | ||
| 80 | Bulgaria | Sofia Airport | Sofia | 4,088,943[59] | 4,980,387[59] | ||
| 81 | Greece | Rhodes International Airport | Rhodes | 4,579,023[66] | 4,942,386[66] | ||
| 82 | Serbia | Belgrade Nikola Tesla Airport | Belgrade | 4,776,110[77] | 4,924,992[77] | ||
| 83 | United Kingdom | Newcastle Airport | Newcastle upon Tyne | 4,562,846[4] | 4,807,906[4] | ||
| 84 | Netherlands | Eindhoven Airport | Eindhoven | 4,373,882[72] | 4,780,197[72] | ||
| 85 | France | Nantes Atlantique Airport | Nantes | 4,394,996[127] | 4,778,967[127] | ||
| 86 | United Kingdom | Liverpool John Lennon Airport | Liverpool | 4,301,495[4] | 4,778,939[4] | ||
| 87 | United Kingdom | East Midlands Airport | Derby / Leicester / Nottingham | 4,450,862[4] | 4,653,818[4] | ||
| 88 | Spain | San Pablo Airport | Seville | 4,308,845[10] | 4,624,038[10] | ||
| 89 | Spain | Bilbao Airport | Bilbao | 4,277,725[10] | 4,588,265[10] | ||
| 90 | United Kingdom | London City Airport | London | 4,319,301[4] | 4,538,913[4] | ||
| 91 | Norway | Trondheim Airport | Trondheim | 4,352,721[18] | 4,417,490[18] | ||
| 92 | Italy | Bari Airport | Bari | 3,972,105[15] | 4,322,797[15] | ||
| 93 | Norway | Stavanger Airport | Stavanger | 4,499,482[89] | 4,193,665[89] | ||
| 94 | Poland | Gdańsk Lech Wałęsa Airport | Gdańsk | 3,706,180[89] | 4,004,081[89] | ||
| 95 | France | Beauvais Airport | Beauvais | 4,330,013[89] | 3,997,856[89] | ||
| 96 | Italy | Turin Airport | Turin | 3,659,312[15] | 3,943,298[15] | ||
| 97 | Lithuania | Vilnius Airport | Vilnius | 3,814,001[89] | 3,934,891[89] | ||
| 98 | Italy | Cagliari Airport | Cagliari | 3,714,174[15] | 3,689,747[15] | ||
| 99 | United Kingdom | Leeds Bradford Airport | Leeds | 3,446,831[89] | 3,612,061[89] | ||
| 100 | Germany | Nuremberg Airport | Nuremberg | 3,381,681[89] | 3,485,372[89] |
2010–2015[]
Gallery[]

London Heathrow Airport Terminal 5 serving London, United Kingdom

Sheremetyevo International Airport Terminal D serving Moscow, Russia
Paris-Charles de Gaulle Airport serving Paris, France

Amsterdam Airport Schiphol serving Amsterdam, Netherlands

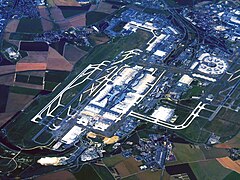
Frankfurt Airport serving Frankfurt, Germany

Istanbul Airport serving Istanbul, Turkey

Istanbul Atatürk Airport serving Istanbul, Turkey

Madrid-Barajas Airport serving Madrid, Spain
Leonardo da Vinci-Fiumicino Airport serving Rome, Italy

Zurich Airport serving Zurich, Switzerland

Copenhagen Airport serving Copenhagen, Denmark

Lisbon Portela Airport serving Lisbon, Portugal

Stockholm-Arlanda Airport serving Stockholm, Sweden
Brussels Airport serving Brussels, Belgium

Vienna Airport serving Vienna, Austria

Malpensa Airport serving Milan, Italy

Athens International Airport serving Athens, Greece

Helsinki Airport serving Helsinki, Finland
Václav Havel Airport Prague serving Prague, Czech Republic

Boryspil International Airport serving Kyiv, Ukraine

Sofia Airport serving Sofia, Bulgaria


See also[]
- Busiest airports by continent
- List of busiest airports by aircraft movements
- List of busiest airports by cargo traffic
- List of busiest airports by international passenger traffic
- List of busiest airports by passenger traffic
- List of busiest airports in the former Yugoslav republics
- List of busiest city airport systems by passenger traffic
- List of the busiest airports in the Balkans
- List of the busiest airports in the Baltic states
- List of the busiest airports in the European Union
- List of the busiest airports in the former Soviet Union
- List of the busiest airports in the Nordic countries
- A map showing the passenger turnover of the major European airports in 2018.
Busiest airports by country[]
- List of the busiest airports in Argentina
- List of the busiest airports in Australia
- List of the busiest airports in Brazil
- List of the busiest airports in Canada
- List of the busiest airports in China
- List of the busiest airports in France
- List of the busiest airports in Germany
- List of the busiest airports in Greece
- List of the busiest airports in Indonesia
- List of the busiest airports in the Republic of Ireland
- List of the busiest airports in Italy
- List of the busiest airports in Japan
- List of the busiest airports in New Zealand
- List of the busiest airports in Poland
- List of the busiest airports in Portugal
- List of the busiest airports in Romania
- List of the busiest airports in Russia
- List of the busiest airports in South Korea
- List of the busiest airports in Spain
- List of the busiest airports in Turkey
- List of the busiest airports in Ukraine
- List of the busiest airports in the United Kingdom
- List of the busiest airports in the United States
Notes[]
- ^ Jump up to: a b c d e Crimea is controlled by Russia since March 2014.
- ^ Jump up to: a b c d e Depending on the boundary between the continents, the airport can be considered as located in Asia[122][123][124]
References[]
- ^ Jump up to: a b c d e f g h i j Müdürlüğü, DHMİ Genel. "Devlet Hava Meydanları İşletmesi Genel Müdürlüğü". www.dhmi.gov.tr. Retrieved 2021-03-23.
- ^ Jump up to: a b c d e f g h i j k "Trafic de l'année 2020 impacté par la crise du Covid-19". www.parisaeroport.fr (in French). 18 January 2021. Retrieved 18 January 2021.
- ^ "Traffic" (PDF). www.parisaeroport.fr. 22 December 2020.
- ^ Jump up to: a b c d e f g h i j k l m n o p q r s t u v w x y z aa ab ac ad ae af ag ah ai aj ak al am an ao ap aq ar as at au av aw ax ay az ba bb bc bd be bf bg bh bi bj bk bl bm bn bo bp bq br bs bt bu bv bw bx by bz ca cb cc cd ce cf cg ch ci cj ck cl cm cn co cp cq cr cs ct cu cv cw cx cy cz da db dc dd de df dg dh di dj dk dl dm dn do dp dq dr ds dt du dv dw dx dy "UK airport data". caa.co.uk. UK Civil Aviation Authority. Retrieved 11 January 2021.
- ^ "Schiphol | Traffic and transport figures per month". Schiphol. 22 December 2020. Retrieved 22 December 2020.
- ^ Jump up to: a b c d e f g h i "Schiphol – Traffic and transport figures per month". 22 December 2020. Retrieved 22 December 2020.
- ^ Jump up to: a b c d e f g h i j k l m n o p q r s t u v w x y z aa ab ac ad ae af ag ah ai aj ak al am an ao ap aq ar as at au av aw ax ay az ba bb bc bd be bf "Объёмы перевозок через аэропорты московского авиационного узла за 2020 год". www.favt.ru. 26 January 2021. Retrieved 26 January 2021.
- ^ Jump up to: a b "Fraport 2019". 22 December 2020.
- ^ Jump up to: a b c d e f g h i j k l m n o p q r s t u v w x y z aa ab ac ad ae af ag ah ai aj ak al am an ao ap aq ar as at au av aw ax ay az ba bb bc bd be bf bg bh bi bj bk bl bm bn bo bp bq br bs bt bu bv bw bx by bz "Traffic Figures". Fraport. 22 December 2020.
- ^ Jump up to: a b c d e f g h i j k l m n o p q r s t u v w x y z aa ab ac ad ae af ag ah ai aj ak al am an ao ap aq ar as at au av aw ax ay az ba bb bc bd be bf bg bh bi bj bk bl bm bn bo bp bq br bs bt bu bv bw bx by bz ca cb cc cd ce cf cg ch ci cj ck cl "Estadísticas - Aeropuertos Españoles - aena.es". www.aena.es.
- ^ "Traffic Report" (PDF). www.munich-airport.com. 23 December 2020. Retrieved 23 December 2020.
- ^ "Annual Traffic Report2019" (PDF). 22 December 2020. Retrieved 22 December 2020.
- ^ Jump up to: a b c d e f g h i j k l m n o p q "Traffic". www.aeroportsdeparis.fr.
- ^ "Statistiche Dati di Traffico Aeroportuale Italiano". Assaeroporti (in Italian). Retrieved 2021-01-28.
- ^ Jump up to: a b c d e f g h i j k l m n o p q r s t u v w x y z aa ab ac ad ae af ag ah ai aj ak al am an ao ap aq ar as at au av aw ax ay az ba bb bc bd be bf bg bh bi bj bk bl bm bn bo bp bq br bs bt bu bv bw bx by bz ca cb cc cd ce cf cg ch ci cj ck cl cm cn co cp cq cr cs ct cu cv cw cx cy cz da db dc dd de df dg dh di dj dk dl dm dn do dp dq dr ds dt du dv dw dx dy "Statistiche – Assaeroporti" (PDF). www.assaeroporti.com. 22 December 2020.
- ^ Jump up to: a b c "Statistics Portugal – Web Portal". ine.pt. Retrieved 2021-02-18.
- ^ Portugal, ANA – Aeroportos de (22 December 2020). "Annual Reports – Corporate" (PDF).
- ^ Jump up to: a b c d e f g h i j k l m n o p q r s t u v w x y z aa ab ac ad ae af ag ah ai aj "Statistics – Avinor". avinor.no.
- ^ "Statistic Report". Retrieved 23 December 2020.
- ^ "Athens International Airport passenger traffic development 2020" (PDF).
- ^ "Athens International Airport passenger traffic development 2019" (PDF). 23 Dec 2020.
- ^ Jump up to: a b c d e f g h i j k l m n o p "Viennaairport – Traffic results". www.viennaairport.com.
- ^ "Viennaairport – FWAG (group) facts & figures". www.viennaairport.com. Retrieved 2020-12-23.
- ^ Jump up to: a b MAG December 2020 traffic statistics
- ^ Jump up to: a b c d e f g h i j "Traffic statistics". www.cph.dk.
- ^ "Dublin Airport passenger numbers at lowest since 1990s as pandemic wreaks havoc on Irish aviation". 19 February 2021. Retrieved 23 February 2021.
- ^ "Aviation Statistics". 22 December 2020. Retrieved 22 December 2020.
- ^ "Statistiche Dati di Traffico Aeroportuale Italiano". Assaeroporti (in Italian). Retrieved 2020-12-23.
- ^ Brussels Airport welcomed over 6.7 million passengers in 2020, a 74% decrease – Air cargo up by 2,2%
- ^ Jump up to: a b c d e f g "Monthly traffic figures".
- ^ Jump up to: a b c d e ADV monthly traffic report 2020
- ^ "Trafikstatistik på Swedavias flygplatser" (PDF).
- ^ "Trafikstatistik på Swedavias flygplatser" (PDF). Retrieved 23 December 2020.
- ^ "Traffic evolution" (PDF). Geneva Airport. 22 December 2020. Retrieved 22 Dec 2020.
- ^ "Genève Aéroport – Statistics" (PDF). www.gva.ch. 22 December 2020. Retrieved 22 December 2020.
- ^ W grudniu 2020 roku na Lotnisku Chopina zostało obsłużonych 224 tys. pasażerów, co oznacza spadek o 83,9 proc. w porównaniu do grudnia 2019 roku.
- ^ Jump up to: a b c d e f g "Statistics by origin airports – Urząd Lotnictwa Cywilnego". www.ulc.gov.pl.
- ^ london-luton statistics
- ^ "onthly Passenger and Statistics report - December 2,019.00" (PDF). Retrieved 23 December 2020.
- ^ Аэропорт Борисполь озвучил пассажиропоток за 2020 год
- ^ Jump up to: a b c d "Boryspil International Airport". Archived from the original on 2011-08-06. Retrieved 2019-01-07.
- ^ Jump up to: a b "Traffic statistics | Finavia". www.finavia.fi. Retrieved 2020-12-23.
- ^ Аэропорт Симферополь в 2020 году обслужил 4,63 млн пассажиров
- ^ "Аэропорт Симферополь обслужил 5,14 млн пассажиров в 2019 году". new.sipaero.ru.
- ^ Jump up to: a b c d e "Résultats d'activité des aéroports français 2020" (PDF) (in French).
- ^ Jump up to: a b c d e f g h S.S.L.L., Internethic. "Monthly Statistics Reports / Statistics / NEWS – MEDIA – Aéroport Nice Côte d'Azur : gateway to the mythical French Riviera". corporate.nice.aeroport.fr.
- ^ Passenger traffic at Bucharest airports plummets 70% in 2020
- ^ "2019 Air Traffic at Bucharest Airports". www.bucharestairports.ro.
- ^ Jump up to: a b c d e f g h i j k l m n o p q r s t u v w Portugal, ANA – Aeroportos de (14 July 2016). "Annual Reports – Corporate".
- ^ Jump up to: a b "BUD International Airport Traffic 2019–2020". Retrieved 20 Jan 2021.
- ^ "Letiště Praha odbavilo za minulý rok téměř 3,7 milionu cestujících". Retrieved 20 Jan 2021.
- ^ "Vaclav Havel Airport Prague Breaks a Record: 17.8 Million Handled Passengers in 2019". Vaclav Havel Airport Prague, Ruzyne. Retrieved 2020-12-23.
- ^ Jump up to: a b "Résultats d'activité des aéroports français 2017" (PDF). www.aeroport.fr.
- ^ "Zahlen und Daten". www.flughafen-stuttgart.de. Retrieved 2021-01-31.
- ^ "Zahlen und Daten". www.flughafen-stuttgart.de. Retrieved 2021-01-05.
- ^ GmbH, Flughafen Köln/Bonn. "Facts & figures". www.cologne-bonn-airport.com. Retrieved 2020-12-23.
- ^ Пассажиропоток аэропортов Кубани в 2020 году сократился на 11%, до 11,9 млн человек
- ^ "Passengers 2019–2020" (PDF). Sofia Airport.
- ^ Jump up to: a b c d e f g h i "Sofia Airport".
- ^ Jump up to: a b c d e f g h i "Statistics of EuroAirport – Statistics of Basel-Mulhouse Airport". www.euroairport.com.
- ^ "Statystyki miesięczne 2019 (PL)".
- ^ Jump up to: a b c d "101 travel ideas & more than 5.8 million passengers in 2017". 4 January 2018. Retrieved 2018-01-06.
- ^ "More than 2.6 million passengers crossed the tarmac at Charleroi airport in 2020, a 69% drop compared with 2019". Brussels South Charleroi Airport.
- ^ "New record at Brussels South Charleroi Airport: 8,221,450 passengers recorded in 2019 (+2%)". Brussels South Charleroi Airport.
- ^ "Airports traffic 2020". Civil Aviation Authority of the Hellenic Republic.
- ^ Jump up to: a b c d e f g h i j k l m n o p q r s t u v w x "Greece Airport Statistics".
- ^ В 2020 году аэропорт "Уфа" сохранил лидерство в ПФО по пассажиропотоку
- ^ Jump up to: a b "Air Traffic statistics | Thessaloniki Airport (SKG)". www.skg-airport.gr.
- ^ Bilan 2020 et perspectives 2021 de l'Aéroport de Bordeaux
- ^ Пассажиропоток в казанском аэропорту в пандемию упал на 38%
- ^ Пассажиропоток аэропорта Калининград (Храброво) за 2020 год превысил 2,1 млн человек
- ^ Jump up to: a b c d e f g h i j "Aviation; monthly figures of Dutch airports". www.eindhovenairport.nl.
- ^ "Riga Airport Statistics" (PDF). Riga Airport.
- ^ Jump up to: a b c d e f g h i "Passengers – Riga International Airport". www.riga-airport.com. Archived from the original on 2018-01-17. Retrieved 2012-01-14.
- ^ Национальный аэропорт Минск подвёл итоги работы за 2020 год
- ^ Jump up to: a b c d e "Operating rates – Minsk National Airport". airport.by.
- ^ Jump up to: a b c d e f g h i j "Traffic Figures :: Belgrade Nikola Tesla Airport". www.beg.aero. Archived from the original on 2018-03-06. Retrieved 2015-01-17.
- ^ Less passengers and air operations
- ^ Jump up to: a b c "Gdańsk Airport Statistic".
- ^ Jump up to: a b c d e f g h i j k l m n o p q r "Flygplatsstatistik". www.transportstyrelsen.se.
- ^ Jump up to: a b "Air Traffic statistics | Rhodes Airport (RHO)". www.rho-airport.gr.
- ^ Administration de la navigation aérienne (15 April 2021). "Statistiques – Evolution du trafic Mouvements, Fret, Passagers, Evolution globale des activités" (PDF). Gouvernement du Grand-Duché d Luxembourg – plateforme des données luxembourgeoises. Archived from the original on 15 February 2021. Retrieved 23 April 2021.
- ^ Jump up to: a b "Katowice Airport / Annual statistics". www.katowice-airport.com. Retrieved 2020-12-23.
- ^ "Statistiques mensuelles passagers commerciaux totaux" (PDF). aeroport.fr (in French). 2020-02-07. Retrieved 2020-02-08.
- ^ "Fraport 2019" (PDF).
- ^ Jump up to: a b "35.65 Million Airline Passengers Pass Through Berlin's Airports". Berlin Brandenburg Airport.
- ^ "Объемы перевозок через аэропорты России". www.favt.ru.
- ^ "Munich Airport reports 10th consecutive record-setting year". www.munich-airport.com.
- ^ Jump up to: a b c d e f g h i j k l m n o p q r "Aviation database bank, free of charge from anna.aero".
- ^ Jump up to: a b c d e f g "Annual Reports – daa".
- ^ "Key Figures December 2019". zurich-airport.com. 2020-01-13. Retrieved 2020-01-16.
- ^ Jump up to: a b c d e f "Zurich airport key figures".
- ^ "Aeroporto de Lisboa ultrapassou a fasquia dos 30 milhões de passageiros em 2019". Publico (in Portuguese). 2020-01-19. Retrieved 2020-01-19.
- ^ Jump up to: a b c d e f g h "Athens International Airport – Facts & Figures". www.aia.gr.
- ^ "Lotnisko Chopina – podsumowanie 2019 roku – Aktualności i wydarzenia – Lotnisko Chopina w Warszawie". www.lotnisko-chopina.pl.
- ^ Jump up to: a b c d e f g h "Genève Aéroport – Statistics". www.gva.ch.
- ^ Jump up to: a b c d e f g h "Prague Airport Traffic Reports". Vaclav Havel Airport Prague, Ruzyne.
- ^ Jump up to: a b c d e f g "Budapest airport traffic statistic".
- ^ Müdürlüğü, DHMİ Genel. "Devlet Hava Meydanları İşletmesi Genel Müdürlüğü". www.dhmi.gov.tr. Retrieved 2021-03-23.
- ^ "Аэропорт Борисполь за год обслужил на 21% больше пассажиров, чем в 2018 году". cfts.org.ua.
- ^ "2019 Air Traffic at Bucharest Airports". www.bucharestairports.ro.
- ^ Jump up to: a b c "RECORD de trafic pe aeroporturile din Bucureşti în 2017: Profitul CNAB a crescut cu 45% faţă de anul precedent".
- ^ Jump up to: a b c d e f g "Résultats de trafic".
- ^ "Statystyki miesięczne 2019 (PL)".
- ^ "New record at Brussels South Charleroi Airport: 8,221,450 passengers recorded in 2019 (+2%)". Brussels South Charleroi Airport.
- ^ Jump up to: a b c d e f g "Statistics". www.charleroi-airport.com. Archived from the original on 2018-01-14. Retrieved 2011-01-25.
- ^ Jump up to: a b c d e f g h "Passenger statistics – Isavia". www.kefairport.is.
- ^ "Аэропорт Симферополь обслужил 5,14 млн пассажиров в 2019 году". new.sipaero.ru.
- ^ "Национальный аэропорт Минск подвел итоги производственной деятельности за 2019 год – Minsk National Airport". airport.by.
- ^ "VNO" (PDF). www.ltou.lt. Retrieved 2020-02-06.
- ^ Jump up to: a b "Vilnius Airport Traffic Report 2018" (PDF). www.ltou.lt. 2019-01-04. Retrieved 2019-12-29.
- ^ Jump up to: a b c d "Annual Statistic". katowice-airport.com.
- ^ "More than 31 million passengers for the first time – Flughafen Zürich".
- ^ Jump up to: a b "Стал известен реальный пассажиропоток аэропорта Борисполь за 2017 год". cfts.org.ua. Retrieved 2018-02-07.
- ^ "Data" (PDF). www.aeroport.fr.
- ^ "Statystyki miesięczne 2018".
- ^ "Gdańsk Airport Statistic".
- ^ Jump up to: a b c "Gdańsk Airport Statistic" (PDF).
- ^ "Vilnius Airport Traffic Report 2017" (PDF). www.ltou.lt. Retrieved 2019-12-29.
- ^ "Национальный аэропорт Минск подвел итоги производственной деятельности за 2018 год – Minsk National Airport". airport.by.
- ^ Asia — Encyclopædia Britannica
- ^ Europe — Encyclopædia Britannica
- ^ Европа // Большая советская энциклопедия : [в 30 т.] / гл. ред. А. М. Прохоров. — 3-е изд. — М. : Советская энциклопедия, 1969–1978
- ^ "Record breaking traffic growth at Budapest Airport in 2017". www.bud.hu. Retrieved 2018-02-17.
- ^ Jump up to: a b Bobon, Gabriel. "Record de pasageri pe aeroporturile din București: 10,99 milioane de pasageri în 2016 – BoardingPass.ro". boardingpass.ro.
- ^ Jump up to: a b c d e f g h i j k l "Data" (PDF). www.aeroport.fr.
- ^ Jump up to: a b c "Statistics – Malta International Airport".
- ^ Jump up to: a b c "Basic data". krakowairport.pl.
- ^ "Aeroporturi București – Compania Naţională Aeroporturi București – Rapoarte anuale". www.bucharestairports.ro.
- Lists of busiest airports
- Airports in Europe
- Aviation in Europe
- Lists of airports in Europe