Results breakdown of the 2010 United Kingdom general election
| ||||||||||||||||||||||||||||||||||||||||||||||||||||||||
All 650 seats in the House of Commons of the United Kingdom 326 seats needed for a majority | ||||||||||||||||||||||||||||||||||||||||||||||||||||||||
|---|---|---|---|---|---|---|---|---|---|---|---|---|---|---|---|---|---|---|---|---|---|---|---|---|---|---|---|---|---|---|---|---|---|---|---|---|---|---|---|---|---|---|---|---|---|---|---|---|---|---|---|---|---|---|---|---|
| Turnout | 65.1% | |||||||||||||||||||||||||||||||||||||||||||||||||||||||
This lists parties that won seats. See the complete results below. | ||||||||||||||||||||||||||||||||||||||||||||||||||||||||
| ||||||||||||||||||||||||||||||||||||||||||||||||||||||||

This is the results breakdown of the 2010 United Kingdom general election.
Swing[]
The election was marked by no uniform national swing, with suburban and rural constituencies showing large swings from Labour to the Conservatives, but urban seats showing much smaller swings. Scotland recorded a small swing back to Labour.


Seats changing hands[]
The following table is a complete list of seats changing hands as a result of the election based on the notional results of the 2005 election, notwithstanding the results of by-elections to the 54th Parliament.[1]
The Conservatives gained more seats than at any other general election since their landslide result in 1931. Labour lost a total of 94 seats, the second most seats it had lost in a single election.
| Seat | 2005 election | 2010 election | ||
|---|---|---|---|---|
| Aberconwy | Labour | Conservative gain | ||
| Amber Valley | Labour | Conservative gain | ||
| Arfon | Labour | Plaid Cymru gain | ||
| Battersea | Labour | Conservative gain | ||
| Bedford | Labour | Conservative gain | ||
| Belfast East | DUP | Alliance gain | ||
| Bethnal Green and Bow | Respect | Labour gain | ||
| Blaenau Gwent | Blaenau Gwent PV | Labour gain | ||
| Blackpool North and Cleveleys | Labour | Conservative gain | ||
| Bradford East | Labour | Liberal Democrats gain | ||
| Brent Central | Labour | Liberal Democrats gain | ||
| Brentford and Isleworth | Labour | Conservative gain | ||
| Brigg and Goole | Labour | Conservative gain | ||
| Brighton Kemptown | Labour | Conservative gain | ||
| Brighton Pavilion | Labour | Green gain | ||
| Bristol North West | Labour | Conservative gain | ||
| Broxtowe | Labour | Conservative gain | ||
| Buckingham | Conservative | Speaker gain | ||
| Burnley | Labour | Liberal Democrats gain | ||
| Burton | Labour | Conservative gain | ||
| Bury North | Labour | Conservative gain | ||
| Calder Valley | Labour | Conservative gain | ||
| Camborne and Redruth | Liberal Democrats | Conservative gain | ||
| Cannock Chase | Labour | Conservative gain | ||
| Cardiff North | Labour | Conservative gain | ||
| Carlisle | Labour | Conservative gain | ||
| Carmarthen West and Pembrokeshire South | Labour | Conservative gain | ||
| Castle Point | Independent | Conservative gain | ||
| Chatham and Aylesford | Labour | Conservative gain | ||
| Chester | Labour | Conservative gain | ||
| Chesterfield | Liberal Democrats | Labour gain | ||
| Cleethorpes | Labour | Conservative gain | ||
| Colne Valley | Labour | Conservative gain | ||
| Corby | Labour | Conservative gain | ||
| Cornwall South East | Liberal Democrats | Conservative gain | ||
| Crawley | Labour | Conservative gain | ||
| Crewe and Nantwich | Labour | Conservative gain | ||
| Croydon Central | Labour | Conservative gain | ||
| Dartford | Labour | Conservative gain | ||
| Derbyshire South | Labour | Conservative gain | ||
| Dewsbury | Labour | Conservative gain | ||
| Dorset South | Labour | Conservative gain | ||
| Dover | Labour | Conservative gain | ||
| Dudley South | Labour | Conservative gain | ||
| Ealing Central and Acton | Labour | Conservative gain | ||
| Eastbourne | Conservative | Liberal Democrats gain | ||
| Elmet and Rothwell | Labour | Conservative gain | ||
| Erewash | Labour | Conservative gain | ||
| Gillingham and Rainham | Labour | Conservative gain | ||
| Glasgow North East | Speaker | Labour gain | ||
| Gloucester | Labour | Conservative gain | ||
| Great Yarmouth | Labour | Conservative gain | ||
| Halesowen and Rowley Regis | Labour | Conservative gain | ||
| Harlow | Labour | Conservative gain | ||
| Harrogate and Knaresborough | Liberal Democrats | Conservative gain | ||
| Harrow East | Labour | Conservative gain | ||
| Hastings | Labour | Conservative gain | ||
| Hendon | Labour | Conservative gain | ||
| Hereford and South Herefordshire | Liberal Democrats | Conservative gain | ||
| High Peak | Labour | Conservative gain | ||
| Hove | Labour | Conservative gain | ||
| Ipswich | Labour | Conservative gain | ||
| Keighley | Labour | Conservative gain | ||
| Kingswood | Labour | Conservative gain | ||
| Lancaster and Fleetwood | Labour | Conservative gain | ||
| Leicestershire North West | Labour | Conservative gain | ||
| Lincoln | Labour | Conservative gain | ||
| Loughborough | Labour | Conservative gain | ||
| Milton Keynes North | Labour | Conservative gain | ||
| Milton Keynes South | Labour | Conservative gain | ||
| Montgomeryshire | Liberal Democrats | Conservative gain | ||
| Morecambe and Lunesdale | Labour | Conservative gain | ||
| Newton Abbot | Liberal Democrats | Conservative gain | ||
| North Down | UUP | Independent gain | ||
| Northampton North | Labour | Conservative gain | ||
| Northampton South | Labour | Conservative gain | ||
| Norwich North | Labour | Conservative gain | ||
| Norwich South | Labour | Liberal Democrats gain | ||
| Nuneaton | Labour | Conservative gain | ||
| Oxford West and Abingdon | Liberal Democrats | Conservative gain | ||
| Pendle | Labour | Conservative gain | ||
| Plymouth Sutton and Devonport | Labour | Conservative gain | ||
| Portsmouth North | Labour | Conservative gain | ||
| Pudsey | Labour | Conservative gain | ||
| Reading West | Labour | Conservative gain | ||
| Redcar | Labour | Liberal Democrats gain | ||
| Rochdale (notional gain) | Liberal Democrats | Labour gain | ||
| Richmond Park | Liberal Democrats | Conservative gain | ||
| Romsey and Southampton North | Liberal Democrats | Conservative gain | ||
| Rossendale and Darwen | Labour | Conservative gain | ||
| Rugby | Labour | Conservative gain | ||
| Sherwood | Labour | Conservative gain | ||
| Solihull (notional gain) | Conservative | Liberal Democrats gain | ||
| South Basildon and East Thurrock | Labour | Conservative gain | ||
| South Ribble | Labour | Conservative gain | ||
| Stafford | Labour | Conservative gain | ||
| Stevenage | Labour | Conservative gain | ||
| Stockton South | Labour | Conservative gain | ||
| Stourbridge | Labour | Conservative gain | ||
| Stroud | Labour | Conservative gain | ||
| Swindon North | Labour | Conservative gain | ||
| Swindon South | Labour | Conservative gain | ||
| Tamworth | Labour | Conservative gain | ||
| Thurrock | Labour | Conservative gain | ||
| Truro and Falmouth | Liberal Democrats | Conservative gain | ||
| Vale of Glamorgan | Labour | Conservative gain | ||
| Warrington South | Labour | Conservative gain | ||
| Warwick and Leamington | Labour | Conservative gain | ||
| Warwickshire North | Labour | Conservative gain | ||
| Watford | Labour | Conservative gain | ||
| Waveney | Labour | Conservative gain | ||
| Weaver Vale | Labour | Conservative gain | ||
| Wells | Conservative | Liberal Democrats gain | ||
| Winchester | Liberal Democrats | Conservative gain | ||
| Wolverhampton South West | Labour | Conservative gain | ||
| Worcester | Labour | Conservative gain | ||
| Wyre Forest | Health Concern | Conservative gain | ||
| York Outer | Liberal Democrats | Conservative gain | ||
- Due to Boundary Changes this seat was notionally Conservative, even though it was previously held by the Liberal Democrats, making it a Liberal Democrat gain.
England[]
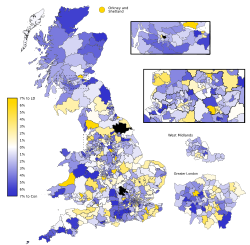
Of the 533 seats in England, only 532 were contested on the day of the general election. Polling in Thirsk and Malton was delayed until 27 May due to the death of the UKIP candidate.[2] The Conservatives won an absolute majority of seats in England with 61 seats more than all other parties combined, and securing an average swing of 5.6% from Labour.[3]
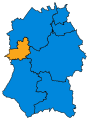
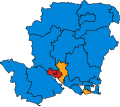
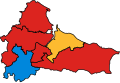
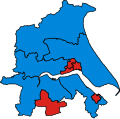
Geographical representations of seats coloured by winning party can be misleading to the eye. Boundaries are drawn by number of electors not geography. This results in rural seats having a large area due to lower population density, while urban seats, with a high density of voters, are geographically quite small. A pure geographical representation of seats coloured by party can make parties with rural seats seem far more popular than urban ones. To counter this bias, the BBC published a map where each seat was an equal size hexagon.[4][5]
| Party | Seats | Seats change |
Votes | % | % change | |
|---|---|---|---|---|---|---|
| Conservative | 297[6] | +92 | 9,908,169 | 39.5 | +3.8 | |
| Labour | 191 | −87 | 7,042,398 | 28.1 | −7.4 | |
| Liberal Democrats | 43 | −4 | 6,076,189 | 24.2 | +1.3 | |
| Green | 1 | +1 | 258,954 | 1.0 | −0.1 | |
| Speaker | 1 | 0 | 22,860 | 0.09 | ||
| Turnout: | 25,047,355 | 65.5 | ||||
Details of results are given below:

Durham

Cumbria

Lancashire

North Yorkshire

West Yorkshire

South Yorkshire

Merseyside

Greater Manchester

Cheshire

Derbyshire

Nottinghamshire
Lincolnshire

Staffordshire
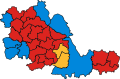
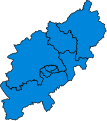
West Midlands
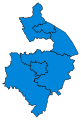
Warwickshire

Leicestershire and Rutland
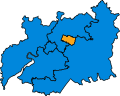
Northamptonshire
Herefordshire

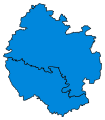
Worcestershire
Gloucestershire

Oxfordshire

Buckinghamshire

Bedfordshire

Cambridgeshire

Norfolk
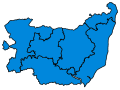
Suffolk

Essex
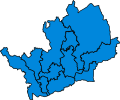
Hertfordshire

Berkshire

London

Cornwall

Devon
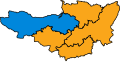
Somerset
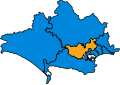
Dorset

Avon
Wiltshire
Hampshire

Surrey

West Sussex

East Sussex

Kent


Wales[]
There were 40 seats contested in Wales. The number of Conservative seats rose from three to eight – the party gained one seat from the Liberal Democrats and four from Labour. Welsh nationalist party Plaid Cymru retained three MPs, including Arfon which the boundary changes had notionally given to Labour. Overall, Labour lost four seats but held on to its remaining 26.
| Party | Seats | Seats change |
Votes | % | % change | |
|---|---|---|---|---|---|---|
| Labour | 26 | −4 | 531,601 | 36.2 | −6.5 | |
| Conservative | 8 | +5 | 382,730 | 26.1 | +4.7 | |
| Liberal Democrats | 3 | −1 | 295,164 | 20.1 | +1.7 | |
| Plaid Cymru | 3 | 0 | 165,394 | 11.3 | −1.3 | |
| Turnout: | 1,446,690 | 64.9 | ||||

Scotland[]
There were 59 seats contested in Scotland. Every constituency in Scotland was won by the party that had won it at the 2005 election, with Labour regaining the two seats they lost in by-elections since 2005. There was a swing to Labour from the Conservatives of 0.8% (with Labour increasing its share of the vote by 2.5% and the Conservatives increasing by just 0.9%), this left the Conservatives with just a single MP representing a Scottish constituency.
For Scottish results in full, see 2010 United Kingdom general election results in Scotland
| Party | Seats | Seats change |
Votes | % | % change | |
|---|---|---|---|---|---|---|
| Labour | 41 | 0 | 1,035,528 | 42.0 | +2.5 | |
| Liberal Democrats | 11 | 0 | 465,471 | 18.9 | −3.7 | |
| SNP | 6 | 0 | 491,386 | 19.9 | +2.3 | |
| Conservative | 1 | 0 | 412,855 | 16.7 | +0.9 | |
| Turnout: | 2,465,722 | 63.8 | ||||

Northern Ireland[]
There were 18 seats contested in Northern Ireland. Both Irish nationalist parties, Sinn Féin and SDLP, held their seats. The unionist parties, DUP and UUP (the latter contested the election as UCUNF—an electoral pact with the Conservatives), lost one seat each. The DUP lost Belfast East to the Alliance and in North Down the UUP's Sylvia Hermon left the party over the alliance with the Conservatives and retained her seat as an independent. This left the nationalist parties with eight seats, the unionist parties with eight seats (all DUP), the Alliance with one seat and an independent with one seat. It is the first time since the Partition of Ireland that unionist parties failed to secure a majority of Northern Ireland's Westminster seats in a general election. It was also the first time since Partition that a Nationalist party, Sinn Féin, topped the popular vote at a Westminster election, though winning three fewer seats than the DUP.
Sinn Féin, as an Irish republican party, refuse to take their seats at Westminster (see abstentionism). This leaves 645 MPs to take their seats at Westminster (after the Thirsk and Malton poll), reducing the effective threshold for a parliamentary majority from 326 to 323.[citation needed]
| Party | Seats | Seats change |
Votes | % | % change | |
|---|---|---|---|---|---|---|
| DUP | 8 | −1 | 168,216 | 25.0 | −8.7 | |
| Sinn Féin | 5 | 0 | 171,942 | 25.5 | +1.2 | |
| SDLP | 3 | 0 | 110,970 | 16.5 | −1.0 | |
| Alliance | 1 | +1 | 42,762 | 6.3 | +2.4 | |
| Independent - Sylvia Hermon | 1 | +1 | 21,181 | 3.1 | — | |
| UCU-NF | 0 | −1 | 102,361 | 15.2 | −2.6 | |
| Turnout: | 673,871 | 57.6 | −7.8 | |||

References[]
- ^ The Times - Election '10 - Gains and losses Archived 29 April 2010 at the Wayback Machine
- ^ "Tories triumph in Thirsk and Malton poll". The Times. London. 28 May 2010. Retrieved 4 July 2010.
- ^ Staff (7 May 2010). "Election 2010: England". BBC News. BBC. Retrieved 10 May 2010.
- ^ "BBC map with selectable geographic and proportional views". BBC News. Retrieved 11 June 2011.
- ^ England results BBC News, accessed 9 May 2010
- ^ Note: this figure excludes John Bercow (Buckingham), who is recorded by the BBC as a "Conservative", despite the fact he is the incumbent Speaker.
- 2010 United Kingdom general election
- Election results in the United Kingdom