San Fernando, Cebu
San Fernando | |
|---|---|
| Municipality of San Fernando | |
 San Fernando Municipal Hall | |
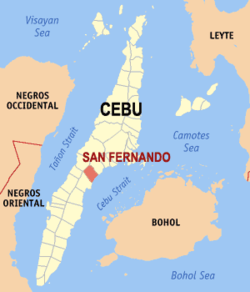 Map of Cebu with San Fernando highlighted | |
show OpenStreetMap | |
 San Fernando Location within the Philippines | |
| Coordinates: 10°10′N 123°42′E / 10.17°N 123.7°ECoordinates: 10°10′N 123°42′E / 10.17°N 123.7°E | |
| Country | Philippines |
| Region | Central Visayas |
| Province | Cebu |
| District | 1st district |
| Barangays | 21 (see Barangays) |
| Government | |
| • Type | Sangguniang Bayan |
| • Mayor | Lakambini G. Reluya |
| • Vice Mayor | Ricci Regen G. Reluya[1] |
| • Representative | Eduardo R. Gullas |
| • Municipal Council | show
Members |
| • Electorate | 48,525 voters (2019) |
| Area | |
| • Total | 69.39 km2 (26.79 sq mi) |
| Elevation | 85 m (279 ft) |
| Highest elevation | 401 m (1,316 ft) |
| Lowest elevation | 0 m (0 ft) |
| Population (2020 census) [4] | |
| • Total | 72,224 |
| • Density | 1,000/km2 (2,700/sq mi) |
| • Households | 14,223 |
| Economy | |
| • Income class | 2nd municipal income class |
| • Poverty incidence | 24.27% (2015)[5] |
| • Revenue | ₱156,384,328.48 (2016) |
| Service provider | |
| • Electricity | Visayan Electric Company (VECO) |
| Time zone | UTC+8 (PST) |
| ZIP code | 6018 |
| PSGC | |
| IDD : area code | +63 (0)32 |
| Climate type | tropical rainforest climate |
| Native languages | Cebuano Tagalog |


San Fernando, officially the Municipality of San Fernando (Cebuano: Lungsod sa San Fernando; Tagalog: Bayan ng San Fernando), is a 2nd class municipality in the province of Cebu, Philippines. According to the 2020 census, it has a population of 72,224 people. [4]
San Fernando is bordered to the north by the City of Naga, to the west is the town of Pinamungajan, to the east is the Cebu Strait, and to the south is the city of Carcar.
San Fernando lies within Metro Cebu.[6]
Barangays[]
San Fernando comprises 21 barangays:
| PSGC | Barangay | Population | ±% p.a. | |||
|---|---|---|---|---|---|---|
| 2020 [4] | 2010 [7] | |||||
| 072241002 | Balud | 5.7% | 4,135 | 3,525 | 1.55% | |
| 072241003 | Balungag | 2.9% | 2,116 | 1,855 | 1.28% | |
| 072241005 | Basak | 1.4% | 1,017 | 1,009 | 0.08% | |
| 072241007 | Bugho | 1.8% | 1,317 | 1,367 | −0.36% | |
| 072241008 | Cabatbatan | 2.7% | 1,933 | 1,875 | 0.29% | |
| 072241009 | Green Hills | 3.5% | 2,508 | 2,700 | −0.71% | |
| 072241024 | Ilaya | 2.7% | 1,975 | 1,918 | 0.28% | |
| 072241010 | Lantawan | 2.8% | 2,054 | 1,789 | 1.34% | |
| 072241011 | Liburon | 1.4% | 995 | 1,009 | −0.13% | |
| 072241012 | Magsico | 3.0% | 2,188 | 2,188 | 0.00% | |
| 072241014 | Panadtaran | 7.5% | 5,400 | 4,971 | 0.80% | |
| 072241015 | Pitalo | 11.0% | 7,962 | 7,311 | 0.83% | |
| 072241013 | Poblacion North | 6.2% | 4,444 | 4,205 | 0.54% | |
| 072241018 | Poblacion South | 11.5% | 8,294 | 7,352 | 1.17% | |
| 072241016 | San Isidro | 5.7% | 4,128 | 3,691 | 1.09% | |
| 072241017 | Sangat | 8.2% | 5,910 | 5,597 | 0.53% | |
| 072241019 | Tabionan | 3.0% | 2,147 | 1,873 | 1.33% | |
| 072241020 | Tananas | 2.4% | 1,706 | 1,345 | 2.32% | |
| 072241021 | Tinubdan | 3.1% | 2,215 | 1,994 | 1.02% | |
| 072241022 | Tonggo | 2.9% | 2,110 | 1,936 | 0.83% | |
| 072241023 | Tubod | 2.4% | 1,726 | 1,460 | 1.63% | |
| Total | 72,224 | 60,970 | 1.65% | |||
Climate[]
| hideClimate data for San Fernando, Cebu | |||||||||||||
|---|---|---|---|---|---|---|---|---|---|---|---|---|---|
| Month | Jan | Feb | Mar | Apr | May | Jun | Jul | Aug | Sep | Oct | Nov | Dec | Year |
| Average high °C (°F) | 28 (82) |
29 (84) |
30 (86) |
31 (88) |
31 (88) |
30 (86) |
30 (86) |
30 (86) |
30 (86) |
29 (84) |
29 (84) |
28 (82) |
30 (85) |
| Average low °C (°F) | 23 (73) |
23 (73) |
23 (73) |
24 (75) |
25 (77) |
25 (77) |
25 (77) |
25 (77) |
25 (77) |
25 (77) |
24 (75) |
23 (73) |
24 (75) |
| Average precipitation mm (inches) | 70 (2.8) |
49 (1.9) |
62 (2.4) |
78 (3.1) |
138 (5.4) |
201 (7.9) |
192 (7.6) |
185 (7.3) |
192 (7.6) |
205 (8.1) |
156 (6.1) |
111 (4.4) |
1,639 (64.6) |
| Average rainy days | 13.4 | 10.6 | 13.1 | 14.5 | 24.2 | 27.9 | 28.4 | 27.7 | 27.1 | 27.4 | 22.5 | 15.9 | 252.7 |
| Source: Meteoblue [8] | |||||||||||||
Demographics[]
| Year | Pop. | ±% p.a. |
|---|---|---|
| 1903 | 15,451 | — |
| 1918 | 20,029 | +1.75% |
| 1939 | 17,562 | −0.62% |
| 1948 | 16,132 | −0.94% |
| 1960 | 19,061 | +1.40% |
| 1970 | 24,073 | +2.36% |
| 1975 | 25,877 | +1.46% |
| 1980 | 28,324 | +1.82% |
| 1990 | 35,051 | +2.15% |
| 1995 | 38,700 | +1.87% |
| 2000 | 48,235 | +4.83% |
| 2007 | 54,932 | +1.81% |
| 2010 | 60,970 | +3.87% |
| 2015 | 66,280 | +1.60% |
| 2020 | 72,224 | +1.70% |
| Source: Philippine Statistics Authority [9] [7] [10][11] | ||
Economy[]
| Poverty Incidence of San Fernando | |
| Source: Philippine Statistics Authority[12][13][14][15][16][17] | |
References[]
- ^ May B. Miasco (8 June 2019). "Reluya to fulfill his slain father's dream". The Philippine Star. Retrieved 29 December 2019.
- ^ Municipality of San Fernando | (DILG)
- ^ "2015 Census of Population, Report No. 3 – Population, Land Area, and Population Density" (PDF). Philippine Statistics Authority. Quezon City, Philippines. August 2016. ISSN 0117-1453. Archived (PDF) from the original on May 25, 2021. Retrieved July 16, 2021.
- ^ Jump up to: a b c Census of Population (2020). "Region VII (Central Visayas)". Total Population by Province, City, Municipality and Barangay. PSA. Retrieved 8 July 2021.
- ^ https://psa.gov.ph/sites/default/files/City%20and%20Municipal-level%20Small%20Area%20Poverty%20Estimates_%202009%2C%202012%20and%202015_0.xlsx; publication date: 10 July 2019; publisher: Philippine Statistics Authority.
- ^ Sun Star Cebu 2005.
- ^ Jump up to: a b Census of Population and Housing (2010). "Region VII (Central Visayas)". Total Population by Province, City, Municipality and Barangay. NSO. Retrieved 29 June 2016.
- ^ "San Fernando: Average Temperatures and Rainfall". Meteoblue. Retrieved 10 May 2020.
- ^ Census of Population (2015). "Region VII (Central Visayas)". Total Population by Province, City, Municipality and Barangay. PSA. Retrieved 20 June 2016.
- ^ Censuses of Population (1903–2007). "Region VII (Central Visayas)". Table 1. Population Enumerated in Various Censuses by Province/Highly Urbanized City: 1903 to 2007. NSO.
- ^ "Province of Cebu". Municipality Population Data. Local Water Utilities Administration Research Division. Retrieved 17 December 2016.
- ^ "Poverty incidence (PI):". Philippine Statistics Authority. Retrieved 28 December 2020.
- ^ https://psa.gov.ph/sites/default/files/NSCB_LocalPovertyPhilippines_0.pdf; publication date: 29 November 2005; publisher: Philippine Statistics Authority.
- ^ https://psa.gov.ph/sites/default/files/2003%20SAE%20of%20poverty%20%28Full%20Report%29_1.pdf; publication date: 23 March 2009; publisher: Philippine Statistics Authority.
- ^ https://psa.gov.ph/sites/default/files/2006%20and%202009%20City%20and%20Municipal%20Level%20Poverty%20Estimates_0_1.pdf; publication date: 3 August 2012; publisher: Philippine Statistics Authority.
- ^ https://psa.gov.ph/sites/default/files/2012%20Municipal%20and%20City%20Level%20Poverty%20Estima7tes%20Publication%20%281%29.pdf; publication date: 31 May 2016; publisher: Philippine Statistics Authority.
- ^ https://psa.gov.ph/sites/default/files/City%20and%20Municipal-level%20Small%20Area%20Poverty%20Estimates_%202009%2C%202012%20and%202015_0.xlsx; publication date: 10 July 2019; publisher: Philippine Statistics Authority.
Sources[]
- Sun Star Cebu, CYR (8 October 2005). "RDC enlarges Metro Cebu". Archived from the original on 11 March 2007.CS1 maint: unfit URL (link)
External links[]
- San Fernando Profile at PhilAtlas.com
- Philippine Standard Geographic Code
- . New International Encyclopedia. 1905.
| Wikimedia Commons has media related to San Fernando. |
| show Places adjacent to San Fernando, Cebu |
|---|
| show Authority control |
|---|
This article about a location in Central Visayas region of the Philippines is a stub. You can help Wikipedia by . |
Categories:
- Municipalities of Cebu
- Municipalities in Metro Cebu
- Central Visayas geography stubs