Compostela, Cebu
Compostela | |
|---|---|
| Municipality of Compostela | |
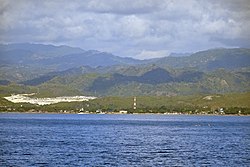 Compostela skyline | |
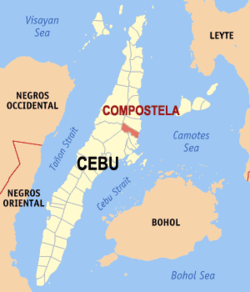 Map of Cebu with Compostela highlighted | |
OpenStreetMap  | |
 Compostela Location within the Philippines | |
| Coordinates: 10°28′N 123°58′E / 10.47°N 123.97°ECoordinates: 10°28′N 123°58′E / 10.47°N 123.97°E | |
| Country | Philippines |
| Region | Central Visayas |
| Province | Cebu |
| District | 5th district |
| Founded Chartered | 26 December 1878 17 January 1919 |
| Barangays | 17 (see Barangays) |
| Government | |
| • Type | Sangguniang Bayan |
| • Mayor | Froilan Quiño |
| • Vice Mayor | Josephine T. Abing |
| • Representative | Vincent Franco D. Frasco |
| • Municipal Council | Members |
| • Electorate | 32,716 voters (2019) |
| Area | |
| • Total | 53.90 km2 (20.81 sq mi) |
| Elevation | 35 m (115 ft) |
| Highest elevation | 335 m (1,099 ft) |
| Lowest elevation | 0 m (0 ft) |
| Population (2020 census) [3] | |
| • Total | 55,874 |
| • Density | 1,000/km2 (2,700/sq mi) |
| • Households | 10,689 |
| Economy | |
| • Income class | 3rd municipal income class |
| • Poverty incidence | 19.57% (2015)[4] |
| • Revenue | ₱173,469,763.09 (2020) |
| • Assets | ₱459,229,929.57 (2020) |
| • Expenditure | ₱194,143,731.88 (2020) |
| • Liabilities | ₱82,663,625.18 (2020) |
| Service provider | |
| • Electricity | Cebu 2 Electric Cooperative (CEBECO 2) |
| Time zone | UTC+8 (PST) |
| ZIP code | 6003 |
| PSGC | |
| IDD : area code | +63 (0)32 |
| Native languages | Cebuano Tagalog |

Compostela, officially the Municipality of Compostela (Cebuano: Lungsod sa Compostela; Tagalog: Bayan ng Compostela), is a 3rd class municipality in the province of Cebu, Philippines. According to the 2020 census, it has a population of 55,874 people. [3]
Compostela is within the Metro Cebu area.
History[]
This section does not cite any sources. (April 2013) |
In the year 1844, Spanish authorities established local government units on the northern part of Cebu starting from what is now known as the town of Compostela as far north as what is now called the town of Borbon. Compostela was among the early barrios of the Danao. The newly established barrio was named Compostela on the suggestion of a Roman Catholic friar who came from the town of Santiago de Compostela in Spain and brought along with him the image of that town's patron saint, St. James the Great. Adopting the said saint as the local patron, a parish chapel was built from light materials. As the population grew, the Spanish church authorities decided to elevate the chapel into a church so that in the year 1866 the catholic church was constructed on the same site. Up to present time, the same structure continues to be the major place of worship in Compostela.
At the turn of the 20th century, the Americans gained control over the Philippines when they defeated the Spaniards in the Battle of Manila Bay. As a consequence, the Treaty of Paris caused the reorganization and reclassification of all local government units in the country according to their population and income. The reorganization which took place in 1903 resulted in the secession of Compostela to Liloan. In 1919, Compostela became a municipality.
Geography[]
Compostela is bordered on the north by the city of Danao, to the west by Cebu City, on the east by the Camotes Sea, and on the south by the town of Liloan.
Barangays[]
Compostela comprises 17 barangays:
| PSGC | Barangay | Population | ±% p.a. | |||
|---|---|---|---|---|---|---|
| 2020 [3] | 2010 [5] | |||||
| 072218001 | Bagalnga | 4.1% | 2,283 | 1,922 | 1.63% | |
| 072218002 | Basak | 3.2% | 1,773 | 1,695 | 0.42% | |
| 072218003 | Buluang | 2.4% | 1,365 | 1,259 | 0.76% | |
| 072218004 | Cabadiangan | 4.1% | 2,284 | 2,111 | 0.74% | |
| 072218005 | Cambayog | 2.3% | 1,283 | 1,165 | 0.91% | |
| 072218006 | Canamucan | 7.8% | 4,345 | 4,058 | 0.64% | |
| 072218007 | Cogon | 13.2% | 7,357 | 5,517 | 2.74% | |
| 072218008 | Dapdap | 2.2% | 1,212 | 1,151 | 0.49% | |
| 072218009 | Estaca | 11.3% | 6,327 | 5,177 | 1.90% | |
| 072218010 | Lupa | 1.6% | 873 | 812 | 0.68% | |
| 072218011 | Magay | 4.3% | 2,391 | 2,539 | −0.56% | |
| 072218012 | Mulao | 2.9% | 1,600 | 1,538 | 0.37% | |
| 072218013 | Panangban | 2.0% | 1,104 | 1,125 | −0.18% | |
| 072218014 | Poblacion | 18.6% | 10,372 | 9,536 | 0.79% | |
| 072218015 | Tag‑ube | 2.2% | 1,250 | 1,203 | 0.36% | |
| 072218016 | Tamiao | 2.7% | 1,533 | 1,225 | 2.13% | |
| 072218017 | Tubigan | 1.0% | 546 | 541 | 0.09% | |
| Total | 55,874 | 42,574 | 2.58% | |||
Climate[]
| Climate data for Compostela, Cebu | |||||||||||||
|---|---|---|---|---|---|---|---|---|---|---|---|---|---|
| Month | Jan | Feb | Mar | Apr | May | Jun | Jul | Aug | Sep | Oct | Nov | Dec | Year |
| Average high °C (°F) | 28 (82) |
28 (82) |
29 (84) |
31 (88) |
31 (88) |
30 (86) |
29 (84) |
30 (86) |
29 (84) |
29 (84) |
29 (84) |
28 (82) |
29 (85) |
| Average low °C (°F) | 22 (72) |
22 (72) |
23 (73) |
23 (73) |
25 (77) |
25 (77) |
24 (75) |
24 (75) |
24 (75) |
24 (75) |
23 (73) |
23 (73) |
24 (74) |
| Average precipitation mm (inches) | 70 (2.8) |
49 (1.9) |
62 (2.4) |
78 (3.1) |
138 (5.4) |
201 (7.9) |
192 (7.6) |
185 (7.3) |
192 (7.6) |
205 (8.1) |
156 (6.1) |
111 (4.4) |
1,639 (64.6) |
| Average rainy days | 13.4 | 10.6 | 13.1 | 14.5 | 24.2 | 27.9 | 28.4 | 27.7 | 27.1 | 27.4 | 22.5 | 15.9 | 252.7 |
| Source: Meteoblue (modeled/calculated data, not measured locally) [6] | |||||||||||||
Demographics[]
| Year | Pop. | ±% p.a. |
|---|---|---|
| 1903 | 5,602 | — |
| 1939 | 9,441 | +1.46% |
| 1948 | 8,411 | −1.28% |
| 1960 | 11,862 | +2.91% |
| 1970 | 13,931 | +1.62% |
| 1975 | 15,506 | +2.17% |
| 1980 | 17,504 | +2.45% |
| 1990 | 22,006 | +2.32% |
| 1995 | 26,499 | +3.54% |
| 2000 | 31,446 | +3.74% |
| 2007 | 39,167 | +3.07% |
| 2010 | 42,574 | +3.08% |
| 2015 | 47,898 | +2.27% |
| 2020 | 55,874 | +3.07% |
| Source: Philippine Statistics Authority [7] [5] [8] | ||
Economy[]
| Poverty Incidence of Compostela | |
| Source: Philippine Statistics Authority[9][10][11][12][13][14] | |
References[]
- ^ Municipality of Compostela | (DILG)
- ^ "2015 Census of Population, Report No. 3 – Population, Land Area, and Population Density" (PDF). Philippine Statistics Authority. Quezon City, Philippines. August 2016. ISSN 0117-1453. Archived (PDF) from the original on May 25, 2021. Retrieved July 16, 2021.
- ^ a b c Census of Population (2020). "Region VII (Central Visayas)". Total Population by Province, City, Municipality and Barangay. PSA. Retrieved 8 July 2021.
- ^ https://psa.gov.ph/sites/default/files/City%20and%20Municipal-level%20Small%20Area%20Poverty%20Estimates_%202009%2C%202012%20and%202015_0.xlsx; publication date: 10 July 2019; publisher: Philippine Statistics Authority.
- ^ a b Census of Population and Housing (2010). "Region VII (Central Visayas)". Total Population by Province, City, Municipality and Barangay. NSO. Retrieved 29 June 2016.
- ^ "Compostela: Average Temperatures and Rainfall". Meteoblue. Retrieved 10 May 2020.
- ^ Census of Population (2015). "Region VII (Central Visayas)". Total Population by Province, City, Municipality and Barangay. PSA. Retrieved 20 June 2016.
- ^ Censuses of Population (1903–2007). "Region VII (Central Visayas)". Table 1. Population Enumerated in Various Censuses by Province/Highly Urbanized City: 1903 to 2007. NSO.
- ^ "Poverty incidence (PI):". Philippine Statistics Authority. Retrieved 28 December 2020.
- ^ https://psa.gov.ph/sites/default/files/NSCB_LocalPovertyPhilippines_0.pdf; publication date: 29 November 2005; publisher: Philippine Statistics Authority.
- ^ https://psa.gov.ph/sites/default/files/2003%20SAE%20of%20poverty%20%28Full%20Report%29_1.pdf; publication date: 23 March 2009; publisher: Philippine Statistics Authority.
- ^ https://psa.gov.ph/sites/default/files/2006%20and%202009%20City%20and%20Municipal%20Level%20Poverty%20Estimates_0_1.pdf; publication date: 3 August 2012; publisher: Philippine Statistics Authority.
- ^ https://psa.gov.ph/sites/default/files/2012%20Municipal%20and%20City%20Level%20Poverty%20Estima7tes%20Publication%20%281%29.pdf; publication date: 31 May 2016; publisher: Philippine Statistics Authority.
- ^ https://psa.gov.ph/sites/default/files/City%20and%20Municipal-level%20Small%20Area%20Poverty%20Estimates_%202009%2C%202012%20and%202015_0.xlsx; publication date: 10 July 2019; publisher: Philippine Statistics Authority.
- Wagas, Neil Edwin R (2014). "History of Compostela (Cebu, Philippines)". Archived from the original on 22 August 2016.
External links[]
| Wikimedia Commons has media related to Compostela, Cebu. |
| Wikivoyage has a travel guide for Compostela, Cebu. |
Places adjacent to Compostela, Cebu | ||||||||||||||||
|---|---|---|---|---|---|---|---|---|---|---|---|---|---|---|---|---|
| ||||||||||||||||
Cebu City (capital) | |
| Municipalities |
|
| Component cities | |
| Highly urbanized cities | (Administratively independent from the province but grouped under Cebu by the Philippine Statistics Authority. However, qualified voters in Mandaue are allowed to vote in elections for Cebu provincial officials by virtue of Republic Act No. 6641, in accordance with Section 452-c of the Local Government Code of 1991.) |
- Municipalities of Cebu
- Municipalities in Metro Cebu