Poro, Cebu
Poro | |
|---|---|
| Municipality of Poro | |
 Poro town hall | |
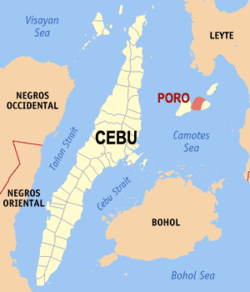 Map of Cebu with Poro highlighted | |
show OpenStreetMap | |
 Poro Location within the Philippines | |
| Coordinates: 10°38′N 124°25′E / 10.63°N 124.42°ECoordinates: 10°38′N 124°25′E / 10.63°N 124.42°E | |
| Country | Philippines |
| Region | Central Visayas |
| Province | Cebu |
| District | 5th district |
| Founded | 17 December 1701 |
| Barangays | 17 (see Barangays) |
| Government | |
| • Type | Sangguniang Bayan |
| • Mayor | Edgar G. Rama |
| • Vice Mayor | Luciano D. Rama Jr. |
| • Representative | Vincent Franco D. Frasco |
| • Municipal Council | show
Members |
| • Electorate | 15,646 voters (2019) |
| Area | |
| • Total | 63.59 km2 (24.55 sq mi) |
| Elevation | 48 m (157 ft) |
| Highest elevation | 377 m (1,237 ft) |
| Lowest elevation | 0 m (0 ft) |
| Population (2020 census) [3] | |
| • Total | 26,232 |
| • Density | 410/km2 (1,100/sq mi) |
| • Households | 6,092 |
| Economy | |
| • Income class | 4th municipal income class |
| • Poverty incidence | 34.09% (2015)[4] |
| • Revenue | ₱74,621,570.91 (2016) |
| Service provider | |
| • Electricity | Camotes Electric Cooperative (CELCO) |
| Time zone | UTC+8 (PST) |
| ZIP code | 6049 |
| PSGC | |
| IDD : area code | +63 (0)32 |
| Climate type | tropical monsoon climate |
| Native languages | Porohanon Cebuano |


Poro, officially the Municipality of Poro (Cebuano: Lungsod sa Poro; Tagalog: Bayan ng Poro), is a 4th class municipality in the province of Cebu, Philippines. According to the 2020 census, it has a population of 26,232 people. [3]
Poro, along with the municipality of Tudela, is located on Poro Island of the Camotes Islands.
Poro is bordered to the north by the Province of Leyte in the Camotes Sea, to the west is by the island of Pacijan Island With the town of San Francisco, to the east is the town of Tudela and to the south is the Camotes Sea
The patronal feast of Poro is celebrated on the third Friday of January, in honour of the Santo Niño de Cebu.
Barangays[]
Poro comprises 17 barangays:
| PSGC | Barangay | Population | ±% p.a. | |||
|---|---|---|---|---|---|---|
| 2020 [3] | 2010 [5] | |||||
| 072238001 | Adela | 6.6% | 1,737 | 1,339 | 2.54% | |
| 072238002 | Altavista | 3.7% | 958 | 1,142 | −1.68% | |
| 072238003 | Cagcagan | 11.9% | 3,114 | 3,238 | −0.38% | |
| 072238004 | Cansabusab | 2.2% | 577 | 525 | 0.92% | |
| 072238005 | Daan Paz | 3.5% | 922 | 888 | 0.36% | |
| 072238006 | Eastern Poblacion | 4.4% | 1,158 | 886 | 2.62% | |
| 072238007 | Esperanza | 12.7% | 3,324 | 3,131 | 0.58% | |
| 072238008 | Libertad | 5.0% | 1,313 | 1,276 | 0.28% | |
| 072238010 | Mabini | 4.8% | 1,259 | 1,254 | 0.04% | |
| 072238011 | Mercedes | 9.9% | 2,585 | 2,294 | 1.16% | |
| 072238012 | Pagsa | 4.5% | 1,183 | 672 | 5.61% | |
| 072238013 | Paz | 4.8% | 1,252 | 1,206 | 0.36% | |
| 072238014 | Rizal | 3.3% | 871 | 817 | 0.62% | |
| 072238015 | San Jose | 4.8% | 1,255 | 1,136 | 0.97% | |
| 072238016 | Santa Rita | 2.7% | 705 | 860 | −1.90% | |
| 072238018 | Teguis | 5.3% | 1,397 | 1,323 | 0.53% | |
| 072238019 | Western Poblacion | 6.1% | 1,602 | 1,511 | 0.57% | |
| Total | 26,232 | 23,498 | 1.07% | |||
Climate[]
| hideClimate data for Poro, Cebu | |||||||||||||
|---|---|---|---|---|---|---|---|---|---|---|---|---|---|
| Month | Jan | Feb | Mar | Apr | May | Jun | Jul | Aug | Sep | Oct | Nov | Dec | Year |
| Average high °C (°F) | 28 (82) |
28 (82) |
29 (84) |
30 (86) |
30 (86) |
30 (86) |
29 (84) |
29 (84) |
29 (84) |
29 (84) |
29 (84) |
28 (82) |
29 (84) |
| Average low °C (°F) | 22 (72) |
22 (72) |
22 (72) |
23 (73) |
25 (77) |
25 (77) |
25 (77) |
25 (77) |
25 (77) |
24 (75) |
24 (75) |
23 (73) |
24 (75) |
| Average precipitation mm (inches) | 78 (3.1) |
57 (2.2) |
84 (3.3) |
79 (3.1) |
118 (4.6) |
181 (7.1) |
178 (7.0) |
169 (6.7) |
172 (6.8) |
180 (7.1) |
174 (6.9) |
128 (5.0) |
1,598 (62.9) |
| Average rainy days | 16.7 | 13.8 | 17.3 | 18.5 | 23.2 | 26.5 | 27.1 | 26.0 | 26.4 | 27.5 | 24.6 | 21.0 | 268.6 |
| Source: Meteoblue [6] | |||||||||||||
Demographics[]
| Year | Pop. | ±% p.a. |
|---|---|---|
| 1903 | 4,991 | — |
| 1918 | 6,754 | +2.04% |
| 1939 | 11,520 | +2.58% |
| 1948 | 12,523 | +0.93% |
| 1960 | 13,736 | +0.77% |
| 1970 | 14,858 | +0.79% |
| 1975 | 16,535 | +2.17% |
| 1980 | 17,717 | +1.39% |
| 1990 | 19,150 | +0.78% |
| 1995 | 21,517 | +2.21% |
| 2000 | 21,397 | −0.12% |
| 2007 | 21,529 | +0.08% |
| 2010 | 23,498 | +3.24% |
| 2015 | 25,212 | +1.35% |
| 2020 | 26,232 | +0.78% |
| Source: Philippine Statistics Authority [7] [5] [8] | ||
Etymology and languages[]
The town's name is derived from the Waray-Waray word puro meaning "island". This how Camotes Island is called by Warays and Leyteños. Before the first municipality to be established in Camotes, puro meant the name of all the islands.
Aside from Cebuano, Waray, Tagalog, and English, the townsfolk also speak the local Porohanon language. Also known as Camotes Visayan, the language is mutually intelligible with other Visayan languages (e.g. Cebuano) spoken in the rest of the Camotes Islands, Cebu, other parts of the Visayas, and Northern Mindanao.
The town is home to the Porohanon language, one of the most endangered languages in the Visayas. The language is only used in the Poro islands. The language is classified as distinct from Sebwano (Bisaya) by the Komisyon ng Wikang Filipino and is vital to the culture and arts of the Porohanon people. Porohanon is distinguished by the way the locals substitute /j/ sounds with /ʒ/, for instance Cebuano maayong buntag ("good morning") vocalised as maazong buntag in Porohanon. (Possibly occasions too a handover from the yeísmo phenomenon in Spanish.) Other dialectical variations include the Porohanon ara dira instead of the standard Cebuano na-a diha.
Economy[]
| Poverty Incidence of Poro | |
| Source: Philippine Statistics Authority[9][10][11][12][13][14] | |
References[]
- ^ Municipality of Poro | (DILG)
- ^ "2015 Census of Population, Report No. 3 – Population, Land Area, and Population Density" (PDF). Philippine Statistics Authority. Quezon City, Philippines. August 2016. ISSN 0117-1453. Archived (PDF) from the original on May 25, 2021. Retrieved July 16, 2021.
- ^ Jump up to: a b c Census of Population (2020). "Region VII (Central Visayas)". Total Population by Province, City, Municipality and Barangay. PSA. Retrieved 8 July 2021.
- ^ https://psa.gov.ph/sites/default/files/City%20and%20Municipal-level%20Small%20Area%20Poverty%20Estimates_%202009%2C%202012%20and%202015_0.xlsx; publication date: 10 July 2019; publisher: Philippine Statistics Authority.
- ^ Jump up to: a b Census of Population and Housing (2010). "Region VII (Central Visayas)". Total Population by Province, City, Municipality and Barangay. NSO. Retrieved 29 June 2016.
- ^ "Poro: Average Temperatures and Rainfall". Meteoblue. Retrieved 10 May 2020.
- ^ Census of Population (2015). "Region VII (Central Visayas)". Total Population by Province, City, Municipality and Barangay. PSA. Retrieved 20 June 2016.
- ^ Censuses of Population (1903–2007). "Region VII (Central Visayas)". Table 1. Population Enumerated in Various Censuses by Province/Highly Urbanized City: 1903 to 2007. NSO.
- ^ "Poverty incidence (PI):". Philippine Statistics Authority. Retrieved 28 December 2020.
- ^ https://psa.gov.ph/sites/default/files/NSCB_LocalPovertyPhilippines_0.pdf; publication date: 29 November 2005; publisher: Philippine Statistics Authority.
- ^ https://psa.gov.ph/sites/default/files/2003%20SAE%20of%20poverty%20%28Full%20Report%29_1.pdf; publication date: 23 March 2009; publisher: Philippine Statistics Authority.
- ^ https://psa.gov.ph/sites/default/files/2006%20and%202009%20City%20and%20Municipal%20Level%20Poverty%20Estimates_0_1.pdf; publication date: 3 August 2012; publisher: Philippine Statistics Authority.
- ^ https://psa.gov.ph/sites/default/files/2012%20Municipal%20and%20City%20Level%20Poverty%20Estima7tes%20Publication%20%281%29.pdf; publication date: 31 May 2016; publisher: Philippine Statistics Authority.
- ^ https://psa.gov.ph/sites/default/files/City%20and%20Municipal-level%20Small%20Area%20Poverty%20Estimates_%202009%2C%202012%20and%202015_0.xlsx; publication date: 10 July 2019; publisher: Philippine Statistics Authority.
Further reading[]
- The Freeman, Clarence Paul Oaminal (30 April 1962) [2015]. "Macapagal visited Cebu months after the elections in 1961". Archived from the original on 15 August 2015.
External links[]
| Wikimedia Commons has media related to Poro. |
Places adjacent to Poro, Cebu | ||||||||||
|---|---|---|---|---|---|---|---|---|---|---|
| ||||||||||
| Authority control |
|
|---|
- Municipalities of Cebu