From Wikipedia, the free encyclopedia
For the city in Shandong formerly known as Teng County (
滕县 ), see
Tengzhou .
County in Guangxi, People's Republic of China
Teng County or Tengxian (simplified Chinese : 藤县 ; traditional Chinese : 藤縣 ; pinyin : Téng Xiàn Zhuang : Dwngz Yen ) is a county of eastern Guangxi , China. It is under the administration of the prefecture-level city of Wuzhou . As of 20022 (1,523.41 sq mi).
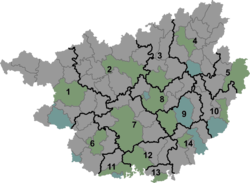
Administrative divisions [ ] Teng County administers 15 towns and 1 township.[1]
Towns:
(藤州镇)
(塘步镇)
(琅南镇)
(同心镇)
(金鸡镇)
(新庆镇)
(象棋镇)
(岭景镇)
(天平镇)
(Mongkong) (蒙江镇 (濛江))
(和平镇)
(太平镇)
(古龙镇)
(东荣镇)
Dali (大黎镇)
The only township is (平福乡)
Notable people [ ] Climate [ ]
show
Month
Jan
Feb
Mar
Apr
May
Jun
Jul
Aug
Sep
Oct
Nov
Dec
Year
Record high °C (°F)
29.7
34.7
33.7
35.5
36.9
37.8
39.4
38.7
38.1
35.8
33.6
30.3
39.4
Average high °C (°F)
17.1
18.1
21.1
26.2
30.2
32.3
33.8
33.7
32.1
29.0
24.3
19.7
26.5
Daily mean °C (°F)
12.1
13.7
16.9
21.9
25.3
27.4
28.4
28.2
26.7
23.3
18.2
13.6
21.3
Average low °C (°F)
8.7
10.7
14.0
18.8
22.0
24.3
24.8
24.6
22.9
19.1
13.9
9.5
17.8
Record low °C (°F)
−1.2
−0.3
1.2
6.8
13.0
17.5
19.1
20.2
15.1
6.6
2.7
−2.9
−2.9
Average precipitation mm (inches)
58.2
74.3
88.4
156.8
241.3
210.7
196.2
166.9
106.5
54.9
44.1
33.2
1,431.5
Average relative humidity (%)
77
81
83
83
83
84
81
82
79
75
75
75
80
Source: China Meteorological Data Service Center
References [ ]
^ 2011年统计用区划代码和城乡划分代码:藤县 . Retrieved 2012-08-12 .
External links [ ]
show Authority control General National libraries
Categories :
County-level divisions of Guangxi Wuzhou Guangxi geography stubs Hidden categories:
CS1 uses Chinese-language script (zh) CS1 Chinese-language sources (zh) Articles containing Chinese-language text Articles with short description Short description is different from Wikidata Articles containing Zhuang-language text Coordinates on Wikidata Articles containing simplified Chinese-language text Articles containing traditional Chinese-language text Articles containing potentially dated statements from 2002 All articles containing potentially dated statements Articles with VIAF identifiers Articles with LCCN identifiers Articles with WORLDCATID identifiers All stub articles