Ziyuan County
Ziyuan County
资源县 · Swhyenz Yen | |
|---|---|
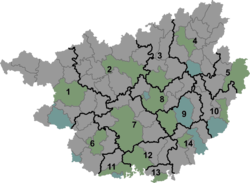 Ziyuan Location of the seat in Guangxi | |
| Coordinates: 26°02′31″N 110°39′11″E / 26.042°N 110.653°ECoordinates: 26°02′31″N 110°39′11″E / 26.042°N 110.653°E | |
| Country | People's Republic of China |
| Autonomous region | Guangxi |
| Prefecture-level city | Guilin |
| Area | |
| • Total | 1,961.14 km2 (757.20 sq mi) |
| Population | |
| • Total | 170,000 |
| • Density | 87/km2 (220/sq mi) |
| Time zone | UTC+8 (China Standard) |

Ziyuan County (simplified Chinese: 资源县; traditional Chinese: 資源縣; pinyin: Zīyuán Xiàn; Zhuang: Swhyenz Yen) is a county in the northeast of Guangxi, China, bordering Hunan province to the north. It is under the administration of the prefecture-level city of Guilin.
Languages[]
The Ziyuan County Almanac lists the following languages and their respective distributions.[1]
- Chinese
- Miao: in Chetian 车田苗族乡; Liangtian 两水苗族乡; Hekou 河口瑶族乡 (in Dawan 大湾, Congping 葱坪); Meixi 梅溪乡 (in Chaping 茶坪)
- Yao: in Hekou 河口瑶族乡 (in Congping 葱坪, Houbei 猴背, Gaoshan 高山); Liangshui 两水苗族乡 (in Fengshui 凤水, Sheshui 社水); Zhongfeng 中峰乡 (in Sheling 社岭, Bafang 八坊); Tingdong 延东乡 (in Shixitou 石溪头, Putian 浦田)
Climate[]
| showClimate data for Ziyuan (1981−2010) |
|---|
References[]
| show Authority control |
|---|
This Guangxi location article is a stub. You can help Wikipedia by . |
Categories:
- County-level divisions of Guangxi
- Guangxi geography stubs