Yajiang County
Nyagchukha County
雅江县 · ཉག་ཆུ་རྫོང་། | |
|---|---|
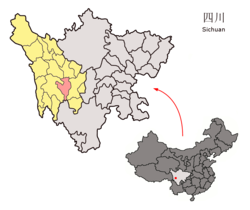 Location of Yajiang County (red) within Garzê Prefecture (yellow) and Sichuan | |
| Coordinates: 30°01′55″N 101°00′50″E / 30.032°N 101.014°ECoordinates: 30°01′55″N 101°00′50″E / 30.032°N 101.014°E | |
| Country | People's Republic of China |
| Province | Sichuan |
| Autonomous prefecture | Garzê |
| Area | |
| • Total | 7,558 km2 (2,918 sq mi) |
| Time zone | UTC+8 (China Standard) |

Nyagqu or Nyachukha County (Tibetan: ཉག་ཆུ་རྫོང་།, Wylie: nyag chu rdzong, ZYPY: Nyagqu Zong, Nyagchukha, Nyagquka) or Yajiang County (Chinese: 雅江县; pinyin: Yǎjiāng Xiàn), named after Nyagchukha in Tibetan, is a county of the traditional Kham Region of eastern Tibet. It is currently under the administration of the Garzê Tibetan Autonomous Prefecture, in the west of Sichuan Province, China.

Climate[]
| showClimate data for Yajiang (1981−2010) |
|---|
References[]
- ^ 中国地面气候标准值月值(1981-2010) (in Chinese). China Meteorological Data Service Center. Retrieved 20 October 2018.


| show Authority control |
|---|
This Sichuan location article is a stub. You can help Wikipedia by . |
Categories:
- Garzê Tibetan Autonomous Prefecture
- County-level divisions of Sichuan
- Sichuan geography stubs