1980 United States presidential election in New Mexico
| |||||||||||||||||||||||||||||||||
| |||||||||||||||||||||||||||||||||
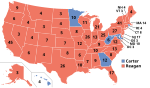
 County Results
| |||||||||||||||||||||||||||||||||
| |||||||||||||||||||||||||||||||||


| Elections in New Mexico |
|---|
 |
|
show |
|
show |
|
show |
The 1980 United States presidential election in New Mexico took place on November 4, 1980. All 50 states and The District of Columbia, were part of the 1980 United States presidential election. State voters chose four electors to the Electoral College, who voted for president and vice president.
New Mexico was won by former California Governor Ronald Reagan by an 18-point landslide.[1] President of the United States Jimmy Carter failed to gain reelection against Reagan. New Mexico election results reflect the Republican Party's re-consolidation under what is popularly call the "Reagan Revolution,"[2] which sounded overwhelming conservative electoral victories across the United States. As of the 2020 presidential election, this is the last time when McKinley County and Grant County voted for a Republican presidential candidate.[3]
Results[]
| Presidential candidate | Party | Home state | Popular vote | Electoral vote |
Running mate | |||
|---|---|---|---|---|---|---|---|---|
| Count | Percentage | Vice-presidential candidate | Home state | Electoral vote | ||||
| Ronald Reagan | Republican | California | 250,779 | 54.97% | 4 | George H. W. Bush | Texas | 4 |
| Jimmy Carter | Democratic | Georgia | 167,826 | 36.78% | 0 | Walter Mondale | Minnesota | 0 |
| John B. Anderson | Independent | Illinois | 29,459 | 6.46% | 0 | Patrick Lucey | Wisconsin | 0 |
| Ed Clark | Libertarian | California | 4,365 | 0.96% | 0 | David Koch | New York | 0 |
| Barry Commoner | Citizens | New York | 2,202 | 0.48% | 0 | LaDonna Harris | Oklahoma | 0 |
| Benjamin Bubar | Statesman | Maine | 1,281 | 0.28% | 0 | Earl Dodge | Colorado | 0 |
| Andrew Pulley | Socialist Workers | Illinois | 325 | 0.07% | 0 | Matilde Zimmermann | New York | 0 |
| Total | 456,237 | 100% | 4 | 4 | ||||
| Needed to win | 270 | 270 | ||||||
Results by county[]
| County | Ronald Wilson Reagan Republican |
James Earl Carter Democratic |
John Bayard Anderson Independent |
Various candidates Other parties |
Margin | |||||
|---|---|---|---|---|---|---|---|---|---|---|
| % | # | % | # | % | # | % | # | % | # | |
| Lincoln | 68.79% | 3,009 | 25.77% | 1,127 | 3.93% | 172 | 1.51% | 66 | 43.03% | 1,882 |
| Chaves | 67.24% | 12,502 | 28.77% | 5,350 | 2.92% | 543 | 1.07% | 199 | 38.46% | 7,152 |
| San Juan | 66.30% | 15,579 | 28.53% | 6,705 | 3.15% | 741 | 2.02% | 474 | 37.76% | 8,874 |
| Curry | 67.37% | 8,132 | 30.01% | 3,622 | 1.52% | 183 | 1.10% | 133 | 37.37% | 4,510 |
| Lea | 66.28% | 10,727 | 30.93% | 5,006 | 1.84% | 298 | 0.95% | 154 | 35.35% | 5,721 |
| Union | 65.87% | 1,407 | 31.60% | 675 | 1.50% | 32 | 1.03% | 22 | 34.27% | 732 |
| Los Alamos | 58.19% | 5,460 | 25.24% | 2,368 | 14.79% | 1,388 | 1.78% | 167 | 32.95% | 3,092 |
| Catron | 62.74% | 906 | 32.27% | 466 | 2.77% | 40 | 2.22% | 32 | 30.47% | 440 |
| Sierra | 62.50% | 2,222 | 32.88% | 1,169 | 3.29% | 117 | 1.32% | 47 | 29.62% | 1,053 |
| Quay | 62.09% | 2,499 | 35.33% | 1,422 | 1.44% | 58 | 1.14% | 46 | 26.76% | 1,077 |
| Roosevelt | 60.92% | 3,950 | 34.55% | 2,240 | 3.21% | 208 | 1.33% | 86 | 26.37% | 1,710 |
| Otero | 60.26% | 7,210 | 34.36% | 4,111 | 3.99% | 478 | 1.39% | 166 | 25.90% | 3,099 |
| Valencia | 58.39% | 11,177 | 35.97% | 6,886 | 4.31% | 825 | 1.33% | 254 | 22.42% | 4,291 |
| Harding | 59.23% | 356 | 37.44% | 225 | 2.33% | 14 | 1.00% | 6 | 21.80% | 131 |
| Torrance | 57.42% | 1,907 | 37.97% | 1,261 | 3.04% | 101 | 1.57% | 52 | 19.45% | 646 |
| McKinley | 56.66% | 7,329 | 37.64% | 4,869 | 3.85% | 498 | 1.84% | 238 | 19.02% | 2,460 |
| Luna | 57.30% | 3,636 | 38.50% | 2,443 | 2.47% | 157 | 1.73% | 110 | 18.80% | 1,193 |
| Bernalillo | 53.45% | 83,956 | 34.92% | 54,841 | 9.63% | 15,118 | 2.00% | 3,148 | 18.54% | 29,115 |
| Doña Ana | 53.92% | 15,539 | 37.61% | 10,839 | 6.46% | 1,863 | 2.01% | 579 | 16.31% | 4,700 |
| Sandoval | 53.74% | 6,762 | 37.67% | 4,740 | 6.27% | 789 | 2.31% | 291 | 16.07% | 2,022 |
| Eddy | 56.55% | 9,817 | 40.49% | 7,028 | 1.88% | 326 | 1.08% | 188 | 16.07% | 2,789 |
| De Baca | 56.17% | 655 | 41.51% | 484 | 1.20% | 14 | 1.11% | 13 | 14.67% | 171 |
| Hidalgo | 53.19% | 1,059 | 42.19% | 840 | 2.96% | 59 | 1.66% | 33 | 11.00% | 219 |
| Socorro | 49.52% | 2,685 | 41.05% | 2,226 | 7.14% | 387 | 2.29% | 124 | 8.47% | 459 |
| Colfax | 49.88% | 2,537 | 44.55% | 2,266 | 3.91% | 199 | 1.65% | 84 | 5.33% | 271 |
| Guadalupe | 49.65% | 1,065 | 45.69% | 980 | 2.70% | 58 | 1.96% | 42 | 3.96% | 85 |
| Grant | 47.41% | 4,628 | 47.13% | 4,600 | 3.58% | 349 | 1.89% | 184 | 0.29% | 28 |
| Santa Fe | 42.86% | 12,361 | 43.89% | 12,658 | 10.83% | 3,123 | 2.41% | 696 | -1.03% | -297 |
| Taos | 41.67% | 3,584 | 50.53% | 4,346 | 5.60% | 482 | 2.20% | 189 | -8.86% | -762 |
| Mora | 43.48% | 1,037 | 53.42% | 1,274 | 1.84% | 44 | 1.26% | 30 | -9.94% | -237 |
| San Miguel | 39.34% | 3,292 | 53.94% | 4,514 | 4.97% | 416 | 1.76% | 147 | -14.60% | -1,222 |
| Rio Arriba | 35.82% | 3,794 | 58.97% | 6,245 | 3.58% | 379 | 1.63% | 173 | -23.14% | -2,451 |
References[]
- ^ "1980 Presidential General Election Results – New Mexico". Dave Leip's Atlas of U.S. Presidential Elections. Retrieved 2018-02-11.
- ^ Jerry Lanson (2008-11-06). "A historic victory. A changed nation. Now, can Obama deliver?". Christian Science Monitor. Retrieved 2013-04-27.
- ^ Sullivan, Robert David; ‘How the Red and Blue Map Evolved Over the Past Century’; America Magazine in The National Catholic Review; June 29, 2016
| show State and district results of the 1980 United States presidential election |
|---|
- 1980 New Mexico elections
- United States presidential elections in New Mexico
- 1980 United States presidential election by state