Abbeville County, South Carolina
Abbeville County | |
|---|---|
U.S. county | |
 Abbeville County Courthouse | |
 Location within the U.S. state of South Carolina | |
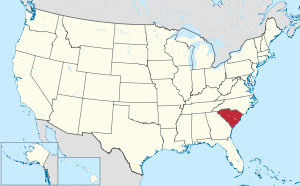 South Carolina's location within the U.S. | |
| Coordinates: 34°14′N 82°27′W / 34.23°N 82.45°W | |
| Country | |
| State | |
| Founded | March, 12, 1785 |
| Named for | Abbeville, France |
| Seat | Abbeville |
| Largest city | Abbeville |
| Area | |
| • Total | 511 sq mi (1,320 km2) |
| • Land | 490 sq mi (1,300 km2) |
| • Water | 21 sq mi (50 km2) 4.0% |
| Population (2010) | |
| • Total | 25,417 |
| • Estimate (2020)[1] | 24,467 |
| • Density | 50/sq mi (19/km2) |
| Time zone | UTC−5 (Eastern) |
| • Summer (DST) | UTC−4 (EDT) |
| Congressional district | 3rd |
| Website | www |

Abbeville County is a county located in the U.S. state of South Carolina. As of the 2010 census, its population was 25,417.[2] Its county seat is Abbeville.[3] It is the first county (or county equivalent) in the United States alphabetically. Abbeville County is traditionally included in the Upstate region of South Carolina. For a time, the county was included in the Greenwood, SC Micropolitan Statistical Area, but as of 2018 it was no longer included.[4]
History[]
Both Abbeville County and the county seat, Abbeville, get their name from the town of Abbeville, France, the native home of an early settler.[5][6] The county was originally part of Ninety-Six District, South Carolina, but was designated Abbeville County in 1785, with parts of the county later going to the creation of the counties of Greenwood and McCormick.[6] Abbeville County was settled by mostly Scotch Irish and French-Huguenot farmers in the mid-18th century.[6]
The Treaty of Dewitt's Corner, a historic peace negotiation with the Cherokee Indians, was signed in Dewitt's Corner (which is now known as Due West) in the county.[6] A a result of the treaty, the Cherokee tribe broke into two factions, one of which, the Chickamauga Cherokee, continued fighting area settlers for another 30 years.
Abbeville County was a hotbed of secession before the Civil War and was also where the last Confederate council of war was held[6]
In 1950 Abbeville County had a population of 22,456.[7]
Lynchings[]
This section is in list format but may read better as prose. (August 2019) |
There were nine documented lynchings in Abbeville, SC.
- Dave Roberts known as "David Roberts","Robert Dane", 1882.[8]
- Tut Danford, 1889.[9]
- Jake "Jacob" Davis, August 21, 1893.[10]
- Will Lawton, December 6, 1893.[11]
- James A. Nelson known as "James Macon","James Mason", 1894.[12]
- Allen Pendleton, 1905.[13]
- Will Lozier, 1915.[14]
- Anthony Crawford, a prominent landowner, farmer, businessman lynched for not selling his cotton at the price demanded. 1916.[15]
- Mark "Max" Smith, 1919.[16]
Geography[]
According to the U.S. Census Bureau, the county has a total area of 511 square miles (1,320 km2), of which 490 square miles (1,300 km2) is land and 21 square miles (54 km2) (4.0%) is water.[17] Abbeville County is in the Savannah River basin and the Saluda River basin.
Adjacent counties[]
- Greenville County - north
- Anderson County - north
- Laurens County - northeast
- Greenwood County - east
- McCormick County - southeast
- Elbert County, Georgia - west
Major highways[]
National protected area[]
- Sumter National Forest (part)
Demographics[]
| Historical population | |||
|---|---|---|---|
| Census | Pop. | %± | |
| 1790 | 9,197 | — | |
| 1800 | 13,553 | 47.4% | |
| 1810 | 21,156 | 56.1% | |
| 1820 | 23,167 | 9.5% | |
| 1830 | 28,149 | 21.5% | |
| 1840 | 29,351 | 4.3% | |
| 1850 | 32,318 | 10.1% | |
| 1860 | 32,385 | 0.2% | |
| 1870 | 31,129 | −3.9% | |
| 1880 | 40,815 | 31.1% | |
| 1890 | 46,854 | 14.8% | |
| 1900 | 33,400 | −28.7% | |
| 1910 | 34,804 | 4.2% | |
| 1920 | 27,139 | −22.0% | |
| 1930 | 23,323 | −14.1% | |
| 1940 | 22,931 | −1.7% | |
| 1950 | 22,456 | −2.1% | |
| 1960 | 21,417 | −4.6% | |
| 1970 | 21,112 | −1.4% | |
| 1980 | 22,627 | 7.2% | |
| 1990 | 23,862 | 5.5% | |
| 2000 | 26,167 | 9.7% | |
| 2010 | 25,417 | −2.9% | |
| 2020 (est.) | 24,467 | [18] | −3.7% |
| U.S. Decennial Census[19] 1790-1960[20] 1900-1990[21] 1990-2000[22] 2010-2013[2] | |||
2000 census[]
As of the census[23] of 2000, there were 26,167 people, 10,131 households, and 7,284 families living in the county. The population density was 52 people per square mile (20/km2). There were 11,656 housing units at an average density of 23 per square mile (9/km2). The racial makeup of the county was 68.33% White, 30.29% Black or African American, 0.10% Native American, 0.23% Asian, 0.03% Pacific Islander, 0.31% from other races, and 0.71% from two or more races. 0.83% of the population were Hispanic or Latino of any race. 22.1% were of American, 9.7% Irish, 6.7% English, 5.5% German and 5.3% Scotch-Irish ancestry according to Census 2000.
There were 10,131 households, out of which 31.70% had children under the age of 18 living with them, 52.20% were married couples living together, 15.30% had a female householder with no husband present, and 28.10% were non-families. 25.30% of all households were made up of individuals, and 11.30% had someone living alone who was 65 years of age or older. The average household size was 2.51 and the average family size was 3.00.
In the county, the population was spread out, with 25.30% under the age of 18, 9.50% from 18 to 24, 26.70% from 25 to 44, 23.80% from 45 to 64, and 14.70% who were 65 years of age or older. The median age was 37 years. For every 100 females there were 92.10 males. For every 100 females age 18 and over, there were 88.00 males.
The median income for a household in the county was $32,635, and the median income for a family was $38,847. Males had a median income of $30,452 versus $21,045 for females. The per capita income for the county was $15,370. About 10.10% of families and 13.70% of the population were below the poverty line, including 17.20% of those under age 18 and 16.90% of those age 65 or over.
2010 census[]
As of the 2010 United States Census, there were 25,417 people, 9,990 households, and 6,939 families living in the county.[24] The population density was 51.8 inhabitants per square mile (20.0/km2). There were 12,079 housing units at an average density of 24.6 per square mile (9.5/km2).[25] The racial makeup of the county was 69.6% white, 28.3% black or African American, 0.3% Asian, 0.2% American Indian, 0.4% from other races, and 1.1% from two or more races. Those of Hispanic or Latino origin made up 1.0% of the population.[24] In terms of ancestry, 14.7% were American, 10.9% were Irish, 9.7% were English, 7.6% were German, and 5.6% were Scotch-Irish.[26]
Of the 9,990 households, 31.5% had children under the age of 18 living with them, 49.2% were married couples living together, 15.3% had a female householder with no husband present, 30.5% were non-families, and 27.3% of all households were made up of individuals. The average household size was 2.45 and the average family size was 2.98. The median age was 41.6 years.[24]
The median income for a household in the county was $33,143 and the median income for a family was $45,147. Males had a median income of $39,217 versus $29,199 for females. The per capita income for the county was $16,653. About 16.3% of families and 20.7% of the population were below the poverty line, including 26.8% of those under age 18 and 16.2% of those age 65 or over.[27]
2020 census[]
| Race | Num. | Perc. |
|---|---|---|
| White (non-Hispanic) | 16,744 | 68.92% |
| Black or African American (non-Hispanic) | 6,184 | 25.45% |
| Native American | 44 | 0.18% |
| Asian | 71 | 0.29% |
| Pacific Islander | 7 | 0.03% |
| Other/Mixed | 822 | 3.38% |
| Hispanic or Latino | 423 | 1.74% |
As of the 2020 United States census, there were 24,295 people, 9,660 households, and 6,248 families residing in the county.
Education[]
School districts[]
Most Abbeville County schools are part of the Abbeville County School District.[29] The following schools are within the district:
- Abbeville County Adult Education[29]
- Abbeville High School (grades 9–12)[29]
- Abbeville County Career Center (supplementary career education - grades 10–12)[29]
- Cherokee Trail Elementary (grades K-7)[29]
- Diamond Hill Elementary (grades K-7)[29]
- Dixie High School (grades 8–12)[29]
- John C. Calhoun Elementary (grades K-5)[29]
- Long Cane Primary (grades K-2)[29]
- Westwood Elementary (grades 3–5)[29]
- Wright Middle School (grades 6–8)[29]
Other schools[]
- Calhoun Falls Charter School (part of the South Carolina Public Charter School District, whereby students from any part of the state may attend)
Colleges and universities[]
- Erskine College, a four-year Christian liberal arts college, with 575 undergraduates, is located in Due West, South Carolina
- Piedmont Technical College, hosts a branch campus in Abbeville, SC
Communities[]
City[]
- Abbeville (county seat)
Towns[]
- Calhoun Falls
- Donalds
- Due West
- Honea Path (mostly in Anderson County)
- Lowndesville
- Ware Shoals (mostly in Greenwood County, partly in Laurens County)
Census-designated places[]
Notable residents[]

- John C. Calhoun, (1782–1850), born in the Abbeville District, United States Congressman and United States Senator from South Carolina, Secretary of War, Secretary of State, and Vice President of the United States[30]
- Langdon Cheves, (1776–1857), born in Abbeville County at Rocky River, banker and United States Congressman from South Carolina[30]
- Francis Alanson Cunningham, (1804–1864), born in the Abbeville District, physician and United States Congressman from Ohio[30]
- Joshua Hill, (1812–1891), born in the Abbeville District, United States Senator from Georgia[30]
- Abner Smith Lipscomb, (1816–1890), born in the Abbeville District, member of the Alabama Legislature and Supreme Court Justice of both Alabama and Texas.[30]
- Anthony Crawford, (ca. 1865 – October 21, 1916), Prominent landowner, farmer and businessman who was lynched for not selling his cotton at the price demanded.
- James L. Petigru, (1789–1863), born in the Abbeville District, was the attorney general of South Carolina and a member of the South Carolina House of Representatives. He was the leader of the anti-nullificationalists in the state house.[30]
- Thomas D. Howie, (1908-1944), was an American army officer, killed during the Battle of Normandy during World War II, while trying to capture the French town of Saint-Lô. He is known as "The Major of St. Lo".
- Leomont Evans, (born 1974), is a former American football player in the NFL and the first iteration of the XFL.[31]
Government[]
Bryan McClain is the chairman of the Abbeville County Council, who also represents District 7.[32] The other members and their districts are as following:
- Charlie Stone- District 1[32]
- John Calhoun- District 2[32]
- Claude Thomas- District 3[32]
- William Norris- District 4[32]
- Oscar Klugh- District 5[32]
- Don Campbell- District 6[32]
Law enforcement[]
In 2013, long-time Abbeville County Sheriff Charles Goodwin pled guilty to misconduct in office. He was put on probation for five years, sentenced to 100 hours of community service, and ordered to pay $4,500 in restitution.[33]
Politics[]
Abbeville County was a typical "Solid South" county in its voting patterns until 1948 when it voted for Dixiecrat candidate and South Carolina native Strom Thurmond against Democratic candidate Harry Truman regarding his support for Civil Rights, most importantly racial integration. It resumed voting Democratic until 1968 when a majority voted for American Independent Party candidate & southern segregationist George Wallace. In 1972 the county voted overwhelmingly for Richard Nixon, and since then Abbeville has showed strong endorsement towards the Republican Party. The last Democrat to carry Abbeville County was Bill Clinton in 1992 and 1996.
| Year | Republican | Democratic | Third parties |
|---|---|---|---|
| 2020 | 66.1% 8,215 | 33.0% 4,101 | 0.9% 117 |
| 2016 | 62.8% 6,763 | 34.7% 3,741 | 2.5% 271 |
| 2012 | 56.1% 5,981 | 42.6% 4,543 | 1.4% 147 |
| 2008 | 56.9% 6,264 | 41.8% 4,593 | 1.3% 144 |
| 2004 | 54.8% 5,436 | 44.2% 4,389 | 1.0% 100 |
| 2000 | 53.1% 4,450 | 45.0% 3,766 | 1.9% 158 |
| 1996 | 43.0% 3,054 | 49.2% 3,493 | 7.8% 553 |
| 1992 | 39.8% 3,317 | 47.6% 3,968 | 12.7% 1,058 |
| 1988 | 50.5% 3,738 | 49.0% 3,629 | 0.5% 34 |
| 1984 | 55.2% 3,798 | 44.4% 3,051 | 0.4% 26 |
| 1980 | 35.6% 2,361 | 61.1% 4,049 | 3.3% 222 |
| 1976 | 27.5% 1,791 | 72.1% 4,700 | 0.5% 31 |
| 1972 | 69.0% 3,266 | 28.5% 1,349 | 2.6% 122 |
| 1968 | 20.8% 1,213 | 24.4% 1,425 | 54.8% 3,201 |
| 1964 | 35.0% 1,448 | 65.0% 2,689 | |
| 1960 | 21.6% 845 | 78.4% 3,064 | |
| 1956 | 9.5% 339 | 83.4% 2,985 | 7.2% 257 |
| 1952 | 25.9% 970 | 74.1% 2,776 | |
| 1948 | 2.2% 23 | 23.9% 254 | 74.0% 787 |
| 1944 | 2.3% 19 | 96.3% 789 | 1.3% 11 |
| 1940 | 3.1% 32 | 96.9% 1,007 | |
| 1936 | 1.8% 23 | 98.2% 1,265 | |
| 1932 | 0.8% 9 | 99.2% 1,184 | 0.1% 1 |
| 1928 | 6.0% 65 | 94.0% 1,020 | |
| 1924 | 2.6% 19 | 92.4% 681 | 5.0% 37 |
| 1920 | 1.5% 13 | 98.5% 868 | |
| 1916 | 0.9% 8 | 98.8% 900 | 0.3% 3 |
| 1912 | 0.8% 9 | 98.8% 1,095 | 0.4% 4 |
| 1904 | 3.1% 21 | 96.9% 665 | |
| 1900 | 0.6% 8 | 99.4% 1,366 |
See also[]
- National Register of Historic Places listings in Abbeville County, South Carolina
- Cedar Springs Historic District
- Lake Russell
References[]
- ^ "Population and Housing Unit Estimates". U.S. Census Bureau. July 30, 2019. Retrieved July 30, 2019.
- ^ a b "State & County QuickFacts". United States Census Bureau. Archived from the original on June 6, 2011. Retrieved November 22, 2013.
- ^ "Find a County". National Association of Counties. Archived from the original on May 9, 2015. Retrieved June 7, 2011.
- ^ "OMB Bulletin No. 18-04: Revised Delineations of Metropolitan Statistical Areas, Micropolitan Statistical Areas, and Combined Statistical Areas, and Guidance on Uses of the Delineations of These Areas" (PDF). United States Office of Management and Budget. September 14, 2018. Retrieved June 21, 2019.
- ^ Federal Writers' Project (1941). Palmetto Place Names. Sloane printing co. p. 11.
- ^ a b c d e Mary Morgan (March 19, 2007). "Abbeville County". Archived from the original on August 20, 2007. Retrieved October 15, 2007.
- ^ Encyclopædia Britannica Atlas, 1959 Edition, p. 298
- ^ "CSDE Lynching Database". lynching.csde.washington.edu. Retrieved September 9, 2017.
- ^ "CSDE Lynching Database". lynching.csde.washington.edu. Retrieved September 9, 2017.
- ^ "CSDE Lynching Database". lynching.csde.washington.edu. Retrieved September 9, 2017.
- ^ "CSDE Lynching Database". lynching.csde.washington.edu. Retrieved September 9, 2017.
- ^ "CSDE Lynching Database". lynching.csde.washington.edu. Retrieved September 9, 2017.
- ^ "CSDE Lynching Database". lynching.csde.washington.edu. Retrieved September 9, 2017.
- ^ "CSDE Lynching Database". lynching.csde.washington.edu. Retrieved September 9, 2017.
- ^ "CSDE Lynching Database". lynching.csde.washington.edu. Retrieved September 9, 2017.
- ^ "CSDE Lynching Database". lynching.csde.washington.edu. Retrieved September 9, 2017.
- ^ "2010 Census Gazetteer Files". United States Census Bureau. August 22, 2012. Retrieved March 15, 2015.
- ^ "Population and Housing Unit Estimates". Retrieved July 30, 2019.
- ^ "U.S. Decennial Census". United States Census Bureau. Retrieved March 15, 2015.
- ^ "Historical Census Browser". University of Virginia Library. Retrieved March 15, 2015.
- ^ Forstall, Richard L., ed. (March 27, 1995). "Population of Counties by Decennial Census: 1900 to 1990". United States Census Bureau. Retrieved March 15, 2015.
- ^ "Census 2000 PHC-T-4. Ranking Tables for Counties: 1990 and 2000" (PDF). United States Census Bureau. April 2, 2001. Retrieved March 15, 2015.
- ^ "U.S. Census website". United States Census Bureau. Retrieved May 14, 2011.
- ^ a b c "DP-1 Profile of General Population and Housing Characteristics: 2010 Demographic Profile Data". United States Census Bureau. Archived from the original on February 13, 2020. Retrieved March 9, 2016.
- ^ "Population, Housing Units, Area, and Density: 2010 - County". United States Census Bureau. Archived from the original on February 13, 2020. Retrieved March 9, 2016.
- ^ "DP02 SELECTED SOCIAL CHARACTERISTICS IN THE UNITED STATES – 2006-2010 American Community Survey 5-Year Estimates". United States Census Bureau. Archived from the original on February 13, 2020. Retrieved March 9, 2016.
- ^ "DP03 SELECTED ECONOMIC CHARACTERISTICS – 2006-2010 American Community Survey 5-Year Estimates". United States Census Bureau. Archived from the original on February 13, 2020. Retrieved March 9, 2016.
- ^ "Explore Census Data". data.census.gov. Retrieved December 14, 2021.
- ^ a b c d e f g h i j k "Abbeville County School District Listing". Retrieved November 10, 2011.
- ^ a b c d e f Who Was Who in America, Historical Volume, 1607-1896. Chicago: Marquis Who's Who. 1963.
- ^ "Leomont Evans returns to Canton — site of scary injury — for Dawkins' induction | Sports | indexjournal.com".
- ^ a b c d e f g "County Council". Retrieved November 10, 2011.
- ^ Mitch Weiss (January 18, 2013). "Former sheriff pleads guilty". Post and Courier. Retrieved November 9, 2021.
- ^ Leip, David. "Dave Leip's Atlas of U.S. Presidential Elections". uselectionatlas.org. Retrieved March 13, 2018.
External links[]
 Media related to Abbeville County, South Carolina at Wikimedia Commons
 Geographic data related to Abbeville County, South Carolina at OpenStreetMap
- Abbeville County's Official Website
- Abbeville County Development Board
- Greater Abbeville Chamber of Commerce
- Abbeville County Confederate Monument
Places adjacent to Abbeville County, South Carolina | ||||||||||||||||
|---|---|---|---|---|---|---|---|---|---|---|---|---|---|---|---|---|
| ||||||||||||||||
Municipalities and communities of Abbeville County, South Carolina, United States | ||
|---|---|---|
County seat: Abbeville | ||
| City |
|  |
| Towns | ||
| CDPs | ||
| Footnotes | ‡This populated place also has portions in an adjacent county or counties | |
| ||
Columbia (capital) | ||
| Regions |
| |
| Larger cities |
| |
| Smaller cities |
| |
| Towns |
| |
| CDPs | ||
| Counties |
| |
| Topics |
| |
| Society |
| |
Authority control | |
|---|---|
| General | |
| Other | |
- South Carolina counties
- Abbeville County, South Carolina
- 1785 establishments in South Carolina
- Populated places established in 1785