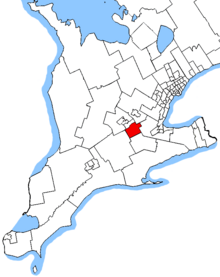
Cambridge electoral district Cambridge in relation to other federal electoral districts in southwestern Ontario (2003 boundaries)
Legislature House of Commons MP Bryan May Liberal District created 1976 First contested 1979 Last contested 2019 District webpage profile , map Population (2011 )[1] 111,693 Electors (2015)82,103 Area (km²)[2] 373 Pop. density (per km²) 299.4 Census division(s) Brant , Waterloo Census subdivision(s) Brant , Cambridge , North Dumfries
Cambridge is a federal electoral district in Ontario , Canada, that has been represented in the House of Commons of Canada since 1979.
Geography [ ] The district consists of most of the city of Cambridge, Ontario (the portion of it south of Highway 401 ), the entirety of the Township of North Dumfries, Ontario , and a portion of northern Brant County .[3]
History [ ] The federal electoral district was created in 1976 and consisted of the city of Cambridge and the Township of North Dumfries. In 1987, part of the city of Kitchener was added to the district. In 1996, the boundaries were redrawn again to include a slightly different section of Kitchener. The current boundaries, which are the same as the original definition and contain no parts of Kitchener, were defined in 2003.
This riding lost territory to Kitchener South—Hespeler and gained some territory from Brant during the 2012 electoral redistribution .
Members of Parliament [ ]
Parliament
Years
Member
Party
CambridgeRiding created from Waterloo—Cambridge and Wellington
31st
1979–1980 Chris Speyer Progressive Conservative 32nd
1980–1984 33rd
1984–1988 34th
1988–1993 Pat Sobeski 35th
1993–1997 Janko Peric Liberal 36th
1997–2000 37th
2000–2004 38th
2004–2006 Gary Goodyear Conservative 39th
2006–2008 40th
2008–2011 41st
2011–2015 42nd
2015–2019 Bryan May Liberal 43rd
2019–present
Election results [ ] Graph of election results in Cambridge (minor parties that never got 2% of the vote or didn't run consistently are omitted)
hide 2021 Canadian federal election
The 2021 general election will be held on September 20.
Party
Candidate
Votes
%
Green Michele Braniff
New Democratic Lorne Bruce
Conservative Connie Cody
Liberal Bryan May
People's Maggie Segounis
Total valid votes
Total rejected ballots
Turnout
Eligible voters
Source: Elections Canada [4]
hide 2019 Canadian federal election
Party
Candidate
Votes
%
Expenditures
Liberal Bryan May 22,903
39.53
-3.64
$79,674.15
Conservative Sunny Attwal
17,409
30.04
-8.6
none listed
New Democratic Scott Hamilton
11,177
19.29
+5.42
$23,049.68
Green Michele Braniff
4,343
7.5
+4.27
$7,369.06
People's David Haskell
1,872
3.23
–
$7,178.82
George McMorrow
162
0.28
–
$0.00
Marxist–Leninist Manuel Couto
76
0.13
-0.07
$0.00
Total valid votes/Expense limit
57,942 100.0
Total rejected ballots
385
Turnout
58,327 64.9
Eligible voters
89,914
Liberal hold
Swing
+2.48
Source: Elections Canada [5] [6]
hide 2015 Canadian federal election
Party
Candidate
Votes
%
Expenditures
Liberal Bryan May 23,024
43.17
+27.72
$57,941.86
Conservative Gary Goodyear 20,613
38.65
-14.10
$73,286.38
New Democratic Bobbi Stewart
7,397
13.87
-14.04
$10,151.06
Green Michele Braniff
1,723
3.23
-0.37
$1,074.94
Independent Lee Sperduti
474
0.89
–
$9,550.00
Marxist–Leninist Manuel Couto
108
0.20
–
Total valid votes/Expense limit
53,339 100.00 $219,622.08
Total rejected ballots
227 0.42 –
Turnout
53,566 64.60 –
Eligible voters
82,916
Liberal gain from Conservative
Swing
+20.91
Source: Elections Canada [7] [8]
2011 federal election redistributed results[9]
Party
Vote
%
Conservative 23,644
52.74
New Democratic 12,512
27.91
Liberal 6,923
15.44
Green 1,615
3.60
Others
134
0.30
hide 2011 Canadian federal election
Party
Candidate
Votes
%
Expenditures
Conservative Gary Goodyear 29,394
53.40
+4.78
$86,966.51
New Democratic Susan Galvao
15,238
27.68
+8.07
$13,379.43
Liberal Bryan May 8,285
15.05
-8.34
$26,622.63
Green Jacques Malette
1,978
3.59
-4.76
$440.18
Marxist–Leninist Manuel Couto
153
0.28
–
none listed
Total valid votes/Expense limit
55,048 100.00 $96,491.18
Total rejected ballots
255 0.46 +0.04
Turnout
55,303 59.25 +3.33
Eligible voters
93,335 – –
hide 2008 Canadian federal election
Party
Candidate
Votes
%
Expenditures
Conservative Gary Goodyear 24,895
48.62
+4.78
$83,772
Liberal Gord Zeilstra
11,977
23.39
-10.21
$8,316
New Democratic Max Lombardi
10,044
19.61
+2.67
$12,035
Green Scott Cosman
4,279
8.35
+3.13
$1,614
Total valid votes/Expense limit
51,195 100.00 $93,018
Total rejected ballots
217 0.42 +0.06
Turnout
51,412 55.92 -9.05
hide 2006 Canadian federal election
Party
Candidate
Votes
%
Conservative Gary Goodyear 25,337
43.84
+5.9
Liberal Janko Peric 19,419
33.60
−3.1
New Democratic Donna Reid
9,794
16.94
−3.3
Green Gareth White
3,017
5.22
+0.2
Canadian Action David Pelly
217
0.37
Total valid votes
57,784 100.00
Total rejected ballots
207 0.36
Turnout
57,991 64.97
hide 2004 Canadian federal election
Party
Candidate
Votes
Conservative Gary Goodyear 19,123
Liberal Janko Peric 18,899
New Democratic Gary Price
10,392
Green Gareth White
2,506
Christian Heritage John Gots
395
Independent John Oprea
134
Independent Alec Gryc
114
Total valid votes
Total rejected ballots
Turnout
Electors on lists
hide 2000 Canadian federal election
Party
Candidate
Votes
%
Liberal Janko Peric 22,148
46.6
+9.9
Alliance Reg Petersen
14,915
31.4
+9.0
Progressive Conservative John Housser
5,988
12.6
-6.7
New Democratic Pam Wolf
4,111
8.6
-11.8
Natural Law Thomas Mitchell
210
0.4
Independent John Gots
160
0.3
Total valid votes
47,532 100.0
Note: Canadian Alliance vote is compared to the Reform vote in 1997 election.
hide 1997 Canadian federal election
Party
Candidate
Votes
%
Expenditures
Liberal Janko Peric 17,673
36.74
−2.52
$47,605
Reform Bill Donaldson
10,767
22.38
−11.15
$57,325
New Democratic Mike Farnan 9,813
20.40
+15.11
$53,588
Progressive Conservative Larry Olney
9,299
19.33
+1.99
$48,139
Independent John H. Long 311
0.65
$0
Independent Jim Remnant
237
0.49
$0
Total valid votes
48,100 100.00
Total rejected ballots
254
Turnout
48,354 64.77 −1.75
Electors on the lists
74,659
Percentage change figures are factored for redistribution.
Sources: Official Results, Elections Canada and Financial Returns, Elections Canada .
hide 1993 Canadian federal election
Party
Candidate
Votes
%
Liberal Janko Peric 21,997
39.1
+12.3
Reform Reg Petersen
18,932
33.7
Progressive Conservative Pat Sobeski 9,776
17.4
-23.0
New Democratic Bill McBain
2,962
5.3
-22.8
National Ron Cooper
1,804
3.2
Christian Heritage Michael Picard
407
0.7
-3.8
Natural Law Thomas Mitchell
370
0.7
Total valid votes
56,248 100.0
hide 1988 Canadian federal election
Party
Candidate
Votes
%
Progressive Conservative Pat Sobeski 20,578
40.4
-20.2
New Democratic Bruce Davidson
14,298
28.1
+3.9
Liberal Ron Cooper
13,639
26.8
+12.1
Christian Heritage Rien Vanden Enden
2,305
4.5
Independent Shafiq Hudda
141
0.3
Total valid votes
50,961 100.0
hide 1980 Canadian federal election
Party
Candidate
Votes
%
Progressive Conservative Chris Speyer 14,314
39.4
-4.2
New Democratic Mike Farnan 11,346
31.2
+1.7
Liberal David Charlton
10,531
29.0
+2.6
Social Credit Regent Gervais
103
0.3
-0.1
Marxist–Leninist Anna Di Carlo
82
0.2
0.0
Total valid votes
36,376 100.0
hide 1979 Canadian federal election
Party
Candidate
Votes
%
Progressive Conservative Chris Speyer 16,337
43.5
New Democratic Marc Sommerville
11,085
29.5
Liberal Lee Palvetzian
9,903
26.4
Social Credit Regent Gervais
150
0.4
Marxist–Leninist Anna Di Carlo
78
0.2
Total valid votes
37,553 100.0
See also [ ] References [ ] Notes [ ] show Federal ridings in Midwestern Ontario
Liberal Conservative
show Federal ridings in Ontario
Central Eastern S Durham
City of Toronto Suburbs & Downtown )
Cities of Brampton &
Brampton
Brampton Centre Brampton East Brampton North Brampton South Brampton West Mississauga
Southern
Southwestern Halton City of Hamilton Niagara
Niagara Centre Niagara Falls Niagara West St. Catharines
Midwestern Northern Southwestern Ottawa See also : Provincial ridings in Ontario
show Historical federal ridings in Ontario
Until 2015 Until 2006 Until 2004 Until 2000 Until 1997 Until 1993 Until 1988 Until 1984 Until 1979 Until 1974 Until 1972 Until 1968 Until 1953 Until 1949 Until 1935 Until 1925 Until 1917 Until 1904 Until 1896 Until 1882
Coordinates : 43°20′53″N 80°20′06″W / 43.348°N 80.335°W / 43.348; -80.335