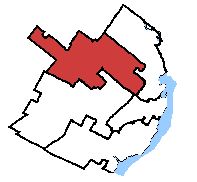
Charlesbourg—Haute-Saint-Charles electoral district Charlesbourg—Haute-Saint-Charles in relation to other Quebec City federal electoral districts (2003 boundaries).
Legislature House of Commons MP Pierre Paul-Hus Conservative District created 1976 First contested 1979 Last contested 2019 District webpage profile , map Population (2016 )[1] 107,254 Electors (2019)85,804 Area (km²)[2] 118 Pop. density (per km²) 908.9 Census division(s) Quebec City Census subdivision(s) Quebec City
Charlesbourg—Haute-Saint-Charles (formerly Charlesbourg and Charlesbourg—Jacques Cartier ) is a federal electoral district in Quebec , Canada, that has been represented in the House of Commons of Canada since 1979.
Geography [ ] The riding, in the Quebec region of Capitale-Nationale , consists of the northeast part of Quebec City , including the borough of Charlesbourg and the eastern portion of La Haute-Saint-Charles (Saint-Émile and Lac-Saint-Charles ).
The neighbouring ridings are Québec , Louis-Saint-Laurent , Portneuf—Jacques-Cartier , and Beauport—Limoilou .
Demographics [ ] According to the Canada 2011 Census [3] Ethnic groups: 95.3% White, 2.9% Indigenous, 1.8% OtherLanguages: 96.8% French, 1.1% English, 2.1% OtherReligions: 88.7% Christian, 0.8% Other, 10.5% NoneMedian income: $32,861 (2010) Average income: $36,940 (2010)
History [ ] Charlesbourg was created in 1976 from parts of Portneuf and Montmorency . It was renamed Charlesbourg—Jacques-Cartier in 2000 and abolished in 2003, at which point a new Charlesbourg riding was created. After the federal election in 2004, it was renamed Charlesbourg—Haute-Saint-Charles .
The riding gained a small fraction of territory from Louis-Saint-Laurent from the 2012 electoral redistribution .
Members of Parliament [ ] This riding has elected the following members of the House of Commons of Canada :
Election results [ ] Charlesbourg—Haute-Saint-Charles 2004 - present [ ]
hide 2021 Canadian federal election
Party
Candidate
Votes
%
Expenditures
Liberal René-Paul Coly
People's Wayne Cyr
New Democratic Michel Marc Lacroix
Bloc Québécois Marie-Christine Lamontagne
Green Jacques Palardy-Dion
Conservative Pierre Paul-Hus
Free Daniel Pelletier
Total valid votes
Total rejected ballots
Turnout
Registered voters
Source: Elections Canada [4]
hide 2019 Canadian federal election
Party
Candidate
Votes
%
Expenditures
Conservative Pierre Paul-Hus 22,484
38.05
-4.19
$55,938.52
Bloc Québécois Alain D'Eer
16,053
27.16
+14.84
none listed
Liberal René-Paul Coly
12,584
21.29
-1.92
$25,312.84
New Democratic Guillaume Bourdeau
4,554
7.71
-12.36
none listed
Green Samuel Moisan-Domm
2,042
3.46
+1.30
$6,186.85
People's Joey Pronovost
1,379
2.33
-
none listed
Total valid votes/Expense limit
59,096 97.91
Total rejected ballots
1,264 2.09 +0.63
Turnout
60,360 70.25 +0.55
Eligible voters
85,926
Conservative hold
Swing
-9.52
Source: Elections Canada [5] [6]
hide 2015 Canadian federal election
Party
Candidate
Votes
%
Expenditures
Conservative Pierre Paul-Hus 24,608
42.24
+11.95
$64,105.10
Liberal Jean Côté
13,525
23.22
+16.69
$19,339.48
New Democratic Anne-Marie Day 11,690
20.07
-24.92
$23,012.10
Bloc Québécois Marc Antoine Turmel
7,177
12.32
-3.96
$16,642.76
Green Nathalie Baudet
1,256
2.16
+0.6
–
Total valid votes/Expense limit
58,256 98.54 $222,590.66
Total rejected ballots
866 1.46 –
Turnout
59,122 69.69 –
Eligible voters
84,830
Conservative gain from New Democratic
Swing
+18.44
Source: Elections Canada [7] [8]
2011 federal election redistributed results[9]
Party
Vote
%
New Democratic 24,197
44.99
Conservative 16,288
30.29
Bloc Québécois 8,756
16.28
Liberal 3,512
6.53
Green 837
1.56
Others
189
0.35
hide 2011 Canadian federal election
Party
Candidate
Votes
%
Expenditures
New Democratic Anne-Marie Day 24,131
45.0
+31.9
Conservative Daniel Petit 16,220
30.3
-10.8
Bloc Québécois Félix Grenier
8,732
16.3
-12.9
Liberal Martine Gaudreault
3,505
6.5
-7.6
Green Simon Verret
832
1.6
-0.9
Christian Heritage Simon Cormier
189
0.4
-
Total valid votes/Expense limit
53,609 100.0
Total rejected ballots
801 1.5 -0.1
Turnout
54,410 66.2 +2.5 –
Eligible voters
82,140 – –
hide 2008 Canadian federal election
Party
Candidate
Votes
%
Expenditures
Conservative Daniel Petit 20,566
41.14
+0.1
$40,863
Bloc Québécois Denis Courteau
14,602
29.21
-9.1
$58,190
Liberal Denise Legros
7,039
14.08
+5.3
$14,902
New Democratic Anne-Marie Day
6,542
13.08
+6.9
$3,986
Green François Bédard
1,231
2.46
-0.1
$0
Total valid votes/Expense limit
49,980 100.0 $85,288
Rejected ballots
811 1.6
Turnout
50,791 63.66
hide 2006 Canadian federal election
Party
Candidate
Votes
%
Expenditures
Conservative Daniel Petit 20,406
41.0
+26.3
$53,716
Bloc Québécois Richard Marceau
19,034
38.3
-9.8
$63,223
Liberal Valérie Giguère
4,364
8.8
-15.2
$24,547
New Democratic Isabelle Martineau
3,084
6.2
+2.9
$0
Independent Daniel Pelletier
1,567
3.2
–
$2,056
Green Les Parsons
1,262
2.5
+0.1
$0
Total valid votes/Expense limit
49,717 100.0 $78,519
Charlesbourg 2003 - 2004 [ ]
hide 2004 Canadian federal election
Party
Candidate
Votes
%
Expenditures
Bloc Québécois Richard Marceau 23,886
48.0
+9.7
$73,605
Liberal Jean-Marie Laliberté
11,911
24.0
-12.9
$60,346
Conservative Bertrand Proulx
7,306
14.7
-6.4
$8,784
New Democratic François Villeneuve
1,623
3.3
+1.5
$2,581
Green Marilou Moisan-Domm
1,188
2.4
+0.4
Marijuana Benjamin Kasapoglu
376
0.8
New
Total valid votes/Expense limit
46,290 98.0 – $76,602
Total rejected ballots
961 2.0 -1.0
Turnout
47,251 62.3 -5.8
Eligible voters
75,827 – –
Bloc Québécois hold
Swing
+11.3
Change from 2000 is based on redistributed results. Conservative Party change is based on the total of Canadian Alliance and Progressive Conservative Party votes.
Charlesbourg—Jacques-Cartier 2000 - 2004 [ ]
hide 2000 Canadian federal election
Party
Candidate
Votes
%
Bloc Québécois Richard Marceau 21,867
38.3
Liberal Isabelle Thivierge
21,045
36.9
Alliance Gérard Latulippe 8,801
15.4
Progressive Conservative Dann Murray
3,256
5.7
Green Samuel Moisan-Domm
1,136
2.0
New Democratic Françoise Dicaire
1,000
1.8
Total valid votes/Expense limit
57,105 97.3
Total rejected ballots
1,747 3.0
Turnout
58,852 68.1
Eligible voters
86,361
Source: Elections Canada [10]
Charlesbourg 1979 - 2000 [ ]
hide 1993 Canadian federal election
Party
Candidate
Votes
Bloc Québécois Jean-Marc Jacob 38,327
Liberal Michel Renaud
15,084
Progressive Conservative Monique B. Tardif 8,032
Natural Law Michel Audy
1,743
New Democratic Gaston Juneau
1,446
Abolitionist Nelson Lejeune
323
hide 1979 Canadian federal election
Party
Candidate
Votes
Liberal Pierre Bussieres 40,796
Social Credit Louis Leclerc
10,461
Progressive Conservative Robert B. Lafreniere
5,860
New Democratic Jean Bernard Jobin
3,784
Union populaire Henri Laberge
948
See also [ ] References [ ] Notes [ ] show Historical federal ridings in Quebec
Until 2015 Until 2006 Until 2004 Until 2000 Until 1997 Until 1993 Until 1988 Until 1984 Until 1980 Until 1979 Until 1974 Until 1972 Until 1968 Until 1962 Until 1953 Until 1949 Until 1935 Until 1925 Until 1917 Before 1900
Coordinates : 46°54′00″N 71°18′25″W / 46.900°N 71.307°W / 46.900; -71.307