Federal electoral district in Quebec, Canada
"Portneuf (electoral district)" redirects here. For the provincial electoral district, see
Portneuf (provincial electoral district) . For the pre-Confederation electoral district, see
Portneuf (Province of Canada electoral district) .
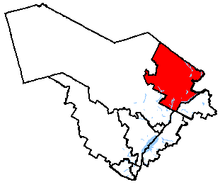
Portneuf—Jacques-Cartier electoral district Portneuf—Jacques-Cartier in relation to other Quebec federal electoral districts
Legislature House of Commons MP Joël Godin Conservative District created 1867 First contested 1867 Last contested 2021 District webpage profile , map Population (2011 )[1] 104,394 Electors (2015)86,884 Area (km²)[2] 7,617 Pop. density (per km²) 13.7 Census division(s) La Jacques-Cartier , Portneuf , Quebec City Census subdivision(s) Cap-Santé , Donnacona , Fossambault-sur-le-Lac , Lac-Delage , Lac-Saint-Joseph , Lac-Sergent , Neuville , Pont-Rouge , Portneuf , Saint-Augustin-de-Desmaures , Saint-Basile , Saint-Marc-des-Carrières , Saint-Raymond , Sainte-Catherine-de-la-Jacques-Cartier
Portneuf—Jacques-Cartier (formerly known as Portneuf ) is a federal electoral district in Quebec , Canada, that has been represented in the House of Commons of Canada since 1867. Its population in 2001 was 87,141.
Demographics [ ] Ethnic groups: 99.1% WhiteLanguages: 97.0% French, 2.0% English Religions: 94.0% Catholic, 1.4% Protestant, 4.2% no religious affiliation Average income: $28,030
Geography [ ] The district includes the Regional County Municipalities of Portneuf and La Jacques-Cartier as well as the municipality of Saint-Augustin-de-Desmaures . The main communities are Saint-Augustin-de-Desmaures, Donnacona , Lac-Beauport , Neuville , Pont-Rouge , Shannon , Stoneham-et-Tewkesbury , Saint-Raymond , Sainte-Catherine-de-la-Jacques-Cartier , and Deschambault-Grondines . Its area is 7,617 km2 .
History [ ] The electoral district was created in the British North America Act of 1867 as "Portneuf". It was renamed "Portneuf—Jacques-Cartier" on 1 September 2004.
The Conservative Party did not run a candidate in Portneuf—Jacques-Cartier in the 2008 and 2011 elections as incumbent independent André Arthur was a self-described libertarian who consistently voted with and supported the Conservative Party in the House of Commons.
There were no changes to this riding during the 2012 electoral redistribution .
Members of Parliament [ ] This riding has elected the following members of the House of Commons of Canada :
Election results [ ] Portneuf—Jacques-Cartier [ ]
2021 Canadian federal election
Party
Candidate
Votes
%
Expenditures
Conservative Joël Godin 33,657
51.6
+8.1
Bloc Québécois Christian Hébert
15,525
23.8
-0.5
Liberal Sani Diallo
10,068
15.4
-4.5
New Democratic David-Roger Gagnon
3,223
4.9
-0.9
People's Nash Mathieu
1,615
2.5
-0.5
Free Charle Fiset
638
1.0
N/A
Rhinoceros Tommy Pelletier
490
0.8
N/A
Total valid votes
65,216 98.4
Total rejected ballots
1,034 1.6
Turnout
66,250 69.0
Eligible voters
96,079
Conservative hold
Swing
+4.3
Source: Elections Canada [3]
2019 Canadian federal election
Party
Candidate
Votes
%
Expenditures
Conservative Joël Godin 28,110
43.46
-0.51
$37,463.57
Bloc Québécois Mathieu Bonsaint
15,707
24.29
+13.55
$10,147.81
Liberal Annie Talbot
12,876
19.91
-1.56
$41,965.44
New Democratic David-Roger Gagnon
3,758
5.81
-16.24
$427.26
Green Marie-Claude Gaudet
2,308
3.57
+1.8
$706.74
People's Luca Abbatiello
1,915
2.96
–
$3,814.48
Total valid votes/expense limit
64,674 100.0
Total rejected ballots
1,251 1.90 +0.51
Turnout
65,925 70.94 -1.39
Eligible voters
92,931
Conservative hold
Swing
-7.03
Source: Elections Canada [4] [5]
2015 Canadian federal election
Party
Candidate
Votes
%
Expenditures
Conservative Joël Godin 27,290
43.97
+16.2
$71,670.38
New Democratic Élaine Michaud 13,686
22.05
-20.6
$76,976.38
Liberal David Gauvin
13,322
21.47
+14.9
$48,792.76
Bloc Québécois Raymond Harvey
6,665
10.74
-9.8
$11,313.73
Green Johanne Morin
1,096
1.77
-0.6
–
Total valid votes/Expense limit
62,059 100.0 $227,576.17
Total rejected ballots
781 1.39 –
Turnout
62,840 72.33 –
Eligible voters
86,884
Conservative gain from New Democratic
Swing
+18.4*
Source: Elections Canada [6] [7] Swing is taken from André Arthur , an independent candidate supported by the Conservatives in the last election.
2011 Canadian federal election
Party
Candidate
Votes
%
Expenditures
New Democratic Élaine Michaud 22,387
42.7
+30.0
Independent André Arthur 14,594
27.8
-5.8
Bloc Québécois Richard Côté
10,745
20.5
-11.5
Liberal Réjean Thériault
3,463
6.6
-9.7
Green Claudine Delorme
1,279
2.4
-1.2
Total valid votes/Expense limit
52,468 100.0
Total rejected ballots
946 1.8 -0.6
Turnout
53,414 66.2 +5.4
Eligible voters
80,694 – –
2008 Canadian federal election
Party
Candidate
Votes
%
Expenditures
Independent André Arthur 15,063
33.5
-6.4
$8,458
Bloc Québécois Richard Côté
14,401
32.0
+6.1
$41,700
Liberal Stéphane Asselin
7,320
16.3
+11.4
$4,855
New Democratic André Turgeon
5,707
12.7
+8.8
$1,955
Green Nathan John Weatherdon
1,452
3.2
+0.4
Independent Jean Paradis
1,039
2.3
–
$1,833
Total valid votes/Expense limit
44,982 100.0 $85,693
Total rejected ballots
1,113 2.4
Turnout
46,095 60.8
Independent hold
Swing
-6.2
2006 Canadian federal election
Party
Candidate
Votes
%
Expenditures
Independent André Arthur 20,158
39.8
–
$1,093
Bloc Québécois Guy Côté 13,094
25.9
-17.0
$47,797
Conservative Howard Bruce
11,472
22.7
+1.2
$60,326
Liberal Gilles Landry
2,489
4.9
-22.6
$16,487
New Democratic Jean-Marie Fiset
1,956
3.9
+0.3
$1,579
Green Jérôme Beaulieu
1,431
2.8
-1.6
Total valid votes/Expense limit
50,600 100.0 $79,151
Portneuf [ ]
2004 Canadian federal election
Party
Candidate
Votes
%
Expenditures
Bloc Québécois Guy Côté 18,471
42.9
+7.7
$38,181
Liberal (x)Claude Duplain
11,863
27.6
-13.2
$52,428
Conservative Howard M. Bruce
9,251
21.5
-2.5
$16,810
Green Pierre Poulin
1,925
4.5
–
$265
New Democratic Jean-François Breton
1,540
3.6
–
Total valid votes/Expense limit
43,050 100.0 $76,720
Note: Conservative vote is compared to the total of the Canadian Alliance vote and Progressive Conservative vote in 2000 election.
2000 Canadian federal election
Party
Candidate
Votes
%
Liberal Claude Duplain 17,877
40.8
+11.3
Bloc Québécois Patrice Dallaire
15,444
35.2
-8.1
Alliance Howard Bruce
6,699
15.3
Progressive Conservative François Dion
3,819
8.7
-15.9
Total valid votes
43,839 100.0
1997 Canadian federal election
Party
Candidate
Votes
%
Bloc Québécois (x)Pierre De Savoye
18,615
43.3
-10.3
Liberal Raynald Samson
12,674
29.5
+6.4
Progressive Conservative Raymond McBain
10,587
24.6
+9.7
New Democratic Majella Desmeules
1,112
2.6
+1.2
Total valid votes
42,988 100.0
1993 Canadian federal election
Party
Candidate
Votes
%
Bloc Québécois Pierre De Savoye 23,880
53.6
Liberal Paulin Plamondon
10,269
23.1
-3.5
Progressive Conservative (x)Marc Ferland
6,645
14.9
-42.4
Independent René Matte
2,260
5.1
Natural Law Robert Royer
869
2.0
New Democratic John MacFarlane
626
1.4
-10.8
Total valid votes
44,549 100.0
1988 Canadian federal election
Party
Candidate
Votes
%
Progressive Conservative (x)Marc Ferland
23,893
57.4
+6.3
Liberal Paulin Plamondon
11,055
26.5
-11.4
New Democratic Jean-Marie Fiset
5,100
12.2
+5.8
Green Reynald Desrochers
1,607
3.9
Total valid votes
41,655 100.0
1984 Canadian federal election
Party
Candidate
Votes
%
Progressive Conservative Marc Ferland 23,797
51.1
+43.7
Liberal (x)Rolland Dion
17,687
38.0
-45.9
New Democratic Jacques Pelchat
3,012
6.5
-1.8
Rhinoceros Jean Paradis
1,222
2.6
-1.5
Parti nationaliste Georges-H. Marcotte
638
1.4
Social Credit Renée Roberge-Petitclerc
248
0.5
-5.3
Total valid votes
46,604 100.0
1980 Canadian federal election
Party
Candidate
Votes
%
Liberal (x)Rolland Dion
29,234
73.9
+10.2
New Democratic Robert Ferland
3,285
8.3
+4.9
Progressive Conservative Christian Légaré
2,905
7.3
-1.8
Social Credit Bernard Lapointe
2,320
5.9
-15.1
Rhinoceros M. Chrétien M. Paquette
1,634
4.1
+1.7
Union populaire Richard Corbeil
204
0.5
+0.1
Total valid votes
39,582 100.0
1979 Canadian federal election
Party
Candidate
Votes
%
Liberal Rolland Dion 25,297
63.6
+14.8
Social Credit Bernard Lapointe
8,330
20.9
-16.1
Progressive Conservative Armand Caron
3,620
9.1
+0.7
New Democratic Renée Brisson
1,346
3.4
-2.3
Rhinoceros Réjane Mame Bujold
985
2.5
Union populaire O'H Ls Gingras
184
0.5
Total valid votes
39,762 100.0
1974 Canadian federal election
Party
Candidate
Votes
%
Liberal Pierre Bussières 25,620
48.8
+5.9
Social Credit (x)Roland Godin
19,456
37.1
-6.8
Progressive Conservative Fernand Paquet
4,427
8.4
-0.2
New Democratic Hervé Gauthier
2,980
5.7
+1.2
Total valid votes
52,483 100.0
1972 Canadian federal election
Party
Candidate
Votes
%
Social Credit (x)Roland Godin
23,626
43.9
-4.4
Liberal Claude Bernard
23,113
42.9
+6.1
Progressive Conservative Jean-Luc Godin
4,664
8.7
-3.2
New Democratic Rémi Morissette
2,430
4.5
+1.5
Total valid votes
53,833 100.0
Note: Social Credit vote is compared to Ralliement créditiste vote in the 1968 election.
1968 Canadian federal election
Party
Candidate
Votes
%
Ralliement créditiste (x)Roland Godin
18,328
48.3
+14.7
Liberal Jules Lapierre
13,965
36.8
+9.1
Progressive Conservative Marcel Martineau
4,519
11.9
-5.6
New Democratic Fernand Drolet
1,126
3.0
+2.0
Total valid votes
37,938 100.0
1965 Canadian federal election
Party
Candidate
Votes
%
Ralliement créditiste Roland Godin 6,539
33.6
-22.8
Liberal Albert Neilson
5,390
27.7
-5.6
Independent (x)Jean-Louis Frénette
3,725
19.2
Progressive Conservative Gilbert Ouellet
3,400
17.5
+15.2
Independent PC
Louis-Philippe Bertrand
213
1.1
New Democratic Fernand Lepage
184
0.9
Total valid votes
19,451 100.0
Note: Ralliement créditiste vote is compared to Social Credit vote in the 1963 election.
1963 Canadian federal election
Party
Candidate
Votes
%
Social Credit (x)Jean-Louis Frénette
11,473
56.5
+1.4
Liberal Andrée-Robert Rivard
6,776
33.3
+8.9
Independent PC
Grégoire Martel
1,616
8.0
Progressive Conservative René-Paul-Joseph Plourde
459
2.3
-18.3
Total valid votes
20,324 100.0
1962 Canadian federal election
Party
Candidate
Votes
%
Social Credit Jean-Louis Frénette 12,089
55.0
Liberal J.-Gérard Maltais
5,377
24.5
-22.4
Progressive Conservative Louis Dussault
4,510
20.5
-32.6
Total valid votes
21,976 100.0
1958 Canadian federal election
Party
Candidate
Votes
%
Progressive Conservative Aristide Rompré 11,386
53.2
+11.5
Liberal (x)Pierre Gauthier
10,031
46.8
-11.5
Total valid votes
21,417 100.0
1957 Canadian federal election
Party
Candidate
Votes
%
Liberal (x)Pierre Gauthier
11,328
58.3
-11.6
Progressive Conservative Aristide Rompré 8,102
41.7
+11.6
Total valid votes
19,430 100.0
1953 Canadian federal election
Party
Candidate
Votes
%
Liberal (x)Pierre Gauthier
12,701
69.9
+11.0
Progressive Conservative Louis Tardivel
5,479
30.1
-2.5
Total valid votes
18,180 100.0
1949 Canadian federal election
Party
Candidate
Votes
%
Liberal (x)Pierre Gauthier
10,932
58.8
+6.3
Progressive Conservative Rosaire Chalifour
6,069
32.7
Union des électeurs J.-Henri Doré
1,579
8.5
+2.1
Total valid votes
18,580 100.0
1945 Canadian federal election
Party
Candidate
Votes
%
Liberal (x)Pierre Gauthier
8,994
52.6
-15.0
Independent Jean-Charles Magnan
7,021
41.0
Social Credit Raymond Dussault
1,094
6.4
Total valid votes
17,109 100.0
1940 Canadian federal election
Party
Candidate
Votes
%
Liberal (x)Pierre Gauthier
10,033
67.6
+28.9
Independent Liberal
Laurent Giroux
2,676
18.0
National Government J.-O. Pronovost
2,141
14.4
-18.9
Total valid votes
14,850 100.0
Note: Change in popular vote is calculated from popular vote in the 1935 general election. "National Government" vote is compared to Conservative vote in 1935 election.
By-election on 27 January 1936
Cannon accepted an office of emolument
Party
Candidate
Votes
Liberal Pierre Gauthier acclaimed
1935 Canadian federal election
Party
Candidate
Votes
%
Liberal Lucien Cannon 5,981
38.6
-13.2
Conservative J.-Achille Joli-Coeur
5,155
33.3
-14.9
Independent Liberal
Bona Dussault
4,281
27.7
Independent Liberal
C.-Lucien Plamondon
64
0.4
Total valid votes
15,481 100.0
1930 Canadian federal election
Party
Candidate
Votes
%
Liberal Jules Desrochers 7,813
51.8
-2.6
Conservative J.-Alfred Foley
7,262
48.2
Total valid votes
15,075 100.0
1926 Canadian federal election
Party
Candidate
Votes
%
Liberal (x)Michel-Siméon Delisle
6,308
54.5
+2.1
Independent Liberal
Herment Marcotte (alias Armand)
5,272
45.5
-25.8
1925 Canadian federal election
Party
Candidate
Votes
%
Liberal (x)Michel-Siméon Delisle
6,412
52.4
-28.4
Conservative C.-Romulus Ducharme
3,405
27.8
+14.6
Independent Liberal
Herment Marcotte (alias Armand)
2,418
19.8
Total valid votes
12,235 100.0
1908 Canadian federal election
Party
Candidate
Votes
%
Liberal (x)Michel-Siméon Delisle
2,949
57.0
+1.7
Conservative Lawrence Stafford
2,074
40.1
-2.5
Independent Liberal
Arthur Delisle
153
3.0
Total valid votes
5,176 100.0
1900 Canadian federal election
Party
Candidate
Votes
%
Liberal Michel-Siméon Delisle 2,444
54.9
+4.4
Conservative G. Antoine Larue
2,009
45.1
-4.4
Total valid votes
4,453 100.0
Note: Change in popular vote is calculated from popular vote in the 1896 general election.
By-election on 30 July 1896
Joly de Lotbinière was appointed
Party
Candidate
Votes
Liberal (x)Henri Joly de Lotbinière
acclaimed
See also [ ] References [ ] Notes [ ]
Federal ridings in Quebec
Central Quebec Côte-Nord and Saguenay Eastern Quebec The Eastern Townships The Laurentides, Outaouais MontrealEast , West , North & Laval )
Montérégie Quebec City See also: Quebec provincial electoral districts
Historical federal ridings in Quebec
Until 2015 Until 2006 Until 2004 Until 2000 Until 1997 Until 1993 Until 1988 Until 1984 Until 1980 Until 1979 Until 1974 Until 1972 Until 1968 Until 1962 Until 1953 Until 1949 Until 1935 Until 1925 Until 1917 Before 1900