Federal electoral district in Quebec, Canada
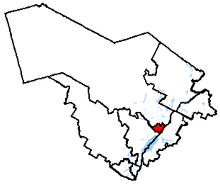
Trois-Rivières electoral district Trois-Rivières in relation to other Quebec federal electoral districts
Legislature House of Commons MP René Villemure Bloc Québécois District created 1976 First contested 1979 Last contested 2021 District webpage profile , map Population (2011 )[1] 108,774 Electors (2015)90,709 Area (km²)[2] 133 Pop. density (per km²) 817.8 Census division(s) Trois-Rivières Census subdivision(s) Trois-Rivières
Trois-Rivières (formerly known as Three Rivers and Trois-Rivières Métropolitain ) is an electoral district in Quebec , Canada that has been represented in the House of Commons of Canada from 1867 to 1892 and from 1935 to the present.
It was created as "Three Rivers" riding by the British North America Act of 1867 . The electoral district was abolished in 1892 when it was merged into Three Rivers and St. Maurice riding.
The electoral district's English name changed in 1947 to "Trois-Rivières". The riding's name was changed again in 1972 to "Trois-Rivières Métropolitain". Trois-Rivières Métropolitain was abolished in 1976 when it was redistributed into a new "Trois-Rivières" riding and Champlain riding.
This riding lost territory to Saint-Maurice—Champlain and gained territory from Berthier—Maskinongé during the 2012 electoral redistribution .
Geography [ ] The riding, in the Quebec region of Mauricie , consists of most of the city of Trois-Rivières , excepting the former cities of Trois-Rivières-Ouest and Pointe-du-Lac.
The neighbouring ridings are Berthier—Maskinongé , Saint-Maurice—Champlain , and Bas-Richelieu—Nicolet—Bécancour .
History [ ] Members of Parliament [ ] This riding has elected the following Members of Parliament :
Election results [ ] Trois-Rivières, 1979-present [ ] Graph of election results in Trois-Rivières (1976-, minor parties that never got 2% of the vote or didn't run consistently are omitted)
2021 Canadian federal election
Party
Candidate
Votes
%
Expenditures
Bloc Québécois René Villemure
17,120
29.5
+1.0
Conservative Yves Lévesque 17,027
29.4
+4.2
Liberal Martin Francoeur
16,560
28.6
+2.5
New Democratic Adis Simidzija
4,658
8.0
-8.7
People's Jean Landry 1,112
1.9
N/A
Green Andrew Holman
780
1.3
-1.2
Free Gilles Brodeur
733
1.3
N/A
Total valid votes
58,110 98.0
Total rejected ballots
1,214 2.0
Turnout
59,324 64.3
Eligible voters
92,335
Bloc Québécois hold
Swing
-1.6
Source: Elections Canada [3] [4] [5]
2019 Canadian federal election
Party
Candidate
Votes
%
Expenditures
Bloc Québécois Louise Charbonneau 17,240
28.48
+11.48
$19,118.47
Liberal Valérie Renaud-Martin
15,774
26.06
-4.16
$59,713.01
Conservative Yves Lévesque 15,240
25.17
+6.54
none listed
New Democratic Robert Aubin 10,090
16.67
-15.16
none listed
Green Marie Duplessis
1,492
2.46
+0.75
none listed
People's Marc-André Gingras
565
0.93
–
$5,574.25
Independent Ronald St-Onge Lynch
137
0.23
–
$0.00
Total valid votes/expense limit
60,538 100.0
Total rejected ballots
1,092 1.77
Turnout
61,630 66.73
Eligible voters
92,362
Bloc Québécois gain from New Democratic
Swing
+7.82
Source: Elections Canada [6] [7]
2015 Canadian federal election
Party
Candidate
Votes
%
Expenditures
New Democratic Robert Aubin 19,193
31.83
-17.87
$59,109.30
Liberal Yvon Boivin
18,224
30.22
+20.19
$33,318.95
Conservative Dominic Therrien
11,231
18.63
+5.48
$88,781.37
Bloc Québécois André Valois
10,249
17.00
-7.21
$37,874.56
Green Éric Trottier
1,032
1.71
-0.18
–
Libertarian Maxime Rousseau
360
0.6
–
–
Total valid votes/Expense limit
60,289 100.0 $232,803.19
Total rejected ballots
940 – –
Turnout
61,229 – –
Eligible voters
90,900
Source: Elections Canada [8] [9]
2011 federal election redistributed results[10]
Party
Vote
%
New Democratic 28,279
49.70
Bloc Québécois 13,776
24.21
Conservative 7,482
13.15
Liberal 5,708
10.03
Green 1,078
1.89
Others
583
1.02
2011 Canadian federal election
Party
Candidate
Votes
%
Expenditures
New Democratic Robert Aubin 26,981
53.57
+44.39
Bloc Québécois Paule Brunelle 11,987
23.80
-21.46
Conservative Pierre Lacroix
6,205
12.32
-11.92
Liberal Patrice Mangin
3,617
7.18
-11.01
Green Louis Lacroix
972
1.93
-1.18
Independent Marc-André Fortin
346
0.69
–
Rhinoceros Francis Arsenault
256
0.51
–
Total valid votes/Expense limit
50,364 100.00
Total rejected ballots
889 1.73 –
Turnout
51,253 64.59 –
Eligible voters
79,346 – –
2008 Canadian federal election
Party
Candidate
Votes
%
Expenditures
Bloc Québécois Paule Brunelle 22,405
45.26
-0.2
$77,449
Conservative Claude Durand
11,998
24.24
-9.1
$76,522
Liberal Marcos G. Simard
9,008
18.19
+7.3
$17,099
New Democratic Geneviève Boivin
4,544
9.18
+2.5
$2,096
Green Ariane Blais
1,540
3.11
+0.3
Total valid votes/Expense limit
39,579 100.0 $84,242
2006 Canadian federal election
Party
Candidate
Votes
%
Expenditures
Bloc Québécois Paule Brunelle 22,331
45.9
-10.6
$52,451
Conservative Luc Ménard
15,423
31.7
+22.2
$10,874
Liberal Martine Girard
5,268
10.8
-16.5
$19,948
New Democratic Geneviève Boivin
3,774
7.8
+4.2
$1,703
Green Linda Lavoie
1,513
3.1
-0.1
Marijuana Paul Giroux
371
0.8
–
Total valid votes/Expense limit
48,680 100.0 $78,516
2004 Canadian federal election
Party
Candidate
Votes
%
Expenditures
Bloc Québécois Paule Brunelle 26,240
56.5
+9.8
$52,143
Liberal Jean-Éric Guindon
12,703
27.4
-15.6
$69,554
Conservative Jean-Guy Mercier
4,381
9.4
+1.6
$9,519
New Democratic Marc Tessier
1,635
3.5
2.5
$1,416
Green Linda Lavoie
1,476
3.2
–
Total valid votes/Expense limit
46,435 100.0 $77,441
Note: Conservative vote is compared to the total of the Canadian Alliance vote and Progressive Conservative vote in 2000 election.
2000 Canadian federal election
Party
Candidate
Votes
%
Bloc Québécois Yves Rocheleau 22,405
46.7
+4.2
Liberal Denis Normandin
20,606
42.9
+11.6
Alliance Luc Legaré
2,161
4.5
Progressive Conservative Scott Healy
1,599
3.3
-20.8
Natural Law Gilles Raymond
538
1.1
+0.1
New Democratic David Horlock
512
1.1
–
Marxist–Leninist Alexandre Deschênes
184
0.4
Total valid votes
48,005 100.0
1997 Canadian federal election
Party
Candidate
Votes
%
Bloc Québécois Yves Rocheleau 21,267
42.5
-10.7
Liberal Jean-Guy Doucet
15,692
31.3
+10.1
Progressive Conservative Michel Charland
12,102
24.2
+0.5
New Democratic Dorothy Hénaut
528
1.1
+0.3
Natural Law Roger Périgny
503
1.0
-0.1
Total valid votes
50,092 100.0
1993 Canadian federal election
Party
Candidate
Votes
%
Bloc Québécois Yves Rocheleau 24,882
53.2
Progressive Conservative Pierre H. Vincent 11,053
23.6
-45.2
Liberal Jean-Pierre Caron
9,937
21.2
+5.5
Natural Law Roger Périgny
522
1.1
New Democratic Maryse Choquette
374
0.8
-12.0
Total valid votes
46,768 100.0
1988 Canadian federal election
Party
Candidate
Votes
%
Progressive Conservative Pierre H. Vincent 29,370
68.9
+4.9
Liberal Nicholas Papirakis
6,727
15.8
-8.6
New Democratic Josée Trudel
5,470
12.8
+8.2
Rhinoceros Danielle La Chicane Saint-Laurent
826
1.9
-0.5
Independent Lise Éthier
249
0.6
Total valid votes
42,642 100.0
1984 Canadian federal election
Party
Candidate
Votes
%
Progressive Conservative Pierre H. Vincent 26,843
63.9
+51.0
Liberal Françoise C. Drolet
10,217
24.3
-44.1
New Democratic John A. Pratt
1,947
4.6
-6.5
Parti nationaliste Yves Rocheleau
1,847
4.4
Rhinoceros Houblon-oubedon Lemoine
1,018
2.4
Communist Paul Gagné
110
0.3
Total valid votes
41,982 100.0
1980 Canadian federal election
Party
Candidate
Votes
%
Liberal Claude Lajoie 23,791
68.5
+7.5
Progressive Conservative Jean Méthot
4,482
12.9
+2.2
New Democratic Denis Faubert
3,870
11.1
+6.7
Independent Raymond Lajoie
1,898
5.5
Independent Rodolphe Lemieux
283
0.8
Union populaire Guy Baillargeon
249
0.7
+0.5
Marxist–Leninist Lise Éthier
168
0.5
+0.3
Total valid votes
34,741 100.0
1979 Canadian federal election
Party
Candidate
Votes
%
Liberal Claude Lajoie 23,311
61.0
-0.2
Social Credit Léopold Alarie
7,950
20.8
+1.8
Progressive Conservative Roland Julien
4,099
10.7
-4.2
New Democratic Roland Auger
1,682
4.4
0.0
Rhinoceros Alain Beaupré
947
2.5
Independent Gilles Gervais
77
0.2
Union populaire Gilles Marier
66
0.2
Marxist–Leninist Lise Éthier
63
0.2
-0.4
Communist Jeannette Walsh
36
0.1
Total valid votes
38,231 100.0
Trois-Rivières Métropolitain, 1972-1979 [ ] Graph of election results in Trois-Rivières Métropolitain (1972-1976, minor parties that never got 2% of the vote or didn't run consistently are omitted)
1974 Canadian federal election
Party
Candidate
Votes
%
Liberal Claude Lajoie 24,335
61.2
+16.8
Social Credit Réal Ménard
7,538
18.9
-19.5
Progressive Conservative Yvon Massicotte
5,949
15.0
+2.3
New Democratic Yvon Roland Chamberland
1,738
4.4
-0.1
Marxist–Leninist Jacques Auger
221
0.6
Total valid votes
39,781 100.0
1972 Canadian federal election
Party
Candidate
Votes
%
Liberal Claude Lajoie 19,892
44.4
-3.3
Social Credit Réal Lemay
17,250
38.5
-4.8
Progressive Conservative Edgar Lesieur
5,662
12.6
+5.8
New Democratic Jacques Hébert
2,022
4.5
Total valid votes
44,826 100.0
Trois-Rivières, 1949-1972 [ ] Graph of election results in Trois-Rivières (1947-1972, minor parties that never got 2% of the vote or didn't run consistently are omitted)
Canadian federal by-election, 31 May 1971
Party
Candidate
Votes
%
On Mr. Mongrain's death, 23 December 1970
Liberal Claude Lajoie 12,809
47.7
+1.5
Social Credit Réal Lemay
11,616
43.3
+24.1
Progressive Conservative Thérèse-M. Landry
1,827
6.8
-20.8
Independent Henri-Georges Grenier (Espirit social )
422
1.6
Republican Joseph Thibodeau
170
0.6
Total valid votes
26,844 100.0
Note: Social Credit vote is compared to Ralliement créditiste vote in the 1968 election.
1968 Canadian federal election
Party
Candidate
Votes
%
Liberal Joseph-Alfred Mongrain 17,592
46.2
+12.6
Progressive Conservative Gilles Gauthier
10,501
27.6
+12.4
Ralliement créditiste Émile Fréchette
7,305
19.2
+11.3
New Democratic Philippe Daviault
1,724
4.5
+2.2
Independent Gaston Pelletier
566
1.5
Independent Lucien Bornais
364
1.0
Total valid votes
38,052 100.0
1965 Canadian federal election
Party
Candidate
Votes
%
Independent Joseph-Alfred Mongrain 12,927
40.9
Liberal Pierre Garceau
10,617
33.6
-6.5
Progressive Conservative Jean Méthot
4,799
15.2
-29.5
Ralliement créditiste Philippe Daviault
2,488
7.9
-5.1
New Democratic Joseph Rivard
749
2.4
+0.2
Total valid votes
31,580 100.0
Note: Ralliement créditiste vote is compared to Social Credit vote in the 1963 election.
1963 Canadian federal election
Party
Candidate
Votes
%
Progressive Conservative Léon Balcer 14,558
44.7
-4.0
Liberal Claude Bisson
13,077
40.1
+3.6
Social Credit Lucien Richard
4,224
13.0
-1.8
New Democratic Alfred Robindaine
718
2.2
Total valid votes
32,577 100.0
1962 Canadian federal election
Party
Candidate
Votes
%
Progressive Conservative Léon Balcer 15,545
48.7
-11.1
Liberal Claude Bisson
11,675
36.6
-0.5
Social Credit J.-Donat Dupont
4,715
14.8
Total valid votes
31,935 100.0
1958 Canadian federal election
Party
Candidate
Votes
%
Progressive Conservative Léon Balcer 18,049
59.7
+9.1
Liberal Antoine Gauthier
11,193
37.1
-11.6
Independent Henri-Georges Grenier (Capital familial )
968
3.2
+2.4
Total valid votes
30,210 100.0
1957 Canadian federal election
Party
Candidate
Votes
%
Progressive Conservative Léon Balcer 15,004
50.6
-2.2
Liberal François Nobert
14,412
48.6
+1.4
Independent Henri-Georges Grenier (Capital familial )
237
0.8
Total valid votes
29,653 100.0
1953 Canadian federal election
Party
Candidate
Votes
%
Progressive Conservative Léon Balcer 15,556
52.8
+13.8
Liberal Joseph-Alfred Mongrain
13,905
47.2
+8.4
Total valid votes
29,461 100.0
1949 Canadian federal election
Party
Candidate
Votes
%
Progressive Conservative Léon Balcer 10,015
39.0
+18.8
Liberal Wilfrid Gariépy
9,964
38.8
+26.5
Independent Liberal
Jules Biron
4,925
19.2
Union des électeurs Hector Brunelle
432
1.7
-2.1
Independent Henri-Georges Grenier
367
1.4
-0.6
Total valid votes
25,703 100.0
Three Rivers, 1935-1949 [ ] Graph of election results in Three Rivers (1934-1949, minor parties that never got 2% of the vote or didn't run consistently are omitted)
1945 Canadian federal election
Party
Candidate
Votes
%
Independent Wilfrid Gariépy 6,610
32.0
-15.0
Independent Liberal
Jean-Louis Marchand
5,947
28.8
Progressive Conservative Léon Méthot 4,173
20.2
Liberal Robert Ryan
2,525
12.2
-40.8
Social Credit Onésime Cormier
787
3.8
Independent Henri-Georges Grenier
423
2.0
Co-operative Commonwealth Lionel Fortin
186
0.9
Total valid votes
20,651 100.0
1940 Canadian federal election
Party
Candidate
Votes
%
Liberal Robert Ryan 9,860
53.0
-2.0
Independent Liberal
Wilfrid Gariépy 8,734
47.0
Total valid votes
18,594 100.0
1935 Canadian federal election
Party
Candidate
Votes
%
Liberal Wilfrid Gariépy 6,114
30.1
Conservative Léon Méthot 5,748
28.3
-30.3
Liberal Philippe Bigué
5,070
24.9
Independent Liberal
Willie Poisson
2,267
11.2
Reconstruction Louis-D. Durand
1,049
5.2
Independent Conservative
Louis Normand
76
0.4
Total valid votes
20,324 100.0
Three Rivers, 1867-1892 [ ] Graph of election results in Three Rivers (1867-1892, minor parties that never got 2% of the vote or didn't run consistently are omitted)
1887 Canadian federal election
Party
Candidate
Votes
%
Conservative Hector-Louis Langevin 640
51.2
Liberal L.P. Pelletier
610
48.8
Total valid votes
1,250 100.0
1882 Canadian federal election
Party
Candidate
Votes
Conservative Hector-Louis Langevin acclaimed
By-election on 21 November 1878
On Mr. McDougall's resignation
Party
Candidate
Votes
Conservative Hector-Louis Langevin acclaimed
By-election on 17 October 1868
On Mr. Boucher de Niverville's resignation, 30 September 1868
Party
Candidate
Votes
Conservative William McDougall acclaimed
Districts since 1867 that have included Trois-Rivières [ ] The following list contains members of districts that have included Trois-Rivières, since 1867 :
Name
Assignments [11] Party
Election [12] Popular Vote [13]
Charles Boucher de Niverville [14] Government MP Conservative 1867 66%
William McDougall Government MP Conservative 1868 unopposed
William McDougall Government MP (before 1873)Official Opposition MP (after 1873)Conservative 1872 unopposed
William McDougall Official Opposition MP Conservative 1874 78%
William McDougall [15] Government MP Conservative 1878 57%
Hector Langevin Cabinet Member Conservative 1878 unopposed
Hector Langevin Cabinet Member Conservative 1882 unopposed
Hector Langevin Cabinet Member Conservative 1887 51%
Hector Langevin Government MP Cabinet Member (until 1891)Conservative 1891 59%
Sir Adolphe-Philippe Caron Official Opposition MP Conservative 1896 54%
Jacques Bureau Government MP Liberal 1900 53%
Jacques Bureau [16] Government MP Liberal 1904 54%
Jacques Bureau Cabinet Member Liberal 1907 unopposed
Jacques Bureau Cabinet Member Liberal 1908 64%
Jacques Bureau Official Opposition MP Liberal 1911 50%
Jacques Bureau Official Opposition MP Liberal 1917 unopposed
Jacques Bureau [17] Government MP Liberal 1921 68%
Jacques Bureau Cabinet Member Liberal 1922 unopposed
Arthur Bettez Government MP (until 1926)Official Opposition MP (after 1926)Liberal 1925 56%
Arthur Bettez Government MP Liberal 1926 66%
Arthur Bettez [18] Official Opposition MP Liberal 1930 57%
Charles Bourgeois Government MP Conservative 1931 50%
Wilfrid Gariépy [19] Government MP Liberal 1935 30%
Robert Ryan [20] Government MP Liberal 1940 53%
}
Wilfrid Gariépy [21] Independent MP Independent 1945 32%
Léon Balcer Official Opposition MP Progressive Conservative 1949 39%
Léon Balcer Official Opposition MP Progressive Conservative 1953 53%
Léon Balcer Cabinet Member Progressive Conservative 1957 51%
Léon Balcer Cabinet Member Progressive Conservative 1958 60%
Léon Balcer Cabinet Member Progressive Conservative 1962 49%
Léon Balcer [22] Official Opposition MP Progressive Conservative 1963 45%
}
Joseph-Alfred Mongrain Independent MP Independent 1965 59%
Joseph-Alfred Mongrain [23] Government MP Liberal 1968 46%
Claude Lajoie Government MP Liberal 1971 48%
Claude Lajoie Government MP Liberal 1972 44%
Claude Lajoie Government MP Parliamentary Secretary (from 1975 to 1977)Liberal 1974 61%
Claude Lajoie Official Opposition MP Liberal 1979 61%
Claude Lajoie Government MP Liberal 1980 68%
Pierre H. Vincent Parliamentary Secretary Progressive Conservative 1984 64%
Pierre H. Vincent [24] Parliamentary Secretary (until 1993) Cabinet Member (after 1993)Progressive Conservative 1988 69%
Yves Rocheleau Official Opposition MP Bloc Québécois 1993 53%
Yves Rocheleau Third Party MP Bloc Québécois 1997 42%
Yves Rocheleau Third Party MP Bloc Québécois 2000 47%
Paule Brunelle Third Party MP Bloc Québécois 2004 57%
Paule Brunelle Third Party MP Bloc Québécois 2006 46%
Paule Brunelle Third Party MP Bloc Québécois 2008 46%
See also [ ] References [ ] Riding history from the Library of Parliament :
Notes [ ]
Federal ridings in Quebec
Central Quebec Côte-Nord and Saguenay Eastern Quebec The Eastern Townships The Laurentides, Outaouais MontrealEast , West , North & Laval )
Montérégie Quebec City See also: Quebec provincial electoral districts
Historical federal ridings in Quebec
Until 2015 Until 2006 Until 2004 Until 2000 Until 1997 Until 1993 Until 1988 Until 1984 Until 1980 Until 1979 Until 1974 Until 1972 Until 1968 Until 1962 Until 1953 Until 1949 Until 1935 Until 1925 Until 1917 Before 1900
Coordinates : 46°21′32″N 72°36′29″W / 46.359°N 72.608°W / 46.359; -72.608