Laval—Les Îles is a federal electoral district in Quebec, Canada, that has been represented in the House of Commons of Canada since 2004.
Its population in 2001 was 100,137.
Of the population, 15.9% are Christian Orthodox,[3] and 14.0% are of Greek ethnic origin,[4] both the highest such percentages in Canada.
Geography[]
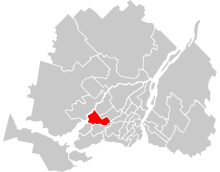
The district includes the neighbourhoods of Îles-Laval, Laval-Ouest, Laval-sur-le-Lac, Sainte-Dorothée, the western part of the neighbourhood of Fabreville and the western part of Chomedey in the City of Laval. The neighbouring ridings are Vimy, Saint-Laurent—Cartierville, Pierrefonds—Dollard, Rivière-des-Mille-Îles, and Marc-Aurèle-Fortin.
Demographics[]
- According to the Canada 2011 Census
- Mother tongue: French (48%), English (10%), Greek (9%), Arabic (7%), Armenian (4%)
History[]
The electoral district was created in 2003 from parts of Laval West riding.
This riding lost territory to Vimy and Marc-Aurèle-Fortin during the 2012 electoral redistribution.
This riding has elected the following Members of Parliament:
Election results[]
| hide2019 Canadian federal election
|
| Party
|
Candidate
|
Votes |
% |
|
Expenditures
|
|
|
Liberal |
Fayçal El-Khoury |
26,031 |
48.2 |
+0.50 |
$93,691.28
|
|
|
Bloc Québécois |
Nacera Beddad |
11,120 |
20.6 |
+8.18 |
$1,900.53
|
|
|
Conservative |
Tom Pentefountas |
8,816 |
16.3 |
-1.80 |
none listed
|
|
|
New Democratic |
Noémia Onofre De Lima |
4,803 |
8.9 |
-10.87 |
none listed
|
|
|
Green |
Sari Madi |
2,306 |
4.3 |
+2.61 |
none listed
|
|
|
People's |
Marie-Louise Beauchamp |
885 |
1.7 |
|
$0.00
|
| Total valid votes/Expense limit
|
53,961 |
100.0
|
| Total rejected ballots
|
840
|
| Turnout
|
54,801 |
65.8
|
| Eligible voters
|
83,233
|
|
|
Liberal hold
|
Swing
|
-3.84
|
| Source: Elections Canada[6][7]
|
| hide2015 Canadian federal election
|
| Party
|
Candidate
|
Votes |
% |
|
Expenditures
|
|
|
Liberal |
Fayçal El-Khoury |
25,857 |
47.70 |
+27.07 |
$86,424.50
|
|
|
New Democratic |
François Pilon |
10,710 |
19.77 |
-27.43 |
$29,014.20
|
|
|
Conservative |
Roland Dick |
9,811 |
18.10 |
+1.67 |
$114,413.09
|
|
|
Bloc Québécois |
Nancy Redhead |
6,731 |
12.42 |
-0.47 |
$19,952.32
|
|
|
Green |
Faiza R'Guiba-Kalogerakis |
919 |
1.69 |
-0.09 |
$2,605.36
|
|
|
Marxist–Leninist |
Yvon Breton |
175 |
0.32 |
-0.04 |
–
|
| Total valid votes/Expense limit
|
– |
100.0 |
|
$218,884.73
|
| Total rejected ballots
|
– |
– |
–
|
| Turnout
|
54,203 |
– |
–
|
| Eligible voters
|
81,562
|
| Source: Elections Canada[8][9]
|
| 2011 federal election redistributed results[10]
|
| Party
|
Vote
|
%
|
|
|
New Democratic |
21,069 |
47.20
|
|
|
Liberal |
9,208 |
20.63
|
|
|
Conservative |
7,333 |
16.43
|
|
|
Bloc Québécois |
5,755 |
12.89
|
|
|
Green |
794 |
1.78
|
|
|
Others |
483 |
1.08
|
| hide2011 Canadian federal election
|
| Party
|
Candidate
|
Votes |
% |
|
Expenditures
|
|
|
New Democratic |
François Pilon |
25,703 |
47.64 |
+36.18 |
|
|
|
Liberal |
Karine Joizil |
11,108 |
20.59 |
-19.85 |
|
|
|
Conservative |
Zaki Ghavitian |
8,587 |
15.92 |
-4.70 |
|
|
|
Bloc Québécois |
Mohamedali Jetha |
7,022 |
13.02 |
-10.52 |
|
|
|
Green |
Brent Neil |
966 |
1.79 |
-1.49 |
|
|
|
Pirate |
Stéphane Bakhos |
369 |
0.68 |
|
|
|
|
Marxist–Leninist |
Polyvios Tsakanikas |
194 |
0.36 |
– |
|
| Total valid votes/Expense limit
|
53,949 |
100.00
|
| Total rejected ballots
|
702 |
1.28 |
-0.06
|
| Turnout
|
54,651 |
59.31 |
-2.38
|
| hide2008 Canadian federal election
|
| Party
|
Candidate
|
Votes |
% |
|
Expenditures
|
|
|
Liberal |
Raymonde Folco |
21,603 |
40.44 |
+1.13 |
$46,790
|
|
|
Bloc Québécois |
Mohamedali Jetha |
12,576 |
23.54 |
-9.53 |
$43,306
|
|
|
Conservative |
Agop Evereklian |
11,017 |
20.62 |
+3.55 |
$88,318
|
|
|
New Democratic |
Zahia El-Masri |
6,124 |
11.46 |
+4.27 |
$5,682
|
|
|
Green |
Brent Neil |
1,752 |
3.28 |
+0.35 |
$20
|
|
|
Rhinoceros |
Sylvain A. Trottier |
336 |
0.62 |
|
$184
|
| Total valid votes/Expense limit
|
53,408 |
100.00 |
$90,317
|
| Total rejected ballots
|
725 |
1.34 |
+0.03
|
| Turnout
|
54,133 |
61.69 |
-1.78
|
| hide2006 Canadian federal election
|
| Party
|
Candidate
|
Votes |
% |
|
Expenditures
|
|
|
Liberal |
Raymonde Folco |
20,849 |
39.31 |
-8.55 |
$53,323
|
|
|
Bloc Québécois |
Christiane Pichette |
17,537 |
33.07 |
-4.04 |
$51,106
|
|
|
Conservative |
Qais Hamidi |
9,055 |
17.07 |
+10.09 |
$24,108
|
|
|
New Democratic |
Alain Giguère |
3,817 |
7.19 |
+2.80 |
$1,122
|
|
|
Green |
Theodore Kouretas |
1,557 |
2.93 |
+0.58 |
$0
|
|
|
Marxist–Leninist |
Polyvios Tsakanikas |
211 |
0.39 |
+0.08 |
|
| Total
|
53,524 |
100.00 |
$82,901
|
| Total rejected ballots
|
709 |
1.31
|
| Turnout
|
54,133 |
63.47
|
| hide2004 Canadian federal election
|
| Party
|
Candidate
|
Votes |
% |
|
Expenditures
|
|
|
Liberal |
Raymonde Folco |
23,985 |
47.86 |
– |
$41,522
|
|
|
Bloc Québécois |
Micaël Poirier |
18,597 |
37.11 |
– |
$19,639
|
|
|
Conservative |
Jean-Paul Pratte |
3,498 |
6.98 |
– |
$8,960
|
|
|
New Democratic |
Paul Michaud |
2,202 |
4.39 |
– |
$1,461
|
|
|
Green |
Pierre Véronneau |
1,178 |
2.35 |
– |
$1,860
|
|
|
Marijuana |
Michel Allard |
498 |
0.99 |
– |
|
|
|
Marxist–Leninist |
Polyvios Tsakanikas |
154 |
0.31 |
– |
|
| Total valid votes/Expense limit
|
50,112 |
100.00 |
$80,533
|
See also[]
References[]
Notes[]
- ^ Statistics Canada: 2016
- ^ Statistics Canada: 2016
- ^ "Religion (13) and Age Groups (8) for Population, for Canada, Provinces, Territories and Federal Electoral Districts (2003 Representation Order), 2001 Census - 20% Sample Data". 2.statcan.gc.ca. Retrieved 2012-11-20.
- ^ "2Profile of Ethnic Origin and Visible Minorities for Canada, Provinces, Territories and Federal Electoral Districts (2003 Representation Order), 2006 Census". 2.statcan.gc.ca. Retrieved 2012-12-02.
- ^ "List of confirmed candidates – September 20, 2021 Federal Election". Elections Canada. Retrieved 2 September 2021.
- ^ "List of confirmed candidates". Elections Canada. Retrieved October 3, 2019.
- ^ "Election Night Results". Elections Canada. Retrieved November 12, 2019.
- ^ Elections Canada – Confirmed candidates for Laval—Les Îles, 30 September 2015
- ^ Elections Canada – Preliminary Election Expenses Limits for Candidates Archived 2015-08-15 at the Wayback Machine
- ^ Pundits' Guide to Canadian Elections
| show Historical federal ridings in Quebec |
|---|
| Until 2015 | |
|---|
| Until 2006 | |
|---|
| Until 2004 | |
|---|
| Until 2000 | |
|---|
| Until 1997 | |
|---|
| Until 1993 | |
|---|
| Until 1988 | |
|---|
| Until 1984 | |
|---|
| Until 1980 | |
|---|
| Until 1979 | |
|---|
| Until 1974 | |
|---|
| Until 1972 | |
|---|
| Until 1968 | |
|---|
| Until 1962 | |
|---|
| Until 1953 | |
|---|
| Until 1949 | |
|---|
| Until 1935 | |
|---|
| Until 1925 | |
|---|
| Until 1917 | |
|---|
| Before 1900 | |
|---|