Canadian politician
For the painter, see Alfred Pellan .
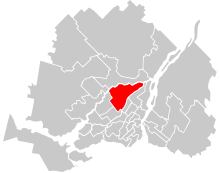
Alfred-Pellan electoral district Alfred-Pellan in relation to other electoral districts in Montreal and Laval
Legislature House of Commons MP Angelo Iacono Liberal District created 2003 First contested 2004 Last contested 2015 District webpage profile , map Population (2016 )[1] 101,373 Electors (2019)79,083 Area (km²)[2] 113.98 Pop. density (per km²) 889.4 Census division(s) Laval Census subdivision(s) Laval
Alfred-Pellan (formerly Duvernay and Laval East ) is a federal electoral district in Quebec , Canada, that has been represented in the House of Commons of Canada since 1968. Its population in 2006 was 104,765.
Geography [ ] The district includes the neighbourhoods of Duvernay , Pont-Viau , Saint-François , Saint-Vincent-de-Paul and the eastern part of the neighbourhood of Vimont in the City of Laval .
The neighbouring ridings are Marc-Aurèle-Fortin , Terrebonne—Blainville , Montcalm , Honoré-Mercier , Ahuntsic , and Vimy .
Demographics [ ] According to the Canada 2016 Census Languages: (2016) 64.4% French, 10.1% Italian, 7.3% English, 4.1% Arabic, 4.0% Spanish, 3.3% Creole, 1.3% Portuguese, 1.0% Romanian, 0.6% Vietnamese, 0.4% Kabyle, 0.3% Greek, 0.3% Khmer, 0.3% Turkish[3] History [ ] The riding was created in 1968 from Laval and was known as Duvernay until 1990 when it became Laval East . Upon redistribution in 2003 it was renamed Alfred-Pellan after the famous Quebec artist Alfred Pellan . Also it lost a small part of its territory to the newly created Marc-Aurèle-Fortin riding.
The riding lost territory to Vimy and Marc-Aurèle-Fortin during the 2012 electoral redistribution .
Member of Parliament [ ] This riding has elected the following Member of Parliament :
Election results [ ] Alfred-Pellan, 2003 - present [ ]
hide 2019 Canadian federal election
Party
Candidate
Votes
%
Expenditures
Liberal Angelo Iacono 26,015
47.90
+3.39
$97,523.02
Bloc Québécois Michel Lachance
15,549
28.63
+10.80
$16,657.44
Conservative Angelo Esposito 5,917
10.90
-0.45
none listed
New Democratic Andriana Kocini
4,109
7.57
-16.41
$443.23
Green Marguerite Howells
1,958
3.61
+1.63
$0.00
People's Mathieu Couture
471
0.87
$6,000.82
Pour l'Indépendance du Québec
Julius Buté
177
0.33
$0.00
Independent Dwayne Cappelletti
113
0.21
$582.53
Total valid votes/Expense limit
54,309 98.24
Total rejected ballots
973 1.76 +0.54
Turnout
55,282 69.90 +2.59
Eligible voters
79,083
Liberal hold
Swing
-3.71
Source: Elections Canada [5] [6]
hide 2015 Canadian federal election : Alfred-Pellan
Party
Candidate
Votes
%
Expenditures
Liberal Angelo Iacono 24,557
44.51
+22.19
$112,927.21
New Democratic Rosane Doré Lefebvre 13,225
23.97
-18.24
$58,909.82
Bloc Québécois Daniel St-Hilaire
9,836
17.83
-4.52
$39,062.31
Conservative Gabriel Purcarus
6,259
11.35
+0.14
$8,181.47
Green Lynda Briguene
1,089
1.97
+0.52
$4,610.57
Independent Renata Isopo
203
0.37
–
–
Total valid votes/Expense limit
55,169 98.78 $212,592.47
Total rejected ballots
679 – –
Turnout
55,848 71.34 –
Eligible voters
78,288
Liberal gain from New Democratic
Swing
+20.22
Source: Elections Canada [7] [8]
2011 federal election redistributed results[9]
Party
Vote
%
New Democratic 20,329
42.21
Bloc Québécois 10,766
22.35
Liberal 10,751
22.32
Conservative 5,398
11.21
Green 697
1.45
Others
219
0.45
hide 2011 Canadian federal election
Party
Candidate
Votes
%
New Democratic Rosane Doré Lefebvre 23,098
42.09
+30.06
Bloc Québécois Robert Carrier 12,504
22.79
-16.04
Liberal Angelo Iacono 12,070
22.00
-7.27
Conservative Pierre Lefebvre
6,157
11.22
-5.04
Green Dylan Perceval-Maxwell 798
1.45
-1.68
Independent Régent Millette
245
0.45
-0.04
Total valid votes/Expense limit
54,872 100.00
Total rejected ballots
745 1.34 -0.02
Turnout
55,617 65.91 -0.14
New Democratic gain from Bloc Québécois
Swing
+23.05
hide 2008 Canadian federal election : Alfred-Pellan
Party
Candidate
Votes
%
Expenditures
Bloc Québécois Robert Carrier 20,686
38.83
−4.14
$59,983
Liberal Wilson Saintelmy
15,594
29.27
+1.68
$51,830
Conservative Alexandre Salameh
8,662
16.26
−2.66
$72,184
New Democratic Cynthia Roy
6,406
12.03
+4.92
$3,131
Green Tristan Desjardins Drouin
1,665
3.13
−0.28
$325
Independent Régent Millette
259
0.49
–
none listed
Total valid votes
53,272 100.00
Total rejected ballots
737 1.36
Turnout
54,009 66.05
Electors on the lists
81,766
hide 2006 Canadian federal election : Alfred-Pellan
Party
Candidate
Votes
%
Expenditures
Bloc Québécois Robert Carrier 23,193
42.97
-6.23
$40,539
Liberal Jean-Claude Gobé 14,895
27.59
-12.00
$78,159
Conservative Rosanne Raymond
10,210
18.92
+13.85
$16,233
New Democratic Martin Leduc
3,838
7.11
+3.64
$4,371
Green Christien Lajoie
1,842
3.41
+1.29
Total valid votes/Expense limit
53,978 100.00 $80,448
Total rejected ballots
791 1.44
Turnout
54,769 68.18 +2.13
Electors on the list
80,328
hide 2004 Canadian federal election : Alfred-Pellan
Party
Candidate
Votes
%
Expenditures
Bloc Québécois Robert Carrier 26,239
49.20
+6.65
$38,963
Liberal Carole-Marie Allard 21,116
39.59
−5.18
$70,978
Conservative Rosane Raymond
2,703
5.07
−3.21
$10,199
New Democratic Benjamin Le Bel
1,849
3.47
+2.48
$2,108
Green Louis-Philippe Verenka
1,132
2.12
+0.98
$0
Independent Yves Denois
204
0.38
–
none listed
Independent Régent Millette
89
0.17
−0.27
none listed
Total valid votes
53,232 100.00
Total rejected ballots
1,128 2.07
Turnout
54,460 67.95
Eligible voters
80,148
Bloc Québécois gain from Liberal
Swing
+5.92
Note: Conservative vote is compared to the total of the Canadian Alliance vote and Progressive Conservative vote in the 2000 election.
Laval East, 1990 - 2003 [ ]
hide 2000 Canadian federal election : Laval East
Party
Candidate
Votes
%
Expenditures
Liberal Carole-Marie Allard 26,018
44.77
+12.66
$69,391
Bloc Québécois Mathieu Alarie
24,726
42.55
+4.09
$71,179
Progressive Conservative André G. Plourde
2,459
4.23
−23.93
none listed
Alliance Rosane Raymond
2,354
4.05
–
$877
Marijuana Christian Lajoie
892
1.53
–
$157
Green Frédéric Gauvin
660
1.14
–
$108
New Democratic Sujata Dey
573
0.99
−0.28
none listed
Independent Régent Millette
255
0.44
–
none listed
Marxist–Leninist Gabriel Cornellier-Brunelle
178
0.31
–
$10
Total valid votes
58,115 97.4
Total rejected ballots
1,535 2.6
Turnout
59,650 68.7
Eligible voters
86,759
Liberal gain from Bloc Québécois
Swing
+4.29
Sources: Official Results, Elections Canada and Financial Returns, Elections Canada .
Duvernay, 1966 - 1990 [ ]
hide 1980 Canadian federal election
Party
Candidate
Votes
%
Liberal Yves Demers 34,560
72.43
+4.30
New Democratic John Shatilla
5,069
10.62
+5.14
Progressive Conservative Pierre Pelletier
3,647
7.64
-0.38
Rhinoceros Pierre Elliott Vaillancourt
2,479
5.20
+2.12
Social Credit Émilien Martel
1,542
3.23
-11.15
Union populaire Roger-Marc Lalande
218
0.46
+0.04
Marxist–Leninist Sylvie Bourgeois
112
0.23
-0.01
Communist Jacques Grenier
88
0.18
-0.06
Total valid votes
47,715 100.00
hide 1979 Canadian federal election
Party
Candidate
Votes
%
Liberal Yves Demers 35,270
68.13
+8.58
Social Credit François Chagnon
7,446
14.38
+2.79
Progressive Conservative Richard B. Morin
4,152
8.02
-13.24
New Democratic John Shatilla
2,839
5.48
-2.12
Rhinoceros Pierre J. Hamel
1,592
3.08
–
Union populaire Marcel Lavigne
220
0.42
–
Communist Jacques Grenier
125
0.24
–
Marxist–Leninist Sylvie Bourgeois
122
0.24
–
Total valid votes
51,766 100.00
hide 1974 Canadian federal election
Party
Candidate
Votes
%
Liberal Yves Demers 25,674
59.55
+9.80
Progressive Conservative Gilles David
9,165
21.26
+4.10
Social Credit Émilien Martel
4,996
11.59
-9.26
New Democratic Edmond Ciccarelli
3,275
7.60
-4.64
Total valid votes
43,110 100.00
hide 1972 Canadian federal election
Party
Candidate
Votes
%
Liberal Yves Demers 23,050
49.75
-0.79
Social Credit Émilien Martel
9,659
20.85
+18.13
Progressive Conservative Bernard Roy
7,950
17.16
+14.27
New Democratic Gaston McKenty
5,669
12.24
-31.61
Total valid votes
46,328 100.00
hide 1968 Canadian federal election
Party
Candidate
Votes
%
Liberal Eric Kierans 18,701
50.54
New Democratic Robert Cliche 16,225
43.85
Progressive Conservative Simon Bédard
1,068
2.89
Ralliement créditiste Fernand Bélisle
1,006
2.72
Total valid votes
37,000 100.00
See also [ ] References [ ] Notes [ ] show Historical federal ridings in Quebec
Until 2015 Until 2006 Until 2004 Until 2000 Until 1997 Until 1993 Until 1988 Until 1984 Until 1980 Until 1979 Until 1974 Until 1972 Until 1968 Until 1962 Until 1953 Until 1949 Until 1935 Until 1925 Until 1917 Before 1900
Coordinates : 45°39′58″N 73°37′41″W / 45.666°N 73.628°W / 45.666; -73.628