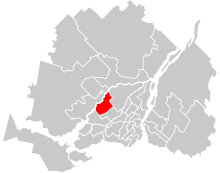
Marc-Aurèle-Fortin electoral district Marc-Aurèle-Fortin in relation to other electoral districts in Montreal and Laval
Legislature House of Commons MP Yves Robillard Liberal District created 2004 First contested 2004 Last contested 2019 District webpage profile , map Population (2016 )[1] 101,750 Electors (2015)78,371 Area (km²)[2] 54 Pop. density (per km²) 1,884.3 Census division(s) Laval Census subdivision(s) Laval
Sainte-Rose (electoral district) re-directs here. For the provincial electoral district, see Sainte-Rose (provincial electoral district) Marc-Aurèle-Fortin is a federal electoral district in Quebec , Canada, that has been represented in the House of Commons of Canada since 2004.
Geography [ ] The district includes the neighbourhoods of Auteuil and Sainte-Rose , the eastern part of the neighbourhood of Fabreville , and the western part of neighbourhood of Vimont in the City of Laval . The neighbouring ridings are Rivière-des-Mille-Îles , Argenteuil—Papineau—Mirabel , Terrebonne—Blainville , Alfred-Pellan , and Vimy .
History [ ] The district was created in 2004 from Laval Centre , Terrebonne—Blainville , Laval East and Rivière-des-Milles-Îles ridings. It is named in honour of the artist Marc-Aurèle Fortin .
This riding was significantly changed during the 2012 electoral redistribution . It lost territory to Thérèse-De Blainville and Rivière-des-Mille-Îles , and gained territory from Laval , Laval—Les Îles and Alfred-Pellan making the riding entirely within the city of Laval.
Members of Parliament [ ] This riding has elected the following Members of Parliament :
Election results [ ]
hide 2019 Canadian federal election
Party
Candidate
Votes
%
Expenditures
Liberal Yves Robillard 24,865
44.55
+3.53
$25,135.91
Bloc Québécois Lizabel Nitoi
18,069
32.37
+10.65
$9,590.09
Conservative Sonia Baudelot
5,423
9.72
-2.22
none listed
New Democratic Ali Faour
4,741
8.49
-15.10
$9,355.12
Green Bao Tran Le
2,111
3.78
+1.84
$0.00
People's Emilio Migliozzi
465
0.83
n/a
none listed
Independent Elias Progakis
143
0.26
n/a
Total valid votes/Expense limit
55,817 100.0
Total rejected ballots
924 1.63%
Turnout
56,741 72.40
Eligible voters
78,371
Liberal hold
Swing
-3.56
Source: Elections Canada [4] [5]
hide 2015 Canadian federal election
Party
Candidate
Votes
%
Expenditures
Liberal Yves Robillard 22,323
41.02
+27.17
$11,004.21
New Democratic Marie-Josée Lemieux
12,827
23.59
-25.39
$54,504.31
Bloc Québécois Patrice Jasmin-Tremblay
11,820
21.72
-2.55
$22,415.01
Conservative Nicolas Makridis
6,498
11.94
+1.57
$3,236.86
Green Lorna Mungur
1,057
1.94
-0.4
–
Total valid votes/Expense limit
54,425 100.0 $209,180.83
Total rejected ballots
769 – –
Turnout
55,294 – –
Eligible voters
76,162
Source: Elections Canada [6] [7]
2011 federal election redistributed results[8]
Party
Vote
%
New Democratic 23,154
48.98
Bloc Québécois 11,471
24.27
Liberal 6,545
13.85
Conservative 4,904
10.37
Green 1,108
2.34
Others
90
0.19
hide 2011 Canadian federal election
Party
Candidate
Votes
%
Expenditures
New Democratic Alain Giguère 29,107
49.68
+37.38
Bloc Québécois Marie-France Charbonneau
15,470
26.40
-19.12
Liberal Eduardo Gonzalo Agurto Catalán
7,035
12.01
-12.45
Conservative Johanne Théorêt
5,768
9.85
-3.97
Green Charles Sicotte
1,208
2.06
-1.82
Total valid votes/Expense limit
58,588 100.00
Total rejected ballots
751 1.27 +0.11
Turnout
59,339 67.74 +0.33
Eligible voters
59,339 – –
hide 2008 Canadian federal election
Party
Candidate
Votes
%
Expenditures
Bloc Québécois Serge Ménard 25,552
45.52
-5.5
$82,764
Liberal Robert Frégeau
13,728
24.46
+8.9
$15,982
Conservative Claude Moreau
7,759
13.82
-6.7
$43,446
New Democratic Benoît Beauchamp
6,907
12.30
+4.3
$854
Green Lise Bissonnette
2,178
3.88
-1.2
Total valid votes/Expense limit
56,124 100.0 $87,972
Total rejected ballots
661 1.16
Turnout
56,785 67.41
hide 2006 Canadian federal election
Party
Candidate
Votes
%
Expenditures
Bloc Québécois Serge Ménard 27,638
51.0
-7.9
$75,195
Conservative Claude Moreau
11,098
20.5
+14.5
$8,106
Liberal Renée Gagné
8,407
15.5
-12.2
$19,434
New Democratic Martin Duplantis
4,313
8.0
+4.4
$1,328
Green Lise Bissonnette
2,733
5.0
+1.2
Total valid votes/Expense limit
54,189 100.0 $80,381
hide 2004 Canadian federal election
Party
Candidate
Votes
%
Expenditures
Bloc Québécois Serge Ménard 30,779
58.9
–
$76,323
Liberal Nancy Girard
14,491
27.7
–
$62,416
Conservative Marc Bissonnette
3,125
6.0
–
$5,053
Green Lise Bissonnette
2,012
3.8
–
$23
New Democratic Lyse Généreux
1,867
3.6
–
$806
Total valid votes/Expense limit
52,274 100.0 $78,363
See also [ ] References [ ] Notes [ ] show Historical federal ridings in Quebec
Until 2015 Until 2006 Until 2004 Until 2000 Until 1997 Until 1993 Until 1988 Until 1984 Until 1980 Until 1979 Until 1974 Until 1972 Until 1968 Until 1962 Until 1953 Until 1949 Until 1935 Until 1925 Until 1917 Before 1900
Coordinates : 45°35′31″N 73°46′19″W / 45.592°N 73.772°W / 45.592; -73.772