Federal electoral district in Quebec, Canada
This article is about the federal district. For the provincial district, see Saint-Jean (provincial electoral district) .
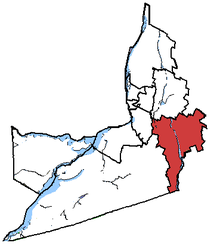
Saint-Jean electoral district Saint-Jean in relation to other Montérégie federal electoral districts.
Legislature House of Commons MP Christine Normandin Bloc Québécois District created 1966 First contested 1968 Last contested 2021 District webpage profile , map Population (2011 )[1] 108,244 Electors (2015)88,081 Area (km²)[2] 734 Pop. density (per km²) 147.5 Census subdivision(s) Saint-Jean-sur-Richelieu , Mont-Saint-Grégoire , Lacolle , Saint-Alexandre , Sainte-Anne-de-Sabrevois
Saint-Jean is a federal electoral district in Quebec , Canada, that has been represented in the House of Commons of Canada since 1968.
Geography [ ] The riding extends along the Richelieu River southeast of Montreal , in the Quebec region of Montérégie . It consists of the northern and western parts of the RCM of Le Haut-Richelieu .
The neighbouring ridings are Beauharnois—Salaberry , Brossard—La Prairie , Chambly—Borduas , Shefford , and Brome—Missisquoi .
Its population is 102,902, with 85,659 registered electors, and has an area of 734 km².
Profile [ ] Long a Bloc stronghold, the riding of Saint-Jean turned orange as the NDP swept the province of Quebec in 2011. BQ support was generally spread evenly throughout the riding, like the victorious NDP. The Liberals did slightly better in and around Lacolle than in other portions of the seat but had weak support in all parts of the riding. The Conservatives did have some pockets of good support, but they were largely isolated. Their support was largely uniform, although they did slightly better in the rural areas.
History [ ] It was created in 1966 from parts of Beauharnois—Salaberry , Châteauguay—Huntingdon—Laprairie and Saint-Jean—Iberville—Napierville ridings.
This riding was not changed during the 2012 electoral redistribution .
Members of Parliament [ ] Election results [ ]
2021 Canadian federal election
Party
Candidate
Votes
%
Bloc Québécois Christine Normandin 27,243
46.0
Liberal Jean Rioux 16,650
28.0
Conservative Serge Benoit
7,544
12,7
New Democratic Jeremy Fournier
4,308
7,3
Free Jean-Charles Cléroux
1,790
3.0
Green Leigh V. Ryan
1262
2.0
Indépendance du Québec
Pierre Duteau
413
< 0.1
Total valid votes
Total rejected ballots
Turnout
Eligible voters
Source: Elections Canada [3]
2019 Canadian federal election
Party
Candidate
Votes
%
Expenditures
Bloc Québécois Christine Normandin 27,750
44.8
+19.99
$14,561.23
Liberal Jean Rioux 18,906
30.6
-2.56
$111,054.31
Conservative Martin Thibert
6,612
10.7
-0.15
$12,932.62
New Democratic Chantal Reeves
4,794
7.7
-21.37
$0.10
Green André-Philippe Chenail
3,127
5.1
+2.98
$2,436.80
People's Marc Hivon
397
0.6
–
none listed
Indépendence du Québec
Yvon Savary
289
0.5
–
$137.94
Total valid votes/expense limit
61,875 100.0
Total rejected ballots
1,241
Turnout
63,116
Eligible voters
91,035
Population
111,190
Bloc Québécois gain from Liberal
Swing
+11.28
Source: Elections Canada [4] [5]
2015 Canadian federal election
Party
Candidate
Votes
%
Expenditures
Liberal Jean Rioux 20,022
33.16
+24.32
–
New Democratic Hans Marotte
17,555
29.07
-18.40
–
Bloc Québécois Denis Hurtubise
14,979
24.81
-5.69
–
Conservative Stéphane Guinta
6,549
10.85
+0.18
–
Green Marilyn Redivo
1,281
2.12
-0.40
–
Total valid votes/Expense limit
60,386 100.00 $228,390.29
Total rejected ballots
1,231 2.00 –
Turnout
61,617 69.69 –
Eligible voters
88,414
Liberal gain from New Democratic
Swing
+21.36
Source: Elections Canada [6] [7]
2011 Canadian federal election
Party
Candidate
Votes
%
Expenditures
New Democratic Tarik Brahmi 24,943
47.5
+37.2
Bloc Québécois Claude Bachand 16,023
30.5
-19.1
Conservative Jean Thouin
5,603
10.7
-6.7
Liberal Robert David
4,644
8.8
-8.9
Green Pierre Tremblay
1,326
2.5
-1.5
Total valid votes/Expense limit
52,539 100.0
Total rejected ballots
862 1.6 +0.1
Turnout
53,401 62.3 -5.6
Eligible voters
85,659 – –
2008 Canadian federal election
Party
Candidate
Votes
%
Expenditures
Bloc Québécois Claude Bachand 26,506
49.6
-4.4
$75,270
Liberal Claire Ste-Marie
9,430
17.7
+5.3
$18,708
Conservative Marie-Josée Mercier
9,281
17.4
-4.7
$86,608
New Democratic Philippe Refghi
5,529
10.3
+3.3
$1,813
Green Pierre Tremblay
2,160
4.0
-0.6
$872
Independent Guy Berger
520
1.0
Total valid votes/Expense limit
53,426 100.0 $87,185
Total rejected ballots
830 1.5
Turnout
54,256 67.9
2006 Canadian federal election
Party
Candidate
Votes
%
Expenditures
Bloc Québécois Claude Bachand 28,070
54.0
-6.1
$71,327
Conservative Francis Lévesque
11,516
22.1
+14.3
$6,476
Liberal Maro Akoury
6,426
12.4
-13.6
$27,591
New Democratic Mathieu-Gilles Lanciault
3,622
7.0
+3.5
$2,283
Green Véronique Bisaillon
2,371
4.6
+1.9
$311
Total valid votes/Expense limit
52,005 100.0 $80,251
2004 Canadian federal election
Party
Candidate
Votes
%
Expenditures
Bloc Québécois Claude Bachand 29,485
60.1
+12.3
$74,555
Liberal Michel Fecteau
12,729
25.9
-10.4
$73,815
Conservative Joseph Khoury
3,856
7.9
-4.6
$29,196
New Democratic Jonathan Trépanier
1,687
3.4
+2.0
$86
Green Claude Genest
1,298
2.6
–
Total valid votes/Expense limit
49,055 100.0 $77,882
Note: Conservative vote is compared to the total of the Canadian Alliance vote and Progressive Conservative vote in 2000 election.
2000 Canadian federal election
Party
Candidate
Votes
%
Bloc Québécois Claude Bachand 22,686
47.8
+1.7
Liberal Joseph Khoury
17,262
36.4
+9.2
Alliance Josée Coulombe
3,169
6.7
Progressive Conservative Gérald L'Ecuyer
2,764
5.8
-18.7
Marijuana Marc St-Jean
872
1.8
New Democratic Julien Patenaude
698
1.5
-0.1
Total valid votes
47,451 100.0
1993 Canadian federal election
Party
Candidate
Votes
%
Bloc Québécois Claude Bachand 29,753
55.9
Liberal Delbert Deschambault
14,244
26.7
-3.0
Progressive Conservative Clément Couture 7,795
14.6
-41.6
Natural Law Alain Longpré
872
1.6
New Democratic Jutta Teigeler
504
0.9
-10.8
Commonwealth of Canada Guy David
105
0.2
Total valid votes
53,273 100.0
1974 Canadian federal election
Party
Candidate
Votes
%
Liberal Walter Smith 18,798
53.3
9.4
Progressive Conservative J.-C.-Raymond Grenier
9,689
27.5
+4.9
Social Credit Claude Coté
3,014
8.6
-16.3
New Democratic Fernand Houde
2,234
6.3
+0.6
Independent André Avery
1,116
3.2
Marxist–Leninist André Davignon
250
0.7
Independent Louis Poirier
137
0.4
Total valid votes
35,238 100.0
1972 Canadian federal election
Party
Candidate
Votes
%
Liberal Walter Smith 16,459
43.9
-8.1
Social Credit André Avery
9,304
24.8
+20.3
Progressive Conservative Lucien Roy
8,462
22.6
-9.3
New Democratic Jean-Marc Lebeau
2,165
5.8
-5.1
Independent Maurice Gibeau
600
1.6
Independent Denis Lauzon
347
0.9
Independent Gilles Davignon
137
0.4
Total valid votes
37,474 100.0
Note: Social Credit vote is compared to Ralliement créditiste vote in the 1968 election.
1968 Canadian federal election
Party
Candidate
Votes
%
Liberal Walter Smith 15,878
52.0
Progressive Conservative Paul Beaulieu
9,715
31.8
New Democratic Gérard Docquier
3,332
10.9
Ralliement créditiste Louis Poirier
1,373
4.5
Démocratisation Économique Jean Meloche
214
0.7
Total valid votes
30,512 100.0
See also [ ] References [ ] Notes [ ]
Historical federal ridings in Quebec
Until 2015 Until 2006 Until 2004 Until 2000 Until 1997 Until 1993 Until 1988 Until 1984 Until 1980 Until 1979 Until 1974 Until 1972 Until 1968 Until 1962 Until 1953 Until 1949 Until 1935 Until 1925 Until 1917 Before 1900
Coordinates : 45°14′N 73°14′W / 45.24°N 73.24°W / 45.24; -73.24