Federal electoral district in Quebec, Canada
This article
needs additional citations for verification .
Please help by adding citations to reliable sources . Unsourced material may be challenged and removed.Find sources: – · · · scholar · JSTOR (May 2011 ) (Learn how and when to remove this template message )
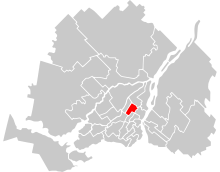
Saint-Léonard—Saint-Michel electoral district Saint-Léonard—Saint-Michel in relation to other electoral districts in Montreal and Laval
Legislature House of Commons MP Patricia Lattanzio Liberal District created 1987 First contested 1988 Last contested 2021 District webpage profile , map Population (2016 )[1] 113,212 Electors (2021)74,279 Area (km²)[2] 21 Pop. density (per km²) 5,391 Census division(s) Montreal Census subdivision(s) Montreal
Saint-Léonard—Saint-Michel (formerly Saint-Léonard ) is a federal electoral district within the City of Montreal in Quebec , Canada, that has been represented in the House of Commons of Canada since 1988. Its population during the 2011 election was 108,811.[3] Patricia Lattanzio who is the first woman to represent this riding since its creation and is also a member of the Liberal Party . This riding is one of the safest Liberal ridings in all of Canada having elected the last candidate with over 69% of the vote.[4]
Geography [ ] The district includes the entire Borough of Saint Leonard , and the neighbourhood of Saint-Michel which is a part of the Borough of Villeray–Saint-Michel–Parc-Extension .
Demographics [ ] According to the Canada 2016 Census Languages (2016 mother tongue) : 33.4% French, 17.0% Italian, 12.0% Arabic, 8.6% Spanish, 6.8% English, 6.2% Creole, 2.8% Vietnamese, 1.6% Kabyle, 1.4% Portuguese, 1.1% Khmer, 0.9% Cantonese, 0.9% Tamil,.0.8% Turkish, 0.5% Romanian, 0.5% Bengali, 0.4% Min Nan, 0.4% Mandarin, 0.3% Greek, 0.3% Polish, 0.3% Ukrainian[5] History [ ] "Saint-Léonard" riding was first created in 1976 from parts of Maisonneuve—Rosemont , Mercier and Saint-Michel ridings. The name of the riding was changed in 1977 to Saint-Léonard—Anjou before an election was held. It consisted of the City of Saint-Léonard, the Town of Anjou, and part of the City of Montreal.
The neighbouring ridings are Rosemont—La Petite-Patrie , Papineau , Ahuntsic , Bourassa , Honoré-Mercier , and Hochelaga .
The current electoral district was created as "Saint-Léonard" riding in 1987 from parts of Gamelin and Saint-Léonard—Anjou ridings. In 1996, its name was changed to "Saint-Léonard—Saint-Michel".
This riding lost some territory to Papineau , and gained territory from Ahuntsic and Hochelaga during the 2012 electoral redistribution .
Members of Parliament [ ] This riding has elected the following Members of Parliament :
Parliament
Years
Member
Party
Saint-LéonardRiding created from Gamelin and Saint-Léonard—Anjou
34th
1988–1993 Alfonso Gagliano Liberal 35th
1993–1997
Saint-Léonard—Saint-Michel
36th
1997–2000 Alfonso Gagliano Liberal 37th
2000–2002
2002–2004 Massimo Pacetti
38th
2004–2006 39th
2006–2008 40th
2008–2011 41st
2011–2014
2014–2015 Independent
42nd
2015–2019 Nicola Di Iorio Liberal 43rd
2019–2021 Patricia Lattanzio 44th
2021–present
Election results [ ] Saint-Léonard—Saint-Michel, 1996-present [ ]
2021 Canadian federal election
Party
Candidate
Votes
%
Expenditures
Liberal Patricia Lattanzio 29,024
69.2
+7.9
N/A
Conservative Louis Ialenti
4,381
10.4
-1.5
N/A
Bloc Québécois Laurence Massey
3,487
8.3
-1.2
N/A
New Democratic Alicia Di Tullio
3,460
8.3
+1.8
N/A
People's Daniele Ritacca
1,579
3.8
+2.7
N/A
Total valid votes/Expense limit
41,814 100.0 N/A
Total rejected ballots
890 N/A
Turnout
42,704 56.45 -3.93
Eligible voters
74,279
Liberal hold
Swing
+8
Source: Elections Canada [6]
2019 Canadian federal election
Party
Candidate
Votes
%
Expenditures
Liberal Patricia Lattanzio 27,866
61.33
-3.40
$39,698.45
Conservative Ilario Maiolo
5,423
11.94
+0.81
$50,901.27
Bloc Québécois Dominique Mougin
4,351
9.58
+2.39
none listed
Independent Hassan Guillet
3,061
6.74
–
none listed
New Democratic Paulina Ayala 2,964
6.52
-8.33
$1,299.32
Green Alessandra Szilagyi
1,183
2.60
0.79
$512.28
People's Tina Di Serio
501
1.10
–
$1,392.50
Marxist–Leninist Garnet Colly
85
0.19
-0.10
$0.00
Total valid votes
45,434 100.0
Total rejected ballots
993 2.19
Turnout
46,427 60.38 +1.16
Eligible voters
76,885
Liberal hold
Swing
-2.11
Source: Elections Canada [7] [8]
2015 Canadian federal election
Party
Candidate
Votes
%
Expenditures
Liberal Nicola Di Iorio 28,835
64.73
+22.56
$153,190.81
New Democratic Rosannie Filato
6,611
14.85
-17.15
$22,492.22
Conservative Jean Philippe Fournier
4,957
11.13
-2.50
$3,960.19
Bloc Québécois Steeve Gendron
3,204
7.19
-2.46
$3,404.74
Green Melissa Miscione
805
1.81
+0.04
$19.00
Marxist–Leninist Arezki Malek
128
0.29
-0.19
–
Total valid votes/Expense limit
44,531 100.0 $209,748.64
Total rejected ballots
689 1.52
Turnout
45,220 59.22 +7.71
Eligible voters
76,531
Liberal notional hold
Swing
+19.86
Source: Elections Canada [9] [10]
2011 federal election redistributed results[11]
Party
Vote
%
Liberal 15,702
42.17
New Democratic 12,026
32.30
Conservative 5,075
13.63
Bloc Québécois 3,592
9.65
Green 660
1.77
Others
179
0.48
2011 Canadian federal election
Party
Candidate
Votes
%
Expenditures
Liberal Massimo Pacetti 15,340
42.30
-14.95
New Democratic Roberta Peressini
11,720
32.32
+21.64
Conservative Riccardo De Ioris
4,991
13.76
-1.12
Bloc Québécois Alain Bernier
3,396
9.36
-4.24
Green Michael Di Pardo
657
1.81
-1.00
Marxist–Leninist Garnet Colly
162
0.45
+0.02
Total valid votes/Expense limit
36,266 100.00
Total rejected ballots
674 1.75 +0.18
Turnout
36,940 51.51 -2.08
Eligible voters
71,717 – –
Liberal hold
Swing
-18.30
2008 Canadian federal election
Party
Candidate
Votes
%
Expenditures
Liberal Massimo Pacetti 21,652
57.25
-0.08
$58,674
Conservative Lucie Le Tourneau
5,627
14.88
+0.47
$28,585
Bloc Québécois Farid Salem
5,146
13.60
-5.14
$8,509
New Democratic Laura Colella
4,039
10.68
+3.86
$2,036
Green Frank Monteleone
1,063
2.81
+0.50
Marxist–Leninist Garnet Colly
165
0.43
-0.09
Independent Joseph Young
122
0.32
–
$743
Total valid votes/Expense limit
37,814 100.00 $81,851
Total rejected ballots
604 1.57 +0.05
Turnout
38,418 53.59
Liberal hold
Swing
-0.3
2006 Canadian federal election
Party
Candidate
Votes
%
Expenditures
Liberal Massimo Pacetti 23,705
57.17
−6.73
$66,670
Bloc Québécois Justine Charlemagne
7,772
18.74
−3.11
$20,789
Conservative Ercolano Pingiotti
5,975
14.41
+9.13
$15,672
New Democratic Laura Colella
2,831
6.83
+0.85
$4,702
Green Pierre-Louis Parant
961
2.32
−0.01
none listed
Marxist–Leninist Stéphane Chénier
219
0.53
−0.13
none listed
Total valid votes
41,463 100.00
Total rejected ballots
640
Turnout
42,103 57.00 +2.48
Electors on the lists
73,869
Sources: Official Results, Elections Canada and Financial Returns, Elections Canada .
2004 Canadian federal election
Party
Candidate
Votes
%
Expenditures
Liberal Massimo Pacetti 25,884
63.90
−12.76
$63,440
Bloc Québécois Paul-Alexis François
8,852
21.85
+7.40
$9,289
New Democratic Laura Colella
2,422
5.98
$6,007
Conservative Payam Eslami
2,138
5.28
−0.11
$5,647
Green Ricardo Fellicetti
944
2.33
none listed
Marxist–Leninist Stéphane Chénier
267
0.66
none listed
Total valid votes
40,507 100.00
Total rejected ballots
855
Turnout
41,362 54.52
Electors on the lists
75,864
Note: Conservative vote is compared to the Progressive Conservative vote in 2000 election.
Sources: Official Results, Elections Canada and Financial Returns, Elections Canada . Percentage change totals are in relation to the 2000 general election.
Canadian federal by-election, 13 May 2002Alfonso Gagliano
Party
Candidate
Votes
%
Liberal Massimo Pacetti 14,076
83.5
+6.9
Bloc Québécois Umberto Di Genova
1,495
8.9
-5.6
Progressive Conservative Antonio Cordeiro
634
3.8
+1.5
New Democratic Normand Caplette
447
2.7
+1.5
Marijuana Marc-Boris St-Maurice
197
1.2
-0.2
Total valid votes
16,849 100.0
2000 Canadian federal election
Party
Candidate
Votes
%
Liberal Alfonso Gagliano 35,396
76.7
+6.9
Bloc Québécois Marcel Ferlatte
6,679
14.5
-1.9
Alliance Daniel Champagne
1,750
3.8
Progressive Conservative Mostafa Ben Kirane
1,057
2.3
-9.3
Marijuana Karina Néron
635
1.4
New Democratic Sara Mayo
528
1.1
-1.2
Marxist–Leninist Yves Le Seigle
127
0.3
Total valid votes
46,172 100.0
1997 Canadian federal election
Party
Candidate
Votes
%
Liberal Alfonso Gagliano 36,088
69.8
+8.6
Bloc Québécois Umberto Di Genova
8,457
16.3
-11.0
Progressive Conservative Ronald Gosselin
5,990
11.6
+3.0
New Democratic Pierre J.C. Allard
1,198
2.3
+1.1
Total valid votes
51,733 100.0
Saint-Léonard, 1987-1996 [ ]
1993 Canadian federal election
Party
Candidate
Votes
%
Liberal Alfonso Gagliano 28,799
61.2
+10.9
Bloc Québécois Umberto Di Genova
12,879
27.4
Progressive Conservative Tony Tomassi 4,021
8.5
-28.7
New Democratic David D'Andrea
583
1.2
-8.9
Natural Law Marlène Charland
497
1.1
Marxist–Leninist Claude Brunelle
141
0.3
Abolitionist Mauro Fusco
91
0.2
Commonwealth of Canada Sylvain Deschênes
77
0.2
Total valid votes
47,088 100.0
1988 Canadian federal election
Party
Candidate
Votes
%
Liberal Alfonso Gagliano 23,014
50.3
Progressive Conservative Marc Beaudoin
17,055
37.2
New Democratic Michel Roche
4,663
10.2
Green Rolf Bramann
833
1.8
Independent Bernard Papillon
231
0.5
Total valid votes
45,796 100.0
See also [ ] References [ ] Notes [ ]
Federal ridings in Montreal and Laval
Liberal Bloc Québécois New Democratic
Historical federal ridings in Quebec
Until 2015 Until 2006 Until 2004 Until 2000 Until 1997 Until 1993 Until 1988 Until 1984 Until 1980 Until 1979 Until 1974 Until 1972 Until 1968 Until 1962 Until 1953 Until 1949 Until 1935 Until 1925 Until 1917 Before 1900
Coordinates : 45°35′20″N 73°35′20″W / 45.589°N 73.589°W / 45.589; -73.589