Federal electoral district in Quebec, Canada
This article is about the federal district. For the provincial district, see Outremont (provincial electoral district) .
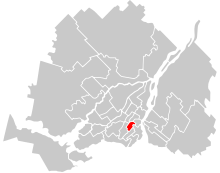
Outremont electoral district Outremont in relation to other electoral districts in Montreal and Laval
Legislature House of Commons MP Rachel Bendayan Liberal District created 1933 First contested 1935 Last contested 2021 District webpage profile , map Population (2016 )[1] 102,088 Electors (2019)67,842 Area (km²)[2] 11.95 Pop. density (per km²) 8,542.9 Census division(s) Montreal Census subdivision(s) Montreal
Outremont is a federal electoral district in Montreal , Quebec , Canada, that has been represented in the House of Commons of Canada since 1935. It was known as Outremont—Saint-Jean from 1947 to 1966. Its population in 2006 was 95,711. Its current Member of Parliament is Rachel Bendayan of the Liberal Party of Canada .[3]
Demographics [ ] According to the Canada 2011 Census [4] Ethnic groups: 69.5% White, 6.9% Black, 6.7% Arab, 3.8% Latino, 2.8% Filipino, 2.4% South Asian, 2.1% Southeast Asian, 2.0% Chinese, 1.7% Indigenous, 2.1% OtherLanguages: 47.9% French, 16.5% English, 5.4% Arabic, 4.8% Yiddish, 4.6% Spanish, 1.9% Portuguese, 1.8% Greek, 1.5% Romanian, 1.4% Tagalog, 1.3% Russian, 12.9% OtherReligions: 50.7% Christian, 11.0% Jewish, 9.5% Muslim, 1.3% Buddhist, 1.2% Hindu, 0.3% Other, 26.0% NoneMedian income: $22,551 (2010) Average income: $39,486 (2010)
According to the Canada 2016 Census Languages: (2016) 54.9% French, 23.5% English, 4.9% Yiddish, 2.7% Spanish, 2.4% Arabic, 1.5% Farsi, 1.1% Portuguese, 0.9% Greek, 0.9% Romanian, 0.8% Tagalog, 0.8% Russian, 0.8% Mandarin, 0.6% Vietnamese[5] Geography [ ] The district includes the borough of Outremont , the eastern part of Côte-des-Neiges in the borough of Côte-des-Neiges—Notre-Dame-de-Grâce , and the western part of Mile End in the borough of Le Plateau-Mont-Royal , plus bits of upper Downtown Montreal in the borough of Ville-Marie , La Petite-Patrie in the borough of Rosemont–La Petite-Patrie , and Parc Extension in the borough of Villeray–Saint-Michel–Parc-Extension .
Political geography [ ] In the 2006 election, the Liberals had their strongest support in Côte-des-Neiges , on the eastern slopes of Mont-Royal and in the small part of the riding in the Parc-Extension neighbourhood. The Bloc had its support concentrated in the borough of Outremont, and around the Université de Montréal . The New Democratic Party (NDP) won all of its polls in Mile-End where it obtained most of its polls. The Conservatives won just three polls in the riding all of which were around the western border of the Outremont border.
In the 2007 by-election, the NDP almost swept the riding. Their strongest areas were in Mile-End , Jeanne-Mance , and around the Université de Montréal . It was not uncommon for the NDP win more than 70% of the vote in these polls. The Bloc Québécois vote had collapsed, most of which went to the NDP. They did not win a single poll. Liberal support was relegated to the small part of Parc-Extension in the riding, the area around Rue Jean-Talon and the area on the opposite side of Mount Royal along Avenue des Pins . The Conservatives held on to one of their three polls.
In the 2008 election, the NDP held on to Outremont, albeit with a lower percentage of overall support.
Until the 2011 election , this riding was the only riding in Quebec to be held by the NDP. Mulcair held it since winning a by-election in 2007, earning a seat for the party for only the second time in history. He was challenged in 2011 by Liberal Martin Cauchon, who held this riding from 1993 to 2004 and was a former cabinet minister.
History [ ] The electoral district was created in 1933 from parts of Laurier—Outremont and Mount Royal ridings.
This riding lost territory to Papineau , Notre-Dame-de-Grâce—Westmount , Laurier—Sainte-Marie , Ville-Marie—Le Sud-Ouest—Île-des-Sœurs and Rosemont—La Petite-Patrie , and gained territory from Laurier—Sainte-Marie , Westmount—Ville-Marie and Mount Royal during the 2012 electoral redistribution .
2007 by-election [ ] Main article: 2007 Outremont by-election
After the resignation of Jean Lapierre on 28 January 2007, a by-election was called for 17 September 2007. In the by-election, this riding was won by the NDP candidate Thomas Mulcair.
Mulcair retained the riding for the NDP in the 2008 federal election , marking the NDP's first re-election and first general election victory in Quebec.
2019 by-election [ ] Main article: 2019 Outremont federal by-election
Former boundaries [ ] Members of Parliament [ ] This riding has elected the following Members of Parliament :
Election results [ ] Outremont, 1968–present [ ] Graph of election results in Outremont 1968-present (minor parties that never got 2% of the vote or didn't run consistently are omitted)
2021 Canadian federal election
Party
Candidate
Votes
%
Expenditures
Liberal Rachel Bendayan 16,714
45.4
-0.8
New Democratic Ève Péclet 9,579
26.0
+5.9
Bloc Québécois Célia Grimard
5,535
15.0
+1.1
Conservative Jasmine Louras
2,882
7.8
+1.3
Green Grace Tarabey
1,198
3.3
-8.8
People's Yehuda Pinto
819
2.2
+1.3
Independent Angela-Angie Joshi
93
0.3
N/A
Total valid votes
36,820 98.8
Total rejected ballots
456 1.2
Turnout
37,276 57.2 -5.0
Eligible voters
65,143
Liberal hold
Swing
-3.4
Source: Elections Canada [6]
2019 Canadian federal election
Party
Candidate
Votes
%
Expenditures
Liberal Rachel Bendayan 19,148
46.19
+5.76
$47,498.81
New Democratic Andrea Clarke
8,319
20.07
-7.45
none listed
Bloc Québécois Célia Grimard
5,741
13.85
+2.63
$9,862.60
Green Daniel Green 5,018
12.1
-0.83
none listed
Conservative Jasmine Louras
2,707
6.53
+0.39
$4,912.03
People's Sabin Levesque
369
0.89
-0.65
none listed
Rhinoceros Mark John Hiemstra
155
0.37
none listed
Total valid votes/expense limit
41,457 100.0 $102,446.50
Total rejected ballots
455
Turnout
41,912 62.2
Eligible voters
67,842
Liberal hold
Swing
+6.61
Source: Elections Canada [7] [8]
Canadian federal by-election, February 25, 2019 Tom Mulcair
Party
Candidate
Votes
%
Liberal Rachel Bendayan 6,086
40.43
+6.97
New Democratic Julia Sánchez
4,142
27.52
-16.60
Green Daniel Green 1,946
12.93
+9.32
Bloc Québécois Michel Duchesne
1,674
11.12
+2.71
Conservative Jasmine Louras
925
6.14
-3.39
People's James Seale
232
1.54
-
Independent William Barrett
48
0.32
-
Total valid votes
15,053 99.11
Total rejected ballots
135 0.89 -0.08
Turnout
15,188 21.57 -40.35
Eligible voters
70,414
Liberal gain from New Democratic
Swing
+11.78
Source: Elections Canada [9]
2015 Canadian federal election
Party
Candidate
Votes
%
Expenditures
New Democratic Tom Mulcair 19,242
44.11
−11.57
$101,332.88
Liberal Rachel Bendayan 14,597
33.46
+11.84
$101,506.39
Conservative Rodolphe Husny
4,159
9.53
+1.55
$7,828.89
Bloc Québécois Roger Galland Barou
3,668
8.41
−3.20
$6,959.30
Green Amara Diallo
1,575
3.61
+1.37
–
Libertarian Francis Pouliot
216
0.50
–
–
Communist Adrien Welsh
162
0.37
–
–
Total valid votes/Expense limit
43,619 100.00 – $204,392.07
Total rejected ballots
426 0.97 – –
Turnout
44,045 62.42 – –
Eligible voters
70,559 – – –
Source: Elections Canada [10] [11]
2011 federal election redistributed results[12]
Party
Vote
%
New Democratic 23,317
55.68
Liberal 9,055
21.62
Bloc Québécois 4,860
11.61
Conservative 3,343
7.98
Green 937
2.24
Others
362
0.86
2011 Canadian federal election
Party
Candidate
Votes
%
Expenditures
New Democratic Tom Mulcair 21,906
56.37
+16.84
$80,457
Liberal Martin Cauchon 9,204
23.69
−9.39
$51,130
Conservative Rodolphe Husny
3,408
8.77
−1.76
$18,319
Bloc Québécois Élise Daoust
3,199
8.23
−4.32
$10,456
Green François Pilon
838
2.16
−2.15
$4,578
Rhinoceros Tommy Gaudet
160
0.41
–
Communist Johan Boyden
143
0.37
–
Total valid votes
38,858 100.00
Total rejected ballots
291 0.74 +0.05
Turnout
39,149 60.46 +4.35
Electors on the lists
65,573
Source: Official Voting Results, 41st General Election 2011, Elections Canada
2008 Canadian federal election
Party
Candidate
Votes
%
Expenditures
New Democratic Tom Mulcair 14,348
39.53
−7.97
$69,072
Liberal Sébastien Dhavernas 12,005
33.08
+4.12
$45,118
Bloc Québécois Marcela Valdivia
4,554
12.55
+1.62
$48,279
Conservative Lulzim Laloshi
3,820
10.53
+1.96
$25,770
Green François Pilon
1,566
4.31
+2.10
not listed
Total valid votes
36,293 100.00
Total rejected ballots
253 0.69
Turnout
36,546 56.11 +18.68
Electors on the lists
64,556
New Democratic hold
Swing
−6.05
Source: Official Voting Results, 40th General Election 2008, Elections Canada .by-election , not to the previous general election.
Jean Lapierre
Party
Candidate
Votes
%
Expenditures
New Democratic Thomas Mulcair 11,374
47.50
+30.03
$76,194
Liberal Jocelyn Coulon 6,933
28.96
−6.22
$72,539
Bloc Québécois Jean-Paul Gilson
2,618
10.93
−18.08
$57,717
Conservative Gilles Duguay
2,052
8.57
−4.16
$66,401
Green François Pilon
529
2.21
−2.61
$169
neorhino.ca François Yo Gourd 145
0.61
–
$1,774
Independent Mahmood Raza Baig
78
0.33
–
$45
Independent Jocelyne Leduc
61
0.25
–
$6
Independent Romain Angeles
46
0.19
–
$157
Canadian Action Alexandre Amirizian
45
0.19
–
$0
Independent Régent Millette
32
0.13
+0.08
none listed
Independent John Turmel 30
0.13
–
none listed
Total valid votes
23,943 100.00
Total rejected ballots
175 0.73 +0.03
Turnout
24,118 37.43 −23.35
Electors on the lists
64,438
New Democratic gain from Liberal
Swing
−18.3
2006 Canadian federal election
Party
Candidate
Votes
%
Expenditures
Liberal Jean Lapierre 14,282
35.18
−5.76
$69,816
Bloc Québécois Jacques Léonard 11,778
29.01
−4.24
$63,590
New Democratic Léo-Paul Lauzon 6,984
17.20
+3.14
$26,625
Conservative Daniel Fournier 5,168
12.73
+6.76
$73,991
Green François Pilon
1,957
4.82
+0.53
$425
Indepenent
Eric Roach Denis 101
0.25
$431
Progressive Canadian Philip Paynter
94
0.23
none listed
Marxist–Leninist Linda Sullivan
88
0.22
−0.09
none listed
Indepenent
Yan Lacombe
85
0.21
none listed
Indepenent
Xavier Rochon
34
0.08
$572
Indepenent
Régent Millette
22
0.05
none listed
Total valid votes
40,593 100.00
Total rejected ballots
282 0.69
Turnout
40,875 60.78 −4.65
Electors on the lists
67,253
Source: Official Results, Elections Canada and Financial Returns, Elections Canada .
2004 Canadian federal election
Party
Candidate
Votes
%
Expenditures
Liberal Jean Lapierre 15,675
40.94
−6.74
$58,392
Bloc Québécois François Rebello 12,730
33.25
+4.96
$63,640
New Democratic Omar Aktouf
5,382
14.06
+8.48
$11,371
Conservative Marc Rousseau
2,284
5.97
−5.37
$38,835
Green Shaun Perceval-Maxwell
1,643
4.29
+0.54
$475
Marijuana Yan Lacombe
452
1.18
-1.39
Marxist–Leninist Linda Sullivan
120
0.31
−0.18
Total valid votes/Expense limit
38,286 100.00 – $73,313
2000 Canadian federal election
Party
Candidate
Votes
%
Expenditures
Liberal Martin Cauchon 18,796
47.68
−2.47
$52,920
Bloc Québécois Amir Khadir 11,151
28.29
−0.10
$50,207
Progressive Conservative Robert Archambault
3,190
8.09
−4.12
$3,360
New Democratic Peter Graefe
2,199
5.58
−0.86
$590
Green Jan Schotte
1,478
3.75
–
$260
Alliance Josée Duchesneau
1,283
3.25
–
$1,425
Marijuana Huguette Plourde
1,013
2.57
–
none listed
Marxist–Leninist Louise Charron
194
0.49
−0.36
$10
Communist Pierre Smith
118
0.30
–
$187
Total
39,422 100.00
1997 Canadian federal election
Party
Candidate
Votes
%
Liberal Martin Cauchon 22,271
50.15
+3.34
Bloc Québécois Michel Sarra-Bournet
12,608
28.39
−8.98
Progressive Conservative Marguerite Sicard
5,424
12.21
+3.30
New Democratic Tooker Gomberg 2,862
6.44
+1.89
Natural Law Denis Cauchon
868
1.95
+0.45
Marxist–Leninist Louise Charron
378
0.85
+0.46
Total
44,411 100.00 –
1993 Canadian federal election
Party
Candidate
Votes
%
Liberal Martin Cauchon 21,638
46.81
+12.10
Bloc Québécois Jean-Louis Hérivault
17,274
37.37
–
Progressive Conservative Jean Pierre Hogue
4,119
8.91
−29.52
New Democratic Catherine Kallos
2,104
4.55
−15.93
Natural Law Daniel Bergeron
694
1.50
–
Marxist–Leninist Michel Rocheleau
179
0.39
–
Abolitionist Sylvain M. Coulombe
131
0.28
–
Commonwealth of Canada Mamunor Rashid
89
0.19
−0.07
Total
46,228 100.00 –
1988 Canadian federal election
Party
Candidate
Votes
%
Progressive Conservative Jean-Pierre Hogue 17,597
38.43
+9.15
Liberal Lucie Pépin 15,895
34.71
−6.21
New Democratic Louise O'Neill
9,379
20.48
+1.82
Green Harriett Fels
1,342
2.93
+0.42
Rhinoceros Milenko P. Miljévic
1,077
2.35
−1.84
Communist Monique Marcotte
200
0.44
−0.07
Independent Fernand Deschamps
183
0.40
–
Commonwealth of Canada Guy Huard
117
0.26
−0.13
Total
45,790 100.00 –
1984 Canadian federal election
Party
Candidate
Votes
%
Liberal Lucie Pépin 14,508
40.92
−30.57
Progressive Conservative Anne-Marie Sylvestre
10,383
29.28
+21.96
New Democratic Johanne Beaudin
6,687
18.86
+6.44
Rhinoceros Claude V.U. Hamel
1,484
4.19
−2.235
Parti nationaliste Roger Lebeuf
1,185
3.34
–
Green François Lubrina
890
2.51
–
Communist Jocelyne Rioux
182
0.51
+0.04
Commonwealth of Canada Christiane Deland-Gervais
139
0.39
–
Total
35,458 100.00 –
1980 Canadian federal election
Party
Candidate
Votes
%
Liberal Marc Lalonde 23,004
71.49
−0.66
New Democratic Claire A. Brisson
3,996
12.42
+2.09
Progressive Conservative Diane Chevrette
2,355
7.32
+1.96
Rhinoceros Philippe Langlois
2,065
6.42
−0.02
Independent Danielle Trudel
277
0.86
–
Communist Jocelyne Rioux
150
0.47
+0.01
Independent H.-Georges Grenier
140
0.44
–
Union populaire Colette Picard-Desjardins
128
0.40
+0.13
Marxist–Leninist Robert Wallace
64
0.20
−0.03
Total
32,179 100.00 –
1979 Canadian federal election
Party
Candidate
Votes
%
Liberal Marc Lalonde 28,710
72.15
−0.15
New Democratic Claire A. Brisson
4,112
10.33
−1.91
Rhinoceros Serge Beauchemin
2,564
6.44
–
Progressive Conservative Henriette Guérin
2,134
5.36
−5.30
Social Credit Philippe Chartrand
1,765
4.44
+2.09
Communist Jocelyne Rioux
185
0.46
–
Independent Fred Haight
122
0.31
–
Union populaire G. Spooner
108
0.27
–
Marxist–Leninist Robert Wallace
91
0.23
−0.86
Total
39,791 100.00 –
1974 Canadian federal election
Party
Candidate
Votes
%
Liberal Marc Lalonde 20,400
72.30
+6.82
New Democratic Georges Louis Valois
3,453
12.24
−3.74
Progressive Conservative Symone Beaudin
3,007
10.66
+2.06
Social Credit Joseph-Endré De Csavossy
663
2.35
−1.95
Independent Vera Jackson
399
1.41
–
Marxist–Leninist Micheline Mélanson
292
1.03
–
Total
28,214 100.00 –
1972 Canadian federal election
Party
Candidate
Votes
%
Liberal Marc Lalonde 21,399
65.48
−13.18
New Democratic Henri-François Gautrin
5,223
15.98
+4.58
Progressive Conservative André Poitras
2,811
8.60
−1.34
Rhinoceros Réginald Martel
1,565
4.79
–
Social Credit Maurice Benoit
1,404
4.30
–
Independent Harold J. Glick
168
0.51
–
Independent H.-Georges Grenier
109
0.33
–
Total
32,679 100.00 –
1968 Canadian federal election
Party
Candidate
Votes
%
Liberal Aurélien Noël 24,219
78.66
+23.99
New Democratic Saul Handelman
3,511
11.40
−31.03
Progressive Conservative Neil Morrison
3,059
9.94
–
Total
30,789 100.00 –
Outremont—Saint-Jean, 1949–1968 [ ]
Canadian federal by-election, 29 May 1967
Party
Candidate
Votes
%
On Mr. Lamontagne's resignation, 4 June 1967
Liberal Aurélien Noël 6,262
54.67%
+2.10%
New Democratic Denis Lazure
4,860
42.43%
+25.89%
Esprit social
Henri-Georges Grenier
214
1.87%
−0.19%
Rhinoceros F.-L.-M. Bonnier
118
1.03%
Total valid votes
11,454 100.00%
1965 Canadian federal election
Party
Candidate
Votes
%
Liberal Maurice Lamontagne 11,855
52.57%
−4.06%
New Democratic Monique Ferron
3,730
16.54%
−1.45%
Progressive Conservative Albert Guilbeault
3,241
14.37%
−5.56%
Ralliement créditiste André Poitras
3,259
14.45%
+9.01%
2.06%
Droit vital personnel
Henri-Georges Grenier
465
2.06%
Total valid votes
22,550 100.00%
Note: Ralliement créditiste vote is compared to Social Credit vote in the 1963 election.
1963 Canadian federal election
Party
Candidate
Votes
%
Liberal Maurice Lamontagne 13,305
56.63%
+9.55%
Progressive Conservative Marc Lacoste
4,684
19.94%
−10.28%
New Democratic Thérèse Casgrain 4,227
17.99%
−2.02%
Social Credit Léopold Savard
1,278
5.44%
+2.76%
Total valid votes
23,494 100.00%
1962 Canadian federal election
Party
Candidate
Votes
%
Liberal Romuald Bourque 10,134
47.08%
−8.51%
Progressive Conservative Marc Lacoste
6,504
30.22%
−8.72%
New Democratic Thérèse Casgrain 4,308
20.02%
+14.55%
Social Credit Jean-Guy Laprise
577
2.68%
Total valid votes
21,523 100.00%
Note: NDP vote is compared to CCF vote in 1958 election.
1958 Canadian federal election
Party
Candidate
Votes
%
Liberal Romuald Bourque 12,715
55.60%
−17.10%
Progressive Conservative Conrad Archambault
8,906
38.94%
+18.46%
Co-operative Commonwealth Gaston Miron 1,249
5.46%
−1.36%
Total valid votes
22,870 100.00%
1957 Canadian federal election
Party
Candidate
Votes
%
Liberal Romuald Bourque 13,840
72.70%
+3.92%
Progressive Conservative René Dostaler
3,899
20.48%
−4.65%
Co-operative Commonwealth Gaston Miron 1,299
6.82%
+4.22%
Total valid votes
19,038 100.00%
1953 Canadian federal election
Party
Candidate
Votes
%
Liberal Romuald Bourque 11,536
68.77%
+12.75%
Progressive Conservative Gaston Sylvestre
4,216
25.13%
−3.37%
Co-operative Commonwealth Pierre-D. Gagnon
436
2.60%
−7.50%
Labor–Progressive Anne Eizner
406
2.42%
Independent Progressive Conservative
Homère Louiselle
180
1.07%
Total valid votes
16,774 100.00%
Canadian federal by-election, 6 October 1952
Party
Candidate
Votes
%
On Mr. Rinfret being appointed Puisne Judge, Court of Queen's Bench, Quebec, 12 February 1952
Liberal Romuald Bourque
6,294
56.02%
−20.30%
Progressive Conservative Claude Nolin
3,203
28.51%
+4.83%
Co-operative Commonwealth Thérèse Casgrain 1,135
10.10%
Independent Liberal
Raymond Bourque
442
3.93%
Independent Ben Ash
161
1.43%
Total valid votes
11,235 100.00%
1949 Canadian federal election
Party
Candidate
Votes
%
Liberal Édouard Rinfret 16,215
76.32%
+20.28%
Progressive Conservative Alphonse Bélanger
5,030
23.68%
+9.51%
Total valid votes
21,245 100.00%
Outremont, 1935–1949 [ ]
1945 Canadian federal election
Party
Candidate
Votes
%
Liberal Édouard-Gabriel Rinfret 14,836
56.04%
−8.01%
Progressive Conservative Joseph Hector Bender
3,750
14.17%
Bloc populaire Joseph-Alfred Goyer
3,259
12.31%
Independent Liberal
John P. Callaghan
1,762
6.66%
Co-operative Commonwealth Abraham Jacob Rosenstein
1,639
6.19%
Labor–Progressive Gertrude Partridge
1,227
4.63%
Total valid votes
26,473 100.00%
Canadian federal by-election, 30 November 1942
Party
Candidate
Votes
%
On Mr. Vien's resignation, 5 October 1942
Liberal Léo Richer Laflèche 12,378
64.05%
−2.35%
Bloc populaire Jean Drapeau 6,948
35.95%
Total valid votes
19,326 100.00%
1940 Canadian federal election
Party
Candidate
Votes
%
Liberal Thomas Vien 14,511
66.40%
10.50%
National Government Joseph-Hector Bender
4,556
20.85%
−14.10%
Independent Liberal
Ernest Poulin
2,787
12.75%
Total valid votes
21,854 100.00%
Note: "National Government" vote is compared to Conservative vote in 1935 election.
1935 Canadian federal election
Party
Candidate
Votes
%
Liberal Thomas Vien 11,260
55.90%
Conservative Jean-Joseph Penverne
7,040
34.95%
Reconstruction Hervé Roch
1,844
9.15%
Total valid votes
20,144 100.00%
See also [ ] References [ ] Notes [ ]
^ Statistics Canada : 2017^ Statistics Canada : 2017^ Ibbitson, John (February 26, 2019). "What the by-elections tell us about Ottawa politics (and who should watch his back) - The Globe and Mail" . The Globe and Mail . ^ "National Household Survey (NHS) Profile, 2011" . May 8, 2013.^ "First Official Language Spoken (7), Language Spoken Most Often at Home (269), Age (15A) and Sex (3) for the Population Excluding Institutional Residents of Canada, Provinces and Territories and Federal Electoral Districts (2013 Representation Order), 2016 Census - 100% Data" . August 2, 2017.^ "List of confirmed candidates – September 20, 2021 Federal Election" . Elections Canada . Retrieved September 2, 2021 .^ "List of confirmed candidates" . Elections Canada . Retrieved October 3, 2019 .^ "Election Night Results" . Elections Canada. Retrieved November 11, 2019 .^ "February 25, 2019 By-elections Election Results" . Elections Canada . February 27, 2019. Retrieved February 27, 2019 .^ Elections Canada – Election Results, 22 October 2015 ^ Elections Canada – Preliminary Election Expenses Limits for Candidates ^ Pundits' Guide to Canadian Elections
External links [ ]
Federal ridings in Montreal and Laval
Liberal Bloc Québécois New Democratic
Historical federal ridings in Quebec
Until 2015 Until 2006 Until 2004 Until 2000 Until 1997 Until 1993 Until 1988 Until 1984 Until 1980 Until 1979 Until 1974 Until 1972 Until 1968 Until 1962 Until 1953 Until 1949 Until 1935 Until 1925 Until 1917 Before 1900
Coordinates : 45°30′30″N 73°36′30″W / 45.50833°N 73.60833°W / 45.50833; -73.60833