Cost of electricity by source


Levelized cost of energy (LCOE) is a measure of the average net present cost of electricity generation for a generating plant over its lifetime.
Different methods of electricity generation can incur significantly different costs, and these costs can occur at significantly different times relative to when the power is used. The costs include the initial capital, and the costs of continuous operation, fuel, and maintenance as well as the costs of de-commissioning and remediating any environmental damage. Calculations of these costs can be made at the point of connection to a load or to the electricity grid, so that they may or may not include the transmission costs.
For comparing different methods, it is useful to compare costs per unit of energy which is typically given per kilowatt-hour or megawatt-hour. This type of calculation assists policymakers, researchers and others to guide discussions and decision making but is usually complicated by the need to take account of differences in timing by means of a discount rate. The consensus of recent major global studies of generation costs is that wind and solar power are the lowest-cost sources of electricity available today.
Per-unit cost metrics[]
Levelized cost of electricity[]
The levelized cost of energy (LCOE) is a measure of a power source that allows comparison of different methods of electricity generation on a consistent basis. The LCOE can also be regarded as the minimum constant price at which electricity must be sold in order to break even over the lifetime of the project. This can be roughly calculated as the net present value of all costs over the lifetime of the asset divided by an appropriately discounted total of the energy output from the asset over that lifetime.[3]
Typically the LCOE is calculated over the design lifetime of a plant, which is usually 20 to 40 years.[4] However, care should be taken in comparing different LCOE studies and the sources of the information as the LCOE for a given energy source is highly dependent on the assumptions, financing terms and technological deployment analyzed.[5] In particular, assumption of capacity factor has significant impact on the calculation of LCOE. Thus, a key requirement for the analysis is a clear statement of the applicability of the analysis based on justified assumptions.[5]
Avoided cost[]
In 2014, the US Energy Information Administration recommended[6] that levelized costs of non-dispatchable sources such as wind or solar be compared to the "levelized avoided cost of energy" (LACE) rather than to the LCOE of dispatchable sources such as fossil fuels or geothermal. LACE is the avoided costs from other sources divided by the annual yearly output of the non-dispatchable source. The EIA hypothesized that fluctuating power sources might not avoid capital and maintenance costs of backup dispatchable sources. The ratio of LACE to LCOE is referred to as the value-cost ratio. When LACE (value) is greater than LCoE (cost), then value-cost ratio is greater than 1, and the project is considered economically feasible.[7]
Cost factors[]
While calculating costs, several internal cost factors have to be considered.[8] Note the use of "costs," which is not the actual selling price, since this can be affected by a variety of factors such as subsidies and taxes:
- Capital costs (including waste disposal and decommissioning costs for nuclear energy) – tend to be low for gas and oil power stations; moderate for onshore wind turbines and solar PV (photovoltaics); higher for coal plants and higher still for waste to energy, wave and tidal, solar thermal, offshore wind and nuclear.
- Fuel costs – high for fossil fuel and biomass sources, low for nuclear, and zero for many renewables. Fuel costs can vary somewhat unpredictably over the life of the generating equipment, due to political and other factors.
- Factors such as the costs of waste (and associated issues) and different insurance costs are not included in the following: Works power, own use or parasitic load – that is, the portion of generated power actually used to run the station's pumps and fans has to be allowed for.
To evaluate the total cost of production of electricity, the streams of costs are converted to a net present value using the time value of money. These costs are all brought together using discounted cash flow.[9][10]
Capital costs[]
For power generation capacity capital costs are often expressed as overnight cost per watt. Estimated costs are:
- gas/oil combined cycle power plant - $1000/kW (2019)[11]
- combustion turbine - $710/kW (2020)[11]
- onshore wind - $1600/kW (2019)[11]
- offshore wind - $6500/kW (2019)[11]
- solar PV (fixed) - $1060/kW (utility),[12] $1800/kW (2019)[11]
- solar PV (tracking)- $1130/kW (utility)[12] $2000/kW (2019)[11]
- battery storage power - $1380/kW (2020)[11]
- conventional hydropower - $2752/kW (2020)[11]
- geothermal - $2800/kW (2019)[11]
- coal (with SO2 and NOx controls)- $3500–3800/kW[13]
- advanced nuclear - $6000/kW (2019)[11]
- fuel cells - $7200/kW (2019)[11]
Running costs[]
Running costs include the cost of any fuel, maintenance costs, repair costs, wages, handling any wastes etc.
Fuel costs can be given per kWh and tend to be highest for oil fired generation, with coal being second and gas being cheaper. Nuclear fuel is much cheaper per kWh.
Market Matching Costs[]
Many scholars, such as Paul Joskow, have described limits to the "levelized cost of electricity" metric for comparing new generating sources. In particular, LCOE ignores time effects associated with matching production to demand. This happens at two levels:
- Dispatchability, the ability of a generating system to come online, go offline, or ramp up or down, quickly as demand swings.
- The extent to which the availability profile matches or conflicts with the market demand profile.
Thermally lethargic technologies like coal and solid-fuel nuclear are physically incapable of fast ramping. However, many designs of Generation 4 molten fuel nuclear reactors will be capable of fast ramping because (A) the neutron poison xenon-135 can be removed from the reactor while it runs leaving no need to compensate for xenon-135 concentrations [14] and (B) the large negative thermal and void coefficients of reactivity automatically reduce or increase fission output as the molten fuel heats or cools, respectively.[15] Nevertheless, capital intensive technologies such as wind, solar, and nuclear are economically disadvantaged unless generating at maximum availability since the LCOE is nearly all sunk-cost capital investment. Grids with very large amounts of intermittent power sources, such as wind and solar, may incur extra costs associated with needing to have storage or backup generation available.[16] At the same time, intermittent sources can be even more competitive if they are available to produce when demand and prices are highest, such as solar during summertime mid-day peaks seen in hot countries where air conditioning is a major consumer.[5] Despite these time limitations, leveling costs is often a necessary prerequisite for making comparisons on an equal footing before demand profiles are considered, and the levelized-cost metric is widely used for comparing technologies at the margin, where grid implications of new generation can be neglected.
Another limitation of the LCOE metric is the influence of energy efficiency and conservation (EEC).[17] EEC has caused the electricity demand of many countries[which?] to remain flat or decline. Considering only the LCOE for utility scale plants will tend to maximise generation and risks overestimating required generation due to efficiency, thus "lowballing" their LCOE. For solar systems installed at the point of end use, it is more economical to invest in EEC first, then solar. This results in a smaller required solar system than what would be needed without the EEC measures. However, designing a solar system on the basis of LCOE would cause the smaller system LCOE to increase, as the energy generation drops faster than the system cost. The whole of system life cycle cost should be considered, not just the LCOE of the energy source.[17] LCOE is not as relevant to end-users than other financial considerations such as income, cashflow, mortgage, leases, rent, and electricity bills.[17] Comparing solar investments in relation to these can make it easier for end-users to make a decision, or using cost-benefit calculations "and/or an asset’s capacity value or contribution to peak on a system or circuit level".[17]
External costs of energy sources[]
Typically pricing of electricity from various energy sources may not include all external costs – that is, the costs indirectly borne by society as a whole as a consequence of using that energy source.[18] These may include enabling costs, environmental impacts, usage lifespans, energy storage, recycling costs, or beyond-insurance accident effects.
The US Energy Information Administration predicts that coal and gas are set to be continually used to deliver the majority of the world's electricity.[19] This is expected to result in the evacuation of millions of homes in low-lying areas, and an annual cost of hundreds of billions of dollars' worth of property damage.[20][21][22][23][24][25][26]
According to a 2021 Harvard Business Review study costs of recycling solar panels will reach $20-30 per panel in 2035 which would increase the LCOE fourfold for PV solar power, which presents a significant policy challenge because if the recycling is made legal duty of the manufacturers it will dramatically reduce profit margins on this already competitive market, and if it's not then massive amounts of panels containing toxic heavy metals may end up in landfills unprocessed.[27] According to IRENA 2016 study the amount of PV-related waste is estimated to grow by 78 million tons by 2050.[28]
An EU funded research study known as ExternE, or Externalities of Energy, undertaken over the period of 1995 to 2005 found that the cost of producing electricity from coal or oil would double over its present value, and the cost of electricity production from gas would increase by 30% if external costs such as damage to the environment and to human health, from the particulate matter, nitrogen oxides, chromium VI, river water alkalinity, mercury poisoning and arsenic emissions produced by these sources, were taken into account. It was estimated in the study that these external, downstream, fossil fuel costs amount up to 1%–2% of the EU's entire Gross Domestic Product (GDP), and this was before the external cost of global warming from these sources was even included.[29][30] Coal has the highest external cost in the EU, and global warming is the largest part of that cost.[18]
A means to address a part of the external costs of fossil fuel generation is carbon pricing — the method most favored by economists for reducing global-warming emissions.[31] Carbon pricing charges those who emit carbon dioxide for their emissions. That charge, called a "carbon price", is the amount that must be paid for the right to emit one tonne of carbon dioxide into the atmosphere.[32] Carbon pricing usually takes the form of a carbon tax or a requirement to purchase permits to emit (also called "allowances").
Depending on the assumptions of possible accidents and their probabilities external costs for nuclear power vary significantly and can reach between 0.2 and 200 ct/kWh.[33] Furthermore, nuclear power is working under an insurance framework that limits or structures accident liabilities in accordance with the Paris convention on nuclear third-party liability, the Brussels supplementary convention, and the Vienna convention on civil liability for nuclear damage[34] and in the U.S. the Price-Anderson Act. It is often argued that this potential shortfall in liability represents an external cost not included in the cost of nuclear electricity; but the cost is small, amounting to about 0.1% of the levelized cost of electricity, according to a CBO study.[35]
These beyond-insurance costs for worst-case scenarios are not unique to nuclear power, as hydroelectric power plants are similarly not fully insured against catastrophic events like a large dam failure. For example, the 1975 Banqiao Dam disaster took the homes of 11 million people and killed between 26,000[36] and 230,000.[37] As private insurers base dam insurance premiums on limited scenarios, major disaster insurance in this sector is likewise provided by the state.[38]
Because externalities are diffuse in their effect, external costs can not be measured directly, but must be estimated. One approach estimate external costs of environmental impact of electricity is the Methodological Convention of Federal Environment Agency of Germany. That method arrives at external costs of electricity from lignite at 10.75 Eurocent/kWh, from hard coal 8.94 Eurocent/kWh, from natural gas 4.91 Eurocent/kWh, from photovoltaic 1.18 Eurocent/kWh, from wind 0.26 Eurocent/kWh and from hydro 0.18 Eurocent/kWh.[39] For nuclear the Federal Environment Agency indicates no value, as different studies have results that vary by a factor of 1,000. It recommends the nuclear given the huge uncertainty, with the cost of the next inferior energy source to evaluate.[40] Based on this recommendation the Federal Environment Agency, and with their own method, the Forum Ecological-social market economy, arrive at external environmental costs of nuclear energy at 10.7 to 34 ct/kWh.[41]
Additional cost factors[]
Calculations often do not include wider system costs associated with each type of plant, such as long-distance transmission connections to grids, or balancing and reserve costs. Calculations do not include externalities such as health damage by coal plants, nor the effect of CO2 emissions on the climate change, ocean acidification and eutrophication, ocean current shifts. Decommissioning costs of power plants are usually not included (nuclear power plants in the United States is an exception, because the cost of decommissioning is included in the price of electricity per the Nuclear Waste Policy Act), is therefore not full cost accounting. These types of items can be explicitly added as necessary depending on the purpose of the calculation. It has little relation to actual price of power, but assists policy makers and others to guide discussions and decision making.[citation needed]
These are not minor factors but very significantly affect all responsible power decisions:
- Comparisons of life-cycle greenhouse gas emissions show coal, for instance, to be radically higher in terms of GHGs than any alternative. Accordingly, in the analysis below, carbon captured coal is generally treated as a separate source rather than being averaged in with other coal.
- Surface power density which determines amount of land surface required per unit of energy generated using given technology, and can order by two orders of magnitude between high- and low-density sources. Surface power density is a significant limiting factor countries with high population density.
- Other environmental concerns with electricity generation include acid rain, ocean acidification and effect of coal extraction on watersheds.
- Various human health concerns with electricity generation, including asthma and smog, now dominate decisions in developed nations that incur health care costs publicly. A Harvard University Medical School study estimates the US health costs of coal alone at between 300 and 500 billion US dollars annually.[42]
- While cost per kWh of transmission varies drastically with distance, the long complex projects required to clear or even upgrade transmission routes make even attractive new supplies often uncompetitive with conservation measures (see below), because the timing of payoff must take the transmission upgrade into account.
Global studies[]
| Source | Solar utility scale |
Solar rooftop |
Wind onshore |
Wind offshore |
Geothermal | Nuclear new |
Nuclear extension |
Hydro | Geothermal | Coal | Gas CC | Gas peaker | Storage (1:4) |
|---|---|---|---|---|---|---|---|---|---|---|---|---|---|
| NEA 2020[43] (at 7% discount rate) | 56 | 126 | 50 | 88 | 100 | 68 | 32 | 72 | 99 | 88 | 71 | - | - |
| NEA 2018[44] (at 3% discount rate) | 100 | 160 | 60 | 135 | - | 55 | - | - | - | 90 | 100 | - | - |
| IPCC 2018[45] (at 5% discount rate) | 110 | 150 | 59 | 120 | 60 | 65 | - | 22 | 60 | 61 | 71 | - | - |
| BNEF 2021[46] | 39 | - | 41 | 79 | - | - | - | - | - | - | - | - | 132 |
| Lazard 2020[47] | 36 | 125 | 40 | 86 | 80 | 164 | 29 | - | 80 | 112 | 59 | 175 | 189 |
| IRENA 2020[48] | 68 | 164 | 53 | 113 | 73 | - | - | 47 | 73 | - | - | - |
BNEF (2021)[]
In March 2021, Bloomberg New Energy Finance found that "renewables are the cheapest power option for 71% of global GDP and 85% of global power generation. It is now cheaper to build a new solar or wind farm to meet rising electricity demand or replace a retiring generator, than it is to build a new fossil fuel-fired power plant. ... On a cost basis, wind and solar is the best economic choice in markets where firm generation resources exist and demand is growing." They further reported "the levelized cost of energy from lithium-ion battery storage systems is competitive with many peak-demand generators." BNEF did not disclose the detailed methodology and LCOE calculation assumptions, apart from declaring it was "derived from selected public sources".[46]
IEA & OECD NEA (2020)[]
In December 2020 IEA and OECD NEA published a joint Projected Costs of Generating Electricity study which looks at a very broad range of electricity generating technologies based on 243 power plants in 24 countries. The primary finding was that "low-carbon generation is overall becoming increasingly cost competitive" and "new nuclear power will remain the dispatchable low-carbon technology with the lowest expected costs in 2025". The report calculated LCOE with assumed 7% discount rate and adjusted for systemic costs of generation.[43] The report also contains a modeling utility that produces LCOE estimates based on user-selected parameters such as discount rate, carbon price, heat price, coal price and gas price.[49] The report's main conclusions:[50]
- LCOE of specific energy sources significantly differs between countries due to their geographic, political and regulatory situation;
- low-carbon energy sources cannot be considered in separation, as they operate in "complex interactions" with each other to ensure reliable supply at all times; IEA analysis captures these interactions in value-adjusted LCOE or VALCOE;
- cost of renewable energy sources significantly decreased and are competitive (in LCOE terms) with dispatchable fossil fuel generation;
- cost of extension of operations of existing nuclear power plants (LTO, long-term operations) has the lowest LCOE of low-carbon energy sources;
Lazard (2020)[]
In October 2020, the investment bank Lazard compared renewable and conventional sources of energy, including comparison between existing and new generation (see table). Lazard study assumes "60% debt at 8% interest rate and 40% equity at 12% cost" for its LCOE calculation.[47]
IRENA (2020)[]
The International Renewable Energy Agency (IRENA) released a study of 2019 renewable power generation costs based states that "new solar and wind projects are undercutting the cheapest of existing coal-fired plants". No data for non-renewable sources is presented in the report. IRENA study assumes 7.5% cost of capital in OECD countries and 10% in China for the LCOE calculations.[48]
IPCC (2018)[]
IPCC Fifth Assessment Report contains LCOE calculations[45] for broad range of energy sources in the following four scenarios:
- 10% WACC, high full load hours (FLH), no carbon tax
- 5% WACC, high FLH, no carbon tax — scenario presented in the above table
- 10% WACC, low FLH, no carbon tax
- 10% WACC, high FLH, $100/tCO2eq carbon tax
OECD (2018)[]
OECD NEA[44] contains LCOE calculations for three discount rates — 3%, 7% and 10%. The 3% scenario is presented above.
Regional studies[]
Australia[]
BNEF[51] estimated the following costs for electricity generation in Australia:[52]
| Source | Solar | Wind onshore | Gas CC | Wind plus storage | Solar plus storage | Storage (4hr) | Gas peaker |
|---|---|---|---|---|---|---|---|
| Mean $US/MWh | 47 | 58 | 81 | 87 | 118 | 156 | 228 |
France[]
This section needs to be updated. (July 2015) |
The International Energy Agency and EDF have estimated for 2011 the following costs.[citation needed] For nuclear power, they include the costs due to new safety investments to upgrade the French nuclear plant after the Fukushima Daiichi nuclear disaster; the cost for those investments is estimated at 4 €/MWh. Concerning solar power, the estimate of 293 €/MWh is for a large plant capable of producing in the range of 50–100 GWh/year located in a favorable location (such as in Southern Europe). For a small household plant that can produce around 3 MWh/year, the cost is between 400 and 700 €/MWh, depending on location. Solar power was by far the most expensive renewable source of electricity among the technologies studied, although increasing efficiency and longer lifespan of photovoltaic panels together with reduced production costs have made this source of energy more competitive since 2011. By 2017, the cost of photovoltaic solar power had decreased to less than 50 €/MWh.
| Technology | Cost in 2011 | Cost in 2017 |
|---|---|---|
| Hydro power | 20 | |
| Nuclear (with state-covered insurance costs) | 50 | 50 |
| Nuclear EPR | 100[53] | |
| Natural gas turbines without CO2 capture | 61 | |
| Onshore wind | 69 | 60[53] |
| Solar farms | 293 | 43.24[54] |
Germany[]

In November 2013, the Fraunhofer Institute for Solar Energy Systems ISE assessed the levelised generation costs for newly built power plants in the German electricity sector.[56] PV systems reached LCOE between 0.078 and 0.142 Euro/kWh in the third quarter of 2013, depending on the type of power plant (ground-mounted utility-scale or small rooftop solar PV) and average German insolation of 1000 to 1200 kWh/m2 per year (GHI). There are no LCOE-figures available for electricity generated by recently built German nuclear power plants as none have been constructed since the late 1980s. An update of the ISE study was published in March 2018.[55]
| ISE (2013) | ISE (2018) | ||||||
|---|---|---|---|---|---|---|---|
| Technology | Low cost | High cost | Low cost | High cost | |||
| Coal-fired power plants | brown coal | 38 | 53 | 46 | 80 | ||
| hard coal | 63 | 80 | 63 | 99 | |||
| CCGT power plants | 75 | 98 | 78 | 100 | |||
| Wind power | Onshore wind farms | 45 | 107 | 40 | 82 | ||
| Offshore wind farms | 119 | 194 | 75 | 138 | |||
| Solar | PV systems | 78 | 142 | 37 | 115 | ||
| Biogas power plant | 135 | 250 | 101 | 147 | |||
| Source: Fraunhofer ISE (2013) – Levelized cost of electricity renewable energy technologies[56] Source: Fraunhofer ISE (2018) – Stromgestehungskosten erneuerbare Energien[55] | |||||||
Middle East[]
The capital investment costs, fixed and variable costs, and the average capacity factor of utility-scale wind and photovoltaic electricity supplies from 2000 to 2018 have been obtained using overall variable renewable electricity production of the countries in the Middle East and 81 examined projects.
| Year | Wind CF | Photovoltaic CF | Wind LCOE ($/MWh) | Photovoltaic LCOE($/MWh) |
|---|---|---|---|---|
| 2000 | 0.19 | 0.17 | - | - |
| 2001 | - | 0.17 | - | - |
| 2002 | 0.21 | 0.21 | - | - |
| 2003 | - | 0.17 | - | - |
| 2004 | 0.23 | 0.16 | - | - |
| 2005 | 0.23 | 0.19 | - | - |
| 2006 | 0.20 | 0.15 | - | - |
| 2007 | 0.17 | 0.21 | - | - |
| 2008 | 0.25 | 0.19 | - | - |
| 2009 | 0.18 | 0.16 | - | - |
| 2010 | 0.26 | 0.20 | 107.8 | - |
| 2011 | 0.31 | 0.17 | 76.2 | - |
| 2012 | 0.29 | 0.17 | 72.7 | - |
| 2013 | 0.28 | 0.20 | 72.5 | 212.7 |
| 2014 | 0.29 | 0.20 | 66.3 | 190.5 |
| 2015 | 0.29 | 0.19 | 55.4 | 147.2 |
| 2016 | 0.34 | 0.20 | 52.2 | 110.7 |
| 2017 | 0.34 | 0.21 | 51.5 | 94.2 |
| 2018 | 0.37 | 0.23 | 42.5 | 85.8 |
| 2019 | - | 0.23 | - | 50.1 |
Turkey[]
As of March 2021 for projects starting generating electricity in Turkey from renewable energy in Turkey in July feed-in-tariffs in lira per kWh are: wind and solar 0.32, hydro 0.4, geothermal 0.54, and various rates for different types of biomass: for all these there is also a bonus of 0.08 per kWh if local components are used.[58] Tariffs will apply for 10 years and the local bonus for 5 years.[58] Rates are determined by the presidency,[59] and the scheme replaces the previous USD-denominated feed-in-tariffs for renewable energy.[60]
Japan[]
This section needs to be updated. (July 2016) |
A 2010 study by the Japanese government (pre-Fukushima disaster), called the Energy White Paper,[61] concluded the cost for kilowatt hour was ¥49 for solar, ¥10 to ¥14 for wind, and ¥5 or ¥6 for nuclear power.
Masayoshi Son, an advocate for renewable energy, however, has pointed out that the government estimates for nuclear power did not include the costs for reprocessing the fuel or disaster insurance liability. Son estimated that if these costs were included, the cost of nuclear power was about the same as wind power.[62][63][64]
More recently, the cost of solar in Japan has decreased to between ¥13.1/kWh to ¥21.3/kWh (on average, ¥15.3/kWh, or $0.142/kWh).[65]
United Kingdom[]
This section needs to be updated. (September 2021) |
The Institution of Engineers and Shipbuilders in Scotland commissioned a former Director of Operations of the British National Grid, Colin Gibson, to produce a report on generation levelised costs that for the first time would include some of the transmission costs as well as the generation costs. This was published in December 2011.[66] The institution seeks to encourage debate of the issue, and has taken the unusual step among compilers of such studies of publishing a spreadsheet.[67]
On 27 February 2015 Vattenfall Vindkraft AS agreed to build the Horns Rev 3 offshore wind farm at a price of 10.31 Eurocent per kWh. This has been quoted as below £100 per MWh.
In 2013 in the United Kingdom for a new-to-build nuclear power plant (Hinkley Point C: completion 2023), a feed-in tariff of £92.50/MWh (around US$142/MWh) plus compensation for inflation with a running time of 35 years was agreed.[68][69]
The Department for Business, Energy and Industrial Strategy (BEIS) publishes regular estimates of the costs of different electricity generation sources, following on the estimates of the merged Department of Energy and Climate Change (DECC). Levelized cost estimates for new generation projects begun in 2015 are listed in the table below.[70]
| Power generating technology | Low | Central | High | |
|---|---|---|---|---|
| Wind | Onshore | 47 | 62 | 76 |
| Offshore | 90 | 102 | 115 | |
| Solar Large-scale PV (Photovoltaic) | 71 | 80 | 94 | |
| Nuclear PWR (Pressurized Water Reactor)(a) | 82 | 93 | 121 | |
| Biomass | 85 | 87 | 88 | |
| Natural Gas | Combined Cycle Gas Turbine | 65 | 66 | 68 |
| CCGT with CCS (Carbon capture and storage) | 102 | 110 | 123 | |
| Open-Cycle Gas Turbine | 157 | 162 | 170 | |
| Coal | Advanced Supercritical Coal with Oxy-comb. CCS | 124 | 134 | 153 |
| IGCC (Integrated Gasification Combined Cycle) with CCS | 137 | 148 | 171 | |
| (a) new nuclear power: guaranteed strike price of £92.50/MWh for Hinkley Point C in 2023[71][72] | ||||
United States[]
This section may contain an excessive amount of intricate detail that may interest only a particular audience. (September 2021) |
Energy Information Administration (2020)[]

Since 2010, the US Energy Information Administration (EIA) has published the Annual Energy Outlook (AEO), with yearly LCOE projections for future utility-scale facilities to be commissioned in about five years' time. In 2015, EIA has been criticized by the Advanced Energy Economy (AEE) Institute after its release of the AEO 2015-report to "consistently underestimate the growth rate of renewable energy, leading to 'misperceptions' about the performance of these resources in the marketplace". AEE points out that the average power purchase agreement (PPA) for wind power was already at $24/MWh in 2013. Likewise, PPA for utility-scale solar PV are seen at current levels of $50–$75/MWh.[73] These figures contrast strongly with EIA's estimated LCOE of $125/MWh (or $114/MWh including subsidies) for solar PV in 2020.[74]
The following data are from the Energy Information Administration's (EIA) Annual Energy Outlook released in 2020 (AEO2020). They are in dollars per megawatt-hour (2019 USD/MWh). These figures are estimates for plants going into service in 2025, exclusive of tax credits, subsidies, or other incentives.[75] The LCOE below is calculated based on a 30-year recovery period using a real after tax weighted average cost of capital (WACC) of 6.1%. For carbon intensive technologies 3 percentage points are added to the WACC. (This is approximately equivalent to a fee of $15 per metric ton of carbon dioxide CO2.) Federal tax credits and various state and local incentive programs would be expected to reduce some of these LCOE values. For example, EIA expects the federal investment tax credit program to reduce the capacity weighted average LCOE of solar PV built in 2025 by an additional $2.41, to $30.39.
| Plant Type | Min | Simple
Average |
Capacity weighted average |
Max |
|---|---|---|---|---|
| Ultra-supercritical coal | 65.10 | 76.44 | NB | 91.27 |
| Combined cycle | 33.35 | 38.07 | 36.61 | 45.31 |
| Combustion Turbine | 58.48 | 66.62 | 68.71 | 81.37 |
| Advanced Nuclear | 71.90 | 81.65 | NB | 92.04 |
| Geothermal | 35.13 | 37.47 | 37.47 | 39.60 |
| Biomass | 86.19 | 94.83 | NB | 139.96 |
| Wind, onshore | 28.72 | 39.95 | 34.10 | 62.72 |
| Wind, offshore | 102.68 | 122.25 | 115.04 | 155.55 |
| Solar photovoltaic (PV) | 29.75 | 35.74 | 32.80 | 48.09 |
| Hydroelectric | 35.37 | 52.79 | 39.54 | 63.24 |
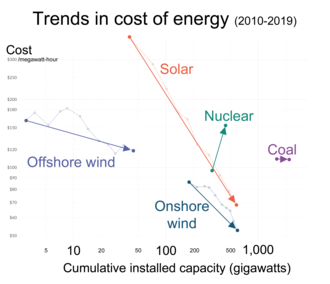
The electricity sources which had the most decrease in estimated costs over the period 2010 to 2019 were solar photovoltaic (down 88%), onshore wind (down 71%) and advanced natural gas combined cycle (down 49%).
For utility-scale generation put into service in 2040, the EIA estimated in 2015 that there would be further reductions in the constant-dollar cost of concentrated solar power (CSP) (down 18%), solar photovoltaic (down 15%), offshore wind (down 11%), and advanced nuclear (down 7%). The cost of onshore wind was expected to rise slightly (up 2%) by 2040, while natural gas combined cycle electricity was expected to increase 9% to 10% over the period.[74]
| Estimate in $/MWh | Coal convent'l |
Nat. gas combined cycle | Nuclear advanced |
Wind | Solar | |||||
|---|---|---|---|---|---|---|---|---|---|---|
| of year | ref | for year | convent'l | advanced | onshore | offshore | PV | CSP | ||
| 2010 | [76] | 2016 | 100.4 | 83.1 | 79.3 | 119.0 | 149.3 | 191.1 | 396.1 | 256.6 |
| 2011 | [77] | 2016 | 95.1 | 65.1 | 62.2 | 114.0 | 96.1 | 243.7 | 211.0 | 312.2 |
| 2012 | [78] | 2017 | 97.7 | 66.1 | 63.1 | 111.4 | 96.0 | N/A | 152.4 | 242.0 |
| 2013 | [79] | 2018 | 100.1 | 67.1 | 65.6 | 108.4 | 86.6 | 221.5 | 144.3 | 261.5 |
| 2014 | [80] | 2019 | 95.6 | 66.3 | 64.4 | 96.1 | 80.3 | 204.1 | 130.0 | 243.1 |
| 2015 | [74] | 2020 | 95.1 | 75.2 | 72.6 | 95.2 | 73.6 | 196.9 | 125.3 | 239.7 |
| 2016 | [81] | 2022 | NB | 58.1 | 57.2 | 102.8 | 64.5 | 158.1 | 84.7 | 235.9 |
| 2017 | [82] | 2022 | NB | 58.6 | 53.8 | 96.2 | 55.8 | NB | 73.7 | NB |
| 2018 | [83] | 2022 | NB | 48.3 | 48.1 | 90.1 | 48.0 | 124.6 | 59.1 | NB |
| 2019 | [83] | 2023 | NB | 40.8 | 40.2 | NB | 42.8 | 117.9 | 48.8 | NB |
| 2020 | [84] | 2025 | NB | 36.61 | 36.61 | NB | 34.10 | 115.04 | 32.80 | NA |
| Nominal change 2010–2020 | NB | −56% | −54% | NB | −77% | -40% | −92% | NB | ||
| Note: Projected LCOE are adjusted for inflation and calculated on constant dollars based on two years prior to the release year of the estimate. Estimates given without any subsidies. Transmission cost for non-dispatchable sources are on average much higher. NB = "Not built" (No capacity additions are expected.) | ||||||||||
NREL OpenEI (2015)[]
OpenEI, sponsored jointly by the US DOE and the National Renewable Energy Laboratory (NREL), has compiled a historical cost-of-generation database[85] covering a wide variety of generation sources. Because the data is open source it may be subject to frequent revision.
| Plant type (USD/MWh) | Min | Median | Max | Data source year | |
|---|---|---|---|---|---|
| Distributed generation | 10 | 70 | 130 | 2014 | |
| Hydropower | Conventional | 30 | 70 | 100 | 2011 |
| Small Hydropower | 140 | 2011 | |||
| Wind | Onshore (land based) | 40 | 80 | 2014 | |
| Offshore | 100 | 200 | 2014 | ||
| Natural gas | Combined cycle | 50 | 80 | 2014 | |
| Combustion turbine | 140 | 200 | 2014 | ||
| Coal | Pulverized, scrubbed | 60 | 150 | 2014 | |
| Pulverized, unscrubbed | 40 | 2008 | |||
| IGCC, gasified | 100 | 170 | 2014 | ||
| Solar | Photovoltaic | 60 | 110 | 250 | 2014 |
| CSP | 100 | 220 | 2014 | ||
| Geothermal | Hydrothermal | 50 | 100 | 2011 | |
| Blind | 100 | 2011 | |||
| Enhanced | 80 | 130 | 2014 | ||
| Biopower | 90 | 110 | 2014 | ||
| Fuel cell | 100 | 160 | 2014 | ||
| Nuclear | 90 | 130 | 2014 | ||
| Ocean | 230 | 240 | 250 | 2011 | |
Note:
Only median value = only one data point.
Only max + min value = only two data points
California Energy Commission (2014)[]
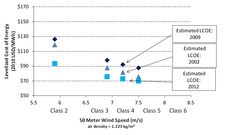
LCOE data from the California Energy Commission report titled "Estimated Cost of New Renewable and Fossil Generation in California".[86] The model data was calculated for all three classes of developers: merchant, investor-owned utility (IOU), and publicly owned utility (POU).
| Type | Year 2013 (nominal $$) ($/MWh) | Year 2024 (nominal $$) ($/MWh) | ||||
|---|---|---|---|---|---|---|
| Name | Merchant | IOU | POU | Merchant | IOU | POU |
| Generation turbine 49.9 MW | 662.81 | 2215.54 | 311.27 | 884.24 | 2895.90 | 428.20 |
| Generation turbine 100 MW | 660.52 | 2202.75 | 309.78 | 881.62 | 2880.53 | 426.48 |
| Generation turbine – Advanced 200 MW | 403.83 | 1266.91 | 215.53 | 533.17 | 1615.68 | 299.06 |
| Combined-cycle 2CTs no duct firing 500 MW | 116.51 | 104.54 | 102.32 | 167.46 | 151.88 | 150.07 |
| Combined-cycle 2CTs with duct firing 500 MW | 115.81 | 104.05 | 102.04 | 166.97 | 151.54 | 149.88 |
| Biomass fluidized bed boiler 50 MW | 122.04 | 141.53 | 123.51 | 153.89 | 178.06 | 156.23 |
| Geothermal binary 30 MW | 90.63 | 120.21 | 84.98 | 109.68 | 145.31 | 103.00 |
| Geothermal flash 30 MW | 112.48 | 146.72 | 109.47 | 144.03 | 185.85 | 142.43 |
| Solar parabolic trough without storage 250 MW | 168.18 | 228.73 | 167.93 | 156.10 | 209.72 | 156.69 |
| Solar parabolic trough with storage 250 MW | 127.40 | 189.12 | 134.81 | 116.90 | 171.34 | 123.92 |
| Solar power tower without storage 100 MW | 152.58 | 210.04 | 151.53 | 133.63 | 184.24 | 132.69 |
| Solar power tower with storage 100 MW 6HR | 145.52 | 217.79 | 153.81 | 132.78 | 196.47 | 140.58 |
| Solar power tower with storage 100 MW 11HR | 114.06 | 171.72 | 120.45 | 103.56 | 154.26 | 109.55 |
| Solar photovoltaic (thin-film) 100 MW | 111.07 | 170.00 | 121.30 | 81.07 | 119.10 | 88.91 |
| Solar photovoltaic (single-axis) 100 MW | 109.00 | 165.22 | 116.57 | 98.49 | 146.20 | 105.56 |
| Solar photovoltaic (thin-film) 20 MW | 121.31 | 186.51 | 132.42 | 93.11 | 138.54 | 101.99 |
| Solar photovoltaic (single-axis) 20 MW | 117.74 | 179.16 | 125.86 | 108.81 | 162.68 | 116.56 |
| Wind class 3 100 MW | 85.12 | 104.74 | 75.8 | 75.01 | 91.90 | 68.17 |
| Wind class 4 100 MW | 84.31 | 103.99 | 75.29 | 75.77 | 92.88 | 68.83 |
California Energy Commission (2019)[]
On 9 May 2019 the California Energy Commission released an updated LCOE report: [87] [88]
| Tech Type | Method type to Calculate LCOE | Min (2018 $/Mwh) | Median | Max (2018 $/Mwh) |
|---|---|---|---|---|
| Solar PV Single Axis 100MW | Deterministic | 33 | 49 | 106 |
| Solar PV Single Axis 100MW | Probabilistic | 44 | 52 | 61 |
| Solar Tower with Storage | Deterministic | 81 | 159 | 339 |
| Solar Tower with Storage | Probabilistic | 128 | 158 | 195 |
| Wind 80m hub Hight | Deterministic | 30 | 57 | 136 |
| Wind 80m hub Hight | Probabilistic | 52 | 65 | 81 |
| Geothermal Flash | Deterministic | 54 | 138 | 414 |
| Geothermal Flash | Probabilistic | 116 | 161 | 217 |
| Biomas | Deterministic | 98 | 166 | 268 |
| Biomas | Probabilistic | 158 | 172 | 187 |
| Combined Cycle no duct firing | Deterministic | 77 | 119 | 187 |
| Combined Cycle no duct firing | Probabilistic | 111 | 123 | 141 |
Lazard (2015)[]
In November 2015, the investment bank Lazard headquartered in New York, published its ninth annual study on the current electricity production costs of photovoltaics in the US compared to conventional power generators. The best large-scale photovoltaic power plants can produce electricity at US$50 per MWh. The upper limit at US$60 per MWh. In comparison, coal-fired plants are between US$65 and $150 per MWh, nuclear power at US$97 per MWh. Small photovoltaic power plants on roofs of houses are still at 184–300 USD per MWh, but which can do without electricity transport costs. Onshore wind turbines are 32–77 USD per MWh. One drawback is the intermittency of solar and wind power. The study suggests a solution in batteries as a storage, but these are still expensive so far.[89][90]
Lazard's long standing Levelized Cost of Energy (LCOE) report is widely considered and industry benchmark. In 2015 Lazard published its inaugural Levelized Cost of Storage (LCOS) report, which was developed by the investment bank Lazard in collaboration with the energy consulting firm, Enovation.[91]
Below is the complete list of LCOEs by source from the investment bank Lazard.[89]
| Plant type (USD/MWh) | Low | High |
|---|---|---|
| Energy efficiency | 0 | 50 |
| Wind | 32 | 77 |
| Solar PV – thin-film utility-scale | 50 | 60 |
| Solar PV – crystalline utility-scale | 58 | 70 |
| Solar PV – rooftop residential | 184 | 300 |
| Solar PV – rooftop C&I | 109 | 193 |
| Solar thermal with storage | 119 | 181 |
| Microturbine | 79 | 89 |
| Geothermal | 82 | 117 |
| Biomass direct | 82 | 110 |
| Fuel cell | 106 | 167 |
| Natural gas reciprocating engine | 68 | 101 |
| Gas combined cycle | 52 | 78 |
| Gas peaking | 165 | 218 |
| IGCC | 96 | 183 |
| Nuclear | 97 | 136 |
| Coal | 65 | 150 |
| Battery storage | ** | ** |
| Diesel reciprocating engine | 212 | 281 |
NOTE: ** Battery storage is no longer included in this report (2015). It has been rolled into its own separate report LCOS 1.0, developed in consultation with Enovation Partners (see charts below).
Below are the LCOSs for different battery technologies. This category has traditionally been filled by diesel engines. These are "behind the meter" applications.[92]
| Purpose | Type | Low ($/MWh) | High ($/MWh) |
|---|---|---|---|
| MicroGrid | Flow battery | 429 | 1046 |
| MicroGrid | Lead-acid | 433 | 946 |
| MicroGrid | Lithium-ion | 369 | 562 |
| MicroGrid | Sodium | 411 | 835 |
| MicroGrid | Zinc | 319 | 416 |
| Island | Flow battery | 593 | 1231 |
| Island | Lead-acid | 700 | 1533 |
| Island | Lithium-ion | 581 | 870 |
| Island | Sodium | 663 | 1259 |
| Island | Zinc | 523 | 677 |
| Commercial and industrial | Flow battery | 349 | 1083 |
| Commercial and industrial | Lead-acid | 529 | 1511 |
| Commercial and industrial | Lithium-ion | 351 | 838 |
| Commercial and industrial | Sodium | 444 | 1092 |
| Commercial and industrial | Zinc | 310 | 452 |
| Commercial appliance | Flow battery | 974 | 1504 |
| Commercial appliance | Lead-acid | 928 | 2291 |
| Commercial appliance | Lithium-Ion | 784 | 1363 |
| Commercial appliance | Zinc | 661 | 833 |
| Residential | Flow battery | 721 | 1657 |
| Residential | Lead-acid | 1101 | 2238 |
| Residential | Lithium-ion | 1034 | 1596 |
| All of the above
Traditional method |
Diesel reciprocating engine | 212 | 281 |
Below are the LCOSs for different battery technologies. This category has traditionally been filled by natural-gas engines. These are "in front of the meter" applications.[92]
| Purpose | Type | Low ($/MWh) | High ($/MWh) |
|---|---|---|---|
| Transmission system | Compressed air | 192 | 192 |
| Transmission system | Flow battery | 290 | 892 |
| Transmission system | Lead-acid | 461 | 1429 |
| Transmission system | Lithium-ion | 347 | 739 |
| Transmission system | Pumped hydro | 188 | 274 |
| Transmission system | Sodium | 396 | 1079 |
| Transmission system | Zinc | 230 | 376 |
| Peaker replacement | Flow battery | 248 | 927 |
| Peaker replacement | Lead-acid | 419 | 1247 |
| Peaker replacement | Lithium-ion | 321 | 658 |
| Peaker replacement | Sodium | 365 | 948 |
| Peaker replacement | Zinc | 221 | 347 |
| Frequency regulation | Flywheel | 276 | 989 |
| Frequency regulation | Lithium-ion | 211 | 275 |
| Distribution services | Flow battery | 288 | 923 |
| Distribution services | Lead-acid | 516 | 1692 |
| Distribution services | Lithium-ion | 400 | 789 |
| Distribution services | Sodium | 426 | 1129 |
| Distribution services | Zinc | 285 | 426 |
| PV integration | Flow battery | 373 | 950 |
| PV integration | Lead-acid | 402 | 1068 |
| PV integration | Lithium-ion | 355 | 686 |
| PV integration | Sodium | 379 | 957 |
| PV integration | Zinc | 245 | 345 |
| All of the above
Traditional method |
Gas peaker | 165 | 218 |
Lazard (2016)[]
On 15 December 2016 Lazard released version 10[93] of their LCOE report and version 2[94] of their LCOS report.
| Type | Low ($/MWh) | High ($/MWh) |
|---|---|---|
| Wind | 32 | 62 |
| Solar PV – crystalline utility-scale | 49 | 61 |
| Solar PV – thin-film utility-scale | 46 | 56 |
| Solar PV – community | 78 | 135 |
| Solar PV – rooftop residential | 138 | 222 |
| Solar PV – rooftop C&I | 88 | 193 |
| Solar thermal tower with storage | 119 | 182 |
| Microturbine | 76 | 89 |
| Geothermal | 79 | 117 |
| Biomass direct | 77 | 110 |
| Fuel cell | 106 | 167 |
| Natural gas reciprocating engine | 68 | 101 |
| Gas combined cycle | 48 | 78 |
| Gas peaking | 165 | 217 |
| IGCC | 94 | 210 |
| Nuclear | 97 | 136 |
| Coal | 60 | 143 |
| Diesel reciprocating engine | 212 | 281 |
Lazard (2017)[]
On 2 November 2017 the investment bank Lazard released version 11[95] of their LCOE report and version 3[96] of their LCOS report.[97]
| Generation type | Low ($/MWh) | High ($/MWh) |
|---|---|---|
| Wind | 30 | 60 |
| Solar PV – crystalline utility-scale | 46 | 53 |
| Solar PV – thin-film utility-scale | 43 | 48 |
| Solar PV – community | 76 | 150 |
| Solar PV – rooftop residential | 187 | 319 |
| Solar PV – rooftop C&I | 85 | 194 |
| Solar thermal tower with storage | 98 | 181 |
| Microturbine | 59 | 89 |
| Geothermal | 77 | 117 |
| Biomass direct | 55 | 114 |
| Fuel cell | 106 | 167 |
| Natural gas reciprocating engine | 68 | 106 |
| Gas combined cycle | 42 | 78 |
| Gas peaking | 156 | 210 |
| IGCC | 96 | 231 |
| Nuclear | 112 | 183 |
| Coal | 60 | 143 |
| Diesel reciprocating engine | 197 | 281 |
Below are the unsubsidized LCOSs for different battery technologies for "behind the meter" (BTM) applications.[96]
| Use case | Storage type | Low ($/MWh) | High ($/MWh) |
|---|---|---|---|
| Commercial | Lithium-ion | 891 | 985 |
| Commercial | Lead-acid | 1057 | 1154 |
| Commercial | Advanced lead | 950 | 1107 |
| Residential | Lithium-ion | 1028 | 1274 |
| Residential | Lead-acid | 1160 | 1239 |
| Residential | Advanced lead | 1138 | 1188 |
Below are the unsubsidized LCOSs for different battery technologies "front of the meter" (FTM) applications.[96]
| Use case | Storage type | Low ($/MWh) | High ($/MWh) |
|---|---|---|---|
| Peaker replacement | Flow battery (V) | 209 | 413 |
| Peaker replacement | Flow battery (Zn) | 286 | 315 |
| Peaker replacement | Lithium-ion | 282 | 347 |
| Distribution | Flow battery (V) | 184 | 338 |
| Distribution | Lithium-ion | 272 | 338 |
| Microgrid | Flow battery (V) | 273 | 406 |
| Microgrid | Lithium-ion | 383 | 386 |
Note: Flow battery value range estimates
Lazard (2018)[]
In November 2018 Lazard released their 2018 LCOE report[98][99]
| Tech Type | Min ($/MWh) | Max ($/MWh) |
|---|---|---|
| Solar PV—Roof top Residential | 160 | 267 |
| Solar PV—Roof top C&I | 81 | 170 |
| Solar PV—Community | 73 | 145 |
| Solar PV—Crystalline Utility Scale | 40 | 46 |
| Solar PV—Thin Film Utility Scale | 36 | 44 |
| Solar Thermal Tower with Storage | 98 | 181 |
| Fuel Cell | 103 | 152 |
| Geothermal | 71 | 111 |
| Wind – Onshore | 29 | 56 |
| Wind – Offshore *(Only midpoint) | 92 | 92 |
| Gas Peaking | 152 | 206 |
| Nuclear | 112 | 189 |
| Coal | 60 | 143 |
| Gas Combined Cycle | 41 | 74 |
Lazard (2019)[]
In November 2019 Lazard released their 2019 LCOE report[100][101]
| Tech Type | Min ($/MWh) | Max ($/MWh) |
|---|---|---|
| Solar PV—Roof top Residential | 151 | 242 |
| Solar PV—Roof top C&I | 75 | 154 |
| Solar PV—Community | 64 | 148 |
| Solar PV—Crystalline Utility Scale | 36 | 44 |
| Solar PV—Thin Film Utility Scale | 32 | 42 |
| Solar Thermal Tower with Storage | 126 | 156 |
| Geothermal | 69 | 112 |
| Wind – Onshore | 28 | 54 |
| Wind – Offshore (Only Midpoint cost) | 89 | 89 |
| Gas Peaking | 150 | 199 |
| Nuclear | 118 | 192 |
| Coal | 66 | 152 |
| Gas Combined Cycle | 44 | 68 |
Renewables[]
Photovoltaics[]
In 2020, IEA declared that solar PV power is the cheapest electricity in history.[103]
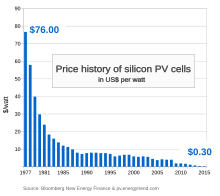
Photovoltaic prices have fallen from $76.67 per watt in 1977 to nearly $0.085 per watt in October 2020, for multi crystalline silicon solar cells and module price to $0.193 per watt.[104][105] This is seen as evidence supporting Swanson's law, which states that solar cell prices fall 20% for every doubling of cumulative shipments. The famous Moore's law calls for a doubling of transistor count every two years.
By 2011, the price of PV modules per MW had fallen by 60% since 2008, according to Bloomberg New Energy Finance estimates, putting solar power for the first time on a competitive footing with the retail price of electricity in some sunny countries; an alternative and consistent price decline figure of 75% from 2007 to 2012 has also been published,[106] though it is unclear whether these figures are specific to the United States or generally global. The levelised cost of electricity (LCOE) from PV is competitive with conventional electricity sources in an expanding list of geographic regions,[5] particularly when the time of generation is included, as electricity is worth more during the day than at night.[107] There has been fierce competition in the supply chain, and further improvements in the levelised cost of energy for solar lie ahead, posing a growing threat to the dominance of fossil fuel generation sources in the next few years.[108] As time progresses, renewable energy technologies generally get cheaper,[109][110] while fossil fuels generally get more expensive:
The less solar power costs, the more favorably it compares to conventional power, and the more attractive it becomes to utilities and energy users around the globe. Utility-scale solar power [could in 2011] be delivered in California at prices well below $100/MWh ($0.10/kWh) less than most other peak generators, even those running on low-cost natural gas. Lower solar module costs also stimulate demand from consumer markets where the cost of solar compares very favourably to retail electric rates.[111]
In the year 2015, First Solar agreed to supply solar power at 3.87 cents/kWh levelised price from its 100 MW Playa Solar 2 project which is far cheaper than the electricity sale price from conventional electricity generation plants.[112] From January 2015 through May 2016, records have continued to fall quickly, and solar electricity prices, which have reached levels below 3 cents/kWh, continue to fall.[113] In August 2016, Chile announced a new record low contract price to provide solar power for $29.10 per megawatt-hour (MWh).[114] In September 2016, Abu Dhabi announced a new record breaking bid price, promising to provide solar power for $24.2 per MWh[115] In October 2017, Saudi Arabia announced a further low contract price to provide solar power for $17.90 per MWh.[116] In July 2019, Portugal announced a lowest contract price of $16.54 per MWh.[117] In April 2020, Abu Dhabi Power Corporation (ADPower) secured $13.5 per MWh tariff for its 2GW solar PV project.[118]
With a carbon price of $50/ton (which would raise the price of coal-fired power by 5c/kWh), solar PV is cost-competitive in most locations. The declining price of PV has been reflected in rapidly growing installations, totaling a worldwide cumulative capacity of 297 GW by end 2016. According to some estimates total investment in renewables for 2011 exceeded investment in carbon-based electricity generation.[119]
In the case of self consumption, payback time is calculated based on how much electricity is not brought from the grid. Additionally, using PV solar power to charge DC batteries, as used in Plug-in Hybrid Electric Vehicles and Electric Vehicles, leads to greater efficiencies, but higher costs. Traditionally, DC generated electricity from solar PV must be converted to AC for buildings, at an average 10% loss during the conversion. Inverter technology is rapidly improving and current equipment has reached 99% efficiency for small scale residential,[120] while commercial scale three-phase equipment can reach well above 98% efficiency. However, an additional efficiency loss occurs in the transition back to DC for battery driven devices and vehicles, and using various interest rates and energy price changes were calculated to find present values that range from $2,060 to $8,210[needs update] (analysis from 2009, based on a panel price of $9 per watt, about 90 times the October 2019 price listed above).[121]
It is also possible to combine solar PV with other technologies to make hybrid systems, which enable more stand alone systems. The calculation of LCOEs becomes more complex, but can be done by aggregating the costs and the energy produced by each component. As for example, PV and cogen and batteries[122] while reducing energy- and electricity-related greenhouse gas emissions as compared to conventional sources.[123] In May 2020, the discovered first year tariff in India is ₹2.90 (3.9¢ US) per KWh with ₹3.60 (4.8¢ US) per KWh levelized tariff for round the clock power supply from hybrid renewable power plants with energy storage.[124] The tariff is cheaper than new coal, natural gas, nuclear, etc. power plants for base load application.
Solar thermal[]
LCOE of solar thermal power with energy storage which can operate round the clock on demand, has fallen to AU$78/MWh (US$61/MWh) in August 2017.[125] Though solar thermal plants with energy storage can work as stand alone systems, combination with solar PV power can deliver further cheaper power.[126] Cheaper and dispatchable solar thermal storage power need not depend on costly or polluting coal/gas/oil/nuclear based power generation for ensuring stable grid operation.[127][128]
When a solar thermal storage plant is forced to idle due to lack of sunlight locally during cloudy days, it is possible to consume the cheap excess infirm power from solar PV, wind and hydro power plants (similar to a lesser efficient, huge capacity and low cost battery storage system) by heating the hot molten salt to higher temperature for converting the stored thermal energy in to electricity during the peak demand hours when the electricity sale price is profitable.[129][130] Biomass fuel firing can also be incorporated in solar thermal plants economically to enhance their dispatchable generation capability.[131]
In 2020, solar thermal heat prices (US cents/kWh-thermal) at 600 °C above temperature with round the clock availability has fallen below 2 cents/kwh-thermal which is cheaper than heat energy derived from fossil fuels.[132]
Wind power[]
This cost has additionally reduced as wind turbine technology has improved. There are now longer and lighter wind turbine blades, improvements in turbine performance and increased power generation efficiency. Also, wind project capital and maintenance costs have continued to decline.[134]
- Onshore wind
In the windy great plains expanse of the central United States new-construction wind power costs in 2017 are compellingly below costs of continued use of existing coal burning plants. Wind power can be contracted via a power purchase agreement at two cents per kilowatt hour while the operating costs for power generation in existing coal-burning plants remain above three cents.[135]
- Offshore wind
In 2016 the Norwegian Wind Energy Association (NORWEA) estimated the LCoE of a typical Norwegian wind farm at 44 €/MWh, assuming a weighted average cost of capital of 8% and an annual 3,500 full load hours, i.e. a capacity factor of 40%. NORWEA went on to estimate the LCoE of the 1 GW Fosen Vind onshore wind farm which is expected to be operational by 2020 to be as low as 35 €/MWh to 40 €/MWh.[136] In November 2016, Vattenfall won a tender to develop the Kriegers Flak windpark in the Baltic Sea for 49.9 €/MWh,[137] and similar levels were agreed for the Borssele offshore wind farms. As of 2016, this is the lowest projected price for electricity produced using offshore wind.
See also[]
- Electricity pricing
- Life-cycle greenhouse gas emissions of energy sources
- Distributed generation
- Economics of nuclear power plants
- Demand response
- Variable renewable energy
- National Grid Reserve Service
- Nuclear power in France
- List of thermal power station failures
- Calculating the cost of the UK Transmission network: Estimating cost per kWh of transmission
- List of countries by renewable electricity production
- List of U.S. states by electricity production from renewable sources
- Environmental impact of electricity generation
- Grid parity
Further reading[]
- Economic Value of U.S. Fossil Fuel Electricity Health Impacts. United States Environmental Protection Agency.
- Lazard’s Levelized Cost of Energy Analysis – Version 14.0 (Oct. 2020)
References[]
- ^ "Majority of New Renewables Undercut Cheapest Fossil Fuel on Cost". IRENA.org. International Renewable Energy Agency. 22 June 2021. Archived from the original on 22 June 2021. ● Infographic (with numerical data) and archive thereof
- ^ Chrobak, Ula (author); Chodosh, Sara (infographic) (28 January 2021). "Solar power got cheap. So why aren't we using it more?". Popular Science. Archived from the original on 29 January 2021. ● Chodosh's graphic is derived from data in "Lazard's Levelized Cost of Energy Version 14.0" (PDF). Lazard.com. Lazard. 19 October 2020. Archived (PDF) from the original on 28 January 2021.
- ^ Nuclear Energy Agency/International Energy Agency/Organization for Economic Cooperation and Development Projected Costs of Generating Electricity (2005 Update) Archived 12 September 2016 at the Wayback Machine
- ^ K. Branker, M. J.M. Pathak, J. M. Pearce, doi:10.1016/j.rser.2011.07.104 A Review of Solar Photovoltaic Levelized Cost of Electricity, Renewable and Sustainable Energy Reviews 15, pp.4470–4482 (2011). Open access
- ^ a b c d Branker, K.; Pathak, M.J.M.; Pearce, J.M. (2011). "A Review of Solar Photovoltaic Levelized Cost of Electricity". Renewable and Sustainable Energy Reviews. 15 (9): 4470–4482. doi:10.1016/j.rser.2011.07.104. S2CID 73523633. Open access
- ^ US Energy Information Administration, Levelized Cost and Levelized Avoided Cost of New Generation Resources in the Annual Energy Outlook 2014, April 2014.
- ^ EIA 2021 Levelized Costs of New Generation Resources in the Annual Energy Outlook 2021
- ^ A Review of Electricity Unit Cost Estimates Working Paper, December 2006 – Updated May 2007 "Archived copy" (PDF). Archived from the original (PDF) on 8 January 2010. Retrieved 6 October 2009.CS1 maint: archived copy as title (link)
- ^ "Cost of wind, nuclear and gas powered generation in the UK". Claverton-energy.com. Retrieved 4 September 2012.
- ^ "David Millborrows paper on wind costs". Claverton-energy.com. Retrieved 4 September 2012.
- ^ a b c d e f g h i j k "Cost and Performance Characteristics of New Generating Technologies, Annual Energy Outlook 2019" (PDF). U.S. Energy Information Administration. 2019. Retrieved 10 May 2019.
- ^ a b https://www.nrel.gov/docs/fy19osti/72399.pdf
- ^ [1] 2017 Annual Technology Baseline: Coal NREL
- ^ "(Xenon-135) Response to Reactor Power Changes". Nuclear-Power.net. Retrieved 8 August 2019.
- ^ "Molten Salt Reactors". World Nuclear Association. December 2018. Retrieved 8 August 2019.
MSRs have large negative temperature and void coefficients of reactivity, and are designed to shut down due to expansion of the fuel salt as temperature increases beyond design limits. . . . The MSR thus has a significant load-following capability where reduced heat abstraction through the boiler tubes leads to increased coolant temperature, or greater heat removal reduces coolant temperature and increases reactivity.
- ^ "Comparing the Costs of Intermittent and Dispatchable Electricity-Generating Technologies", by Paul Joskow, Massachusetts Institute of Technology, September 2011". Retrieved 10 May 2019.
- ^ a b c d Bronski, Peter (29 May 2014). "You Down With LCOE? Maybe You, But Not Me:Leaving behind the limitations of levelized cost of energy for a better energy metric". RMI Outlet. Rocky Mountain Institute (RMI). Archived from the original on 28 October 2016. Retrieved 28 October 2016.
Desirable shifts in how we as a nation and as individual consumers—whether a residential home or commercial real estate property—manage, produce, and consume electricity can actually make LCOE numbers look worse, not better. This is particularly true when considering the influence of energy efficiency...If you’re planning a new, big central power plant, you want to get the best value (i.e., lowest LCOE) possible. For the cost of any given power-generating asset, that comes through maximizing the number of kWh it cranks out over its economic lifetime, which runs exactly counter to the highly cost-effective energy efficiency that has been a driving force behind the country’s flat and even declining electricity demand. On the flip side, planning new big, central power plants without taking continued energy efficiency gains (of which there’s no shortage of opportunity—the February 2014 UNEP Finance Initiative report Commercial Real Estate: Unlocking the energy efficiency retrofit investment opportunity identified a $231–$300 billion annual market by 2020) into account risks overestimating the number of kWh we’d need from them and thus lowballing their LCOE... If I’m a homeowner or business considering purchasing rooftop solar outright, do I care more about the per-unit value (LCOE) or my total out of pocket (lifetime system cost)?...The per-unit value is less important than the thing considered as a whole...LCOE, for example, fails to take into account the time of day during which an asset can produce power, where it can be installed on the grid, and its carbon intensity, among many other variables. That’s why, in addition to [levelized avoided cost of energy (LACE)], utilities and other electricity system stakeholders...have used benefit/cost calculations and/or an asset’s capacity value or contribution to peak on a system or circuit level.
- ^ a b "Subsidies and costs of EU energy. Project number: DESNL14583" Pages: 52. EcoFys, 10 October 2014. Accessed: 20 October 2014. Size: 70 pages in 2MB.
- ^ International Energy Outlook: Electricity "Although coal-fired generation increases by an annual average of only 1.9 percent, it remains the largest source of electricity generation through 2035. In 2008, coal-fired generation accounted for 40 percent of world electricity supply; in 2035, its share decreases to 37 percent, as renewables, natural gas, and nuclear power all are expected to advance strongly during the projection and displace the need for coal-fired-generation in many parts of the world. World net coal-fired generation grows by 67 percent, from 7.7 trillion kilowatthours in 2008 to 12.9 trillion kilowatthours in 2035." "International Energy Outlook 2020". Archived from the original on 22 August 2012. Retrieved 4 September 2012.CS1 maint: bot: original URL status unknown (link)
- ^ "BBC NEWS – Business – The economic impact of global warming". 14 October 2002. Retrieved 25 November 2016.
- ^ O'Loughlin, Toni (27 October 2009). "Climate change threatens Australia's coastal lifestyle, report warns". The Guardian. Retrieved 25 November 2016.
- ^ Tufts Civil Engineer Predicts Boston’s Rising Sea Levels Could Cause Billions Of Dollars In Damage
- ^ "Rising Sea Levels' cost on Boston" (PDF). Retrieved 10 May 2019.
- ^ "Tufts University slide 28, note projected Bangladesh evacuation". Retrieved 25 November 2016.
- ^ "The Hidden Costs of Fossil Fuels". Retrieved 25 November 2016.
- ^ "Climate Change Effects – Rising Sea Level in depth". Archived from the original on 21 September 2011. Retrieved 25 November 2016.
- ^ "The Dark Side of Solar Power". Harvard Business Review. 18 June 2021. ISSN 0017-8012. Retrieved 23 June 2021.
- ^ "End-of-life management: Solar Photovoltaic Panels". /publications/2016/Jun/End-of-life-management-Solar-Photovoltaic-Panels. Retrieved 23 June 2021.
- ^ "New research reveals the real costs of electricity in Europe" (PDF). Archived from the original (PDF) on 24 September 2015. Retrieved 10 May 2019.
- ^ ExternE-Pol, External costs of current and advanced electricity systems, associated with emissions from the operation of power plants and with the rest of the energy chain, final technical report. See figure 9, 9b and figure 11
- ^ "Carbon pricing – the one thing economists agree on - KPMG United Kingdom". KPMG. 9 November 2020. Retrieved 26 September 2021.
- ^ IPCC, Glossary A-D Archived 16 April 2015 at the Wayback Machine: "Climate price", in IPCC AR4 SYR 2007.
- ^ Viktor Wesselak, Thomas Schabbach, Thomas Link, Joachim Fischer: Regenerative Energietechnik. Springer 2013, ISBN 978-3-642-24165-9, p. 27.
- ^ Publications: Vienna Convention on Civil Liability for Nuclear Damage. International Atomic Energy Agency.
- ^ Nuclear Power's Role in Generating Electricity Congressional Budget Office, May 2008.
- ^ Official estimate per 水旱灾害 (in Chinese). Hydrology Department of Henan. 8 October 2002. Archived from the original on 27 November 2012. Retrieved 20 April 2013.
- ^ Unofficial estimate per Human Rights Watch (1995). The Three Gorges Dam in China: forced resettlement, suppression of dissent and labor rights concerns (Report) (Human Rights Watch/Asia Vol. 7, No. 1 ed.). New York: Human Rights Watch. Retrieved 18 February 2019.
- ^ Availability of Dam Insurance Archived 8 January 2016 at the Wayback Machine 1999
- ^ Methodenkonvention 2.0 zur Schätzung von Umweltkosten B, Anhang B: Best-Practice-Kostensätze für Luftschadstoffe, Verkehr, Strom -und Wärmeerzeugung Archived 22 January 2016 at the Wayback Machine (PDF; 886 kB). Studie des (2012). Abgerufen am 23. Oktober 2013.
- ^ Ökonomische Bewertung von Umweltschäden METHODENKONVENTION 2.0 ZUR SCHÄTZUNG VON UMWELTKOSTEN Archived 4 October 2013 at the Wayback Machine (PDF; 799 kB), S. 27–29. Studie des (2012). Abgerufen am 23. Oktober 2013.
- ^ Externe Kosten der Atomenergie und Reformvorschläge zum Atomhaftungsrecht (PDF; 862 kB), 9/2012. Forum Ökologisch-Soziale Marktwirtschaft e.V. im Auftrag von Greenpeace Energy eG und dem Bundesverband Windenergie e.V. Abgerufen am 23. Oktober 2013.
- ^ "New Harvard Study Examines Cost of Coal". Environment.harvard.edu. 17 February 2011. Retrieved 4 September 2012.
- ^ a b "Low-carbon generation is becoming cost competitive, NEA and IEA say in new report". Nuclear Energy Agency (NEA). Retrieved 23 June 2021.
- ^ a b "The Full Costs of Electricity Provision" (PDF). pp. 6–7.
- ^ a b (PDF). p. 1333 https://www.ipcc.ch/site/assets/uploads/2018/02/ipcc_wg3_ar5_annex-iii.pdf. Missing or empty
|title=(help) - ^ a b "BNEF Executive Factbook" (PDF). 2 March 2021. Retrieved 3 March 2021.
- ^ a b "Levelized Cost of Energy and Levelized Cost of Storage 2020". 19 October 2020. Retrieved 24 October 2020.
- ^ a b Renewable Power Generation Costs in 2019. Abu Dhabi: International Renewable Energy Agency (IRENA). June 2020. ISBN 978-92-9260-244-4. Retrieved 6 June 2020.
- ^ "Levelised Cost of Electricity Calculator – Analysis". IEA. Retrieved 29 October 2021.
- ^ "Projected Costs of Generating Electricity 2020 – Analysis". IEA. Retrieved 29 October 2021.
- ^ "Scale-up of Solar and Wind Puts Existing Coal, Gas at Risk". 28 April 2020. Retrieved 31 May 2020.
- ^ Solar, wind and battery storage now cheapest energy options just about everywhere [2]
- ^ a b "Coûts de production des ENR" (PDF). ADEME. 22 November 2017. Retrieved 10 May 2019.
- ^ "One simple chart shows why an energy revolution is coming — and who is likely to come out on top". Business Insider France (in French). 8 May 2018. Retrieved 17 October 2018.
- ^ a b c "Studie: Stromgestehungskosten erneuerbare Energien - März 2018". Fraunhofer ISE. 2018. Retrieved 2 April 2018.
- ^ a b "Levelized cost of electricity renewable energy technologies" (PDF). Fraunhofer ISE. 2013. Retrieved 6 May 2014.
- ^ Ahmadi, Esmaeil; McLellan, Benjamin; Ogata, Seiichi; Mohammadi-Ivatloo, Behnam; Tezuka, Tetsuo (2020). "An Integrated Planning Framework for Sustainable Water and Energy Supply". Sustainability. 12 (10): 4295. doi:10.3390/su12104295.
- ^ a b Olğun, Kinstellar-Şeyma (February 2021). "New Turkish-Lira tariff scheme for renewable energy projects in Turkey | Lexology". www.lexology.com. Retrieved 3 February 2021.
- ^ "Amendments In The Law On Utilization Of Renewable Energy Sources For The Purpose Of Generating Electrical Energy - Energy and Natural Resources - Turkey". www.mondaq.com. Retrieved 21 December 2020.
- ^ Energy Deals 2019 (Report). PricewaterhouseCoopers. February 2020.
- ^ "2010 Annual Report on Energy (Japan's "Energy White Paper 2010") (outline)" (PDF). 28 May 2021. Retrieved 1 October 2021.
- ^ Johnston, Eric, "Son's quest for sun, wind has nuclear interests wary", Japan Times, 12 July 2011, p. 3.
- ^ Bird, Winifred, "Powering Japan's future", Japan Times, 24 July 2011, p. 7.
- ^ Johnston, Eric, "Current nuclear debate to set nation's course for decades", Japan Times, 23 September 2011, p. 1.[dead link]
- ^ "Solar Power Generation Costs in Japan" (PDF). Renewable Energy Institute. Retrieved 30 June 2020.
- ^ "Institution of Engineers and Shipbuilders in Scotland report" (PDF). Retrieved 4 September 2012.
- ^ "Institution of Engineers and Shipbuilders in Scotland data". Iesisenergy.org. Retrieved 4 September 2012.
- ^ Electricity Market Reform – Delivery Plan Department of Energy and Climate Change, December 2013
- ^ Carsten Volkery: Kooperation mit China: Großbritannien baut erstes Atomkraftwerk seit Jahrzehnten, In: Spiegel Online vom 21. Oktober 2013.
- ^ "ELECTRICITY GENERATION COSTS - Table 16: Levelised Cost Estimates for Projects Starting in 2015" (PDF). www.gov.uk. BEIS. November 2016. p. 58. Retrieved 6 December 2016.
- ^ "UK nuclear power plant gets go-ahead". BBC News. 21 October 2013.
- ^ Roland Gribben and Denise Roland (21 October 2013). "Hinkley Point nuclear power plant to create 25,000 jobs, says Cameron". London: Daily Telegraph. Archived from the original on 21 October 2013.
- ^ "New Report: Renewable Energy and Energy Efficiency Will Grow, Provide Options for Clean Power Plan Compliance Based on Cost Competitiveness—Official Projections Fail to Capture Market Realities, Skewing Policy Considerations". PR newswire. 22 June 2015.
- ^ a b c US Energy Information Administration, Levelized cost and levelized avoided cost of new generation resources in the Annual Energy Outlook 2015, 14 April 2015
- ^ "U.S. Energy Information Administration (EIA) – Source". Retrieved 25 November 2016.
- ^ US Energy Information Administration, 2016 Levelized cost of new generation resources in the Annual Energy Outlook 2010, 26 April 2010
- ^ US Energy Information Administration, Levelized cost of new generation resources in the Annual Energy Outlook 2011, 26 April 2011
- ^ US Energy Information Administration, Levelized cost of new generation resources in the Annual Energy Outlook 2012, 12 July 2012
- ^ US Energy Information Administration, Levelized cost of new generation resources in the Annual Energy Outlook 2013, 28 January 2013
- ^ US Energy Information Administration, Levelized cost and levelized avoided cost of new generation resources in the Annual Energy Outlook 2014, 17 April 2014
- ^ Levelized cost and levelized avoided cost of new generation resources, US Energy Information Administration, Annual Energy Audit 2016, 5 August 2016.
- ^ Levelized cost and levelized avoided cost of new generation resources, US Energy Information Administration, Annual Energy Outlook 2017, April 2017.
- ^ a b Levelized cost and levelized avoided cost of new generation resources, US Energy Information Administration, Annual Energy Outlook 2018, March 2018.
- ^ https://www.eia.gov/outlooks/aeo/pdf/electricity_generation.pdf
- ^ OpenEI Transparent Cost Database. Accessed 19 June 2015.
- ^ "Estimated Cost of New Renewable and Fossil Generation in California" (PDF). C ali fornia Ene rgy C ommissi on. Retrieved 10 May 2019.
- ^ https://ww2.energy.ca.gov/almanac/electricity_data/cost_of_generation_report.html
- ^ "Energy Commission Publications" (PDF).
- ^ a b [3] November 2014
- ^ Solar and Wind Outshine Fossil Fuels November 2014
- ^ "Lazard Press Release" (PDF). Lazard. 16 December 2016. Retrieved 6 November 2017.
- ^ a b "Lazard's Levelized Cost of Storage Analysis — Version 1.0" (PDF). Lazard. November 2015. Retrieved 10 May 2019.
- ^ "Lazard's Levelized Cost of Energy Analysis — Version 10.0" (PDF). Lazard. December 2016. Retrieved 10 May 2019.
- ^ "Lazard's Levelized Cost of Storage — Version 2.0" (PDF). December 2016. Retrieved 10 May 2019.
- ^ "Lazard's Levelized Cost of Energy Analysis - Version 11.0" (PDF). Lazard. 2 November 2017. Retrieved 4 November 2017.
- ^ a b c "Lazard's Levelized Cost of Storage Analysis - Version 3.0" (PDF). Lazard. 2 November 2017. Retrieved 4 November 2017.
- ^ "Lazard Press Release November 2, 2017" (PDF). Lazard. 2 November 2017. Retrieved 4 November 2017.
- ^ https://www.lazard.com/media/450784/lazards-levelized-cost-of-energy-version-120-vfinal.pdf
- ^ "Levelized Cost of Energy and Levelized Cost of Storage 2018".
- ^ https://www.lazard.com/media/451086/lazards-levelized-cost-of-energy-version-130-vf.pdf
- ^ "Levelized Cost of Energy and Levelized Cost of Storage 2019".
- ^ "Solar Photovoltaics Competing in the Energy Sector—On the road to competitiveness" (PDF). . September 2011. p. 18. Archived from the original (PDF) on 26 February 2013. Retrieved 11 March 2015.
- ^ "Solar is now 'cheapest electricity in history', confirms IEA". 13 October 2020. Retrieved 13 October 2020.
- ^ "Price Quotes (see 'PV spot price')". Retrieved 23 August 2017.
- ^ "Sunny Uplands: Alternative energy will no longer be alternative". The Economist. 21 November 2012. Retrieved 28 December 2012.
- ^ Ken Wells (25 October 2012), "Solar Energy Is Ready. The U.S. Isn't", Bloomberg Businessweek, businessweek.com, retrieved 1 November 2012 (subscription required)
- ^ "Utilities' Honest Assessment of Solar in the Electricity Supply". Retrieved 25 November 2016.
- ^ "Renewables Investment Breaks Records". Renewable Energy World. 29 August 2011.
- ^ Renewable energy costs drop in '09 Reuters, 23 November 2009.
- ^ Solar Power 50% Cheaper By Year End – Analysis Reuters, 24 November 2009.
- ^ Arno Harris (31 August 2011). "A Silver Lining in Declining Solar Prices". Renewable Energy World.
- ^ "NV Energy buys utility-scale solar at record low price under 4 cents/kWh". Retrieved 23 July 2015.
- ^ New Record Set for World's Cheapest Solar, Now Undercutting Coal (2.99 cents/kWh United Arab Emirates, easily besting coal, which came in at 4.501 cents per kilowatt-hour under a 25-year power purchase agreement, with chart of solar prices in 2015 to May 2016)
- ^ EcoWatch (22 August 2016). "Great news!". Retrieved 25 November 2016.
- ^ "UPDATE – Abu Dhabi confirms USD 24.2/MWh bid in solar tender – SeeNews Renewables". Archived from the original on 26 October 2016. Retrieved 25 November 2016.
- ^ ""The Birth of a New Era in Solar PV" — Record Low Cost On Saudi Solar Project Bid". cleantechnica.com. 7 October 2017. Retrieved 7 October 2017.
- ^ "Race Heats Up For Title Of Cheapest Solar Energy In The World". Retrieved 28 October 2019.
- ^ "Abu Dhabi Lays Claim To World's Cheapest Solar Power, After Revealing Bids For 2GW Mega-Plant". Retrieved 28 April 2020.
- ^ John Quiggin (3 January 2012). "The End of the Nuclear Renaissance |". National Interest.
- ^ Osborne, Mark (10 November 2016). "SolarEdge sales slow on US residential market sluggishness". pv-tech.org. Retrieved 9 December 2016.
- ^ Converting Solar Energy into the PHEV Battery "VerdeL3C.com", May 2009
- ^ Mundada, Aishwarya; Shah, Kunal; Pearce, Joshua M. (2016). "Levelized cost of electricity for solar photovoltaic, battery and cogen hybrid systems". Renewable and Sustainable Energy Reviews. 57: 692–703. doi:10.1016/j.rser.2015.12.084.
- ^ Shah, Kunal K.; Mundada, Aishwarya S.; Pearce, Joshua M. (2015). "Performance of U.S. hybrid distributed energy systems: Solar photovoltaic, battery and combined heat and power". Energy Conversion and Management. 105: 71–80. doi:10.1016/j.enconman.2015.07.048.
- ^ "India wins deal for 24X7 supply of green power". Retrieved 9 May 2020.
- ^ "Solar Reserve awarded AU$78/MWh Concentrated Solar Power contract". Retrieved 23 August 2017.
- ^ "Aurora: What you should know about Port Augusta's solar power-tower". 21 August 2017. Retrieved 22 August 2017.
- ^ "Dispatchable Concentrated Solar Power Broke Price Records in 2017". Retrieved 22 September 2017.
- ^ "UAE's push on concentrated solar power should open eyes across world". Retrieved 26 September 2017.
- ^ "Salt, silicon or graphite: energy storage goes beyond lithium ion batteries". 5 April 2017. Retrieved 1 September 2017.
- ^ "Commercializing Standalone Thermal Energy Storage". Retrieved 1 September 2017.
- ^ "The Concentrated Solar Power triggers its production in Spain". Retrieved 29 October 2019.
- ^ "SolarPACES Conference, Heliogen Introduces Solar Heat at 1 cent/kWh". Retrieved 13 October 2020.
- ^ Lantz, E.; Hand, M. and Wiser, R. (13–17 May 2012) "The Past and Future Cost of Wind Energy," National Renewable Energy Laboratory conference paper no. 6A20-54526, p. 4
- ^ Danielson, David (14 August 2012). "A Banner Year for the U.S. Wind Industry". whitehouse.gov – via National Archives.
- ^ Moody's: Utilities increasingly adding low cost wind power to rate base, leaving inefficient coal plants at risk - March 15, 2017
- ^ "Europe's biggest and cheapest onshore wind project". norwea.no. 7 June 2016. Archived from the original on 29 August 2016. Retrieved 21 August 2016.
- ^ "Vattenfall wins tender to build the largest wind farm in the Nordics". corporate.vattenfall.com. Retrieved 17 November 2016.
Bibliography[]
- IPCC AR4 SYR (2007), Core Writing Team; Pachauri, R.K; Reisinger, A. (eds.), Climate Change 2007: Synthesis Report, Contribution of Working Groups I, II and III to the Fourth Assessment Report of the Intergovernmental Panel on Climate Change, IPCC, ISBN 978-92-9169-122-7
- Late modern economic history
- Electricity economics
- Economics comparisons