Economy of Tanzania
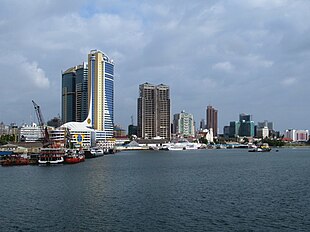 Dar es Salaam, the financial centre of Tanzania | |
| Currency | Tanzanian shilling (TZS, TSh) |
|---|---|
Fiscal year | 1 July – 30 June |
Trade organisations | AU, AfCFTA (signed), EAC, SADC, WTO |
Country group | |
| Statistics | |
| Population | |
| GDP | |
| GDP rank | |
GDP growth |
|
GDP per capita | |
GDP per capita rank | |
GDP by sector |
|
Inflation (CPI) | 3.9% (2020 est.)[5] |
| 12% (2014)[7] | |
Population below poverty line | |
Gini coefficient | 40.5 medium (2017)[10] |
Labour force | |
Labour force by occupation | Agriculture: 50%[15]:page 56 |
| Unemployment | 2.2% (2017)[16] |
Main industries | agricultural processing (sugar, beer, cigarettes, sisal twine); mining (diamonds, gold, and iron), salt, soda ash; cement, oil refining, shoes, apparel, wood products, fertilizer[3] |
| External | |
| Exports | |
Export goods | show
List |
Main export partners |
|
| Imports | |
Import goods | show
List |
Main import partners |
|
FDI stock | $12.715 billion (2013)[21] |
| –4.002 billion (October 2015)[18] | |
Gross external debt | $15.4 billion (October 2015)[18] |
| Public finances | |
| –1.8% (of GDP) (2017 est.)[3] | |
| Revenues | 7.873 billion (2017 est.)[3] |
| Expenses | 8.818 billion (2017 est.)[3] |
| Economic aid | $490 million (recipient; 2014)[22] |
| n/a (TBD) | |
Foreign reserves | $4,383.6 million (4.5 months of imports; 2013)[18] |
The economy of Tanzania is a lower-middle income economy[23][24] that is overwhelmingly dependent on agriculture.[25] Tanzania's economy has been transitioning from a command economy to a market economy since 1985. Although total GDP has increased since these reforms began, GDP per capita dropped sharply at first, and only exceeded the pre-transition figure in around 2007.[26]
Following the rebasing of the economy in 2014, the GDP increased by a third to $41.33 billion.[27]
In 2019, the Tanzanian economy grew by 5.8%, reaching a GDP of $55.5 billion. This growth made it the 2nd largest economy in East Africa after Kenya, and the 7th largest in Sub-Saharan Africa.[28]
It has sustained relatively high economic growth compared to global trends, as is characteristic of African nations. It is worth noting that according to World Bank data, the last 5 years have seen the slowest growth since 2000. The medium-term outlook is so far positive, with growth projected at 6 percent in 2020/21, which is supported by large infrastructure spending.[29][30]
The World Bank (WB) expects the economic growth of Tanzania to slow to 2.5% in 2020[31] due to the Covid-19 pandemic which has affected the labor market, the production capacity, and productivity. Tourism has halted, and exports of manufacturing and agricultural goods slumped.
The International Monetary Fund (IMF) estimates the growth of Tanzania's economy at just 1.9% in 2020. It forecast a recovery in 2021, with GDP growth of 3.6%.[32]
History[]
Significant measures have been taken to liberalize the Tanzanian economy along market lines and encourage both foreign and domestic private investment. Beginning in 1986, the Government of Tanzania embarked on an adjustment program to dismantle the socialist (Ujamaa) economic controls and encourage more active participation of the private sector in the economy. The program included a comprehensive package of policies which reduced the budget deficit and improved monetary control, substantially depreciated the overvalued exchange rate, liberalized the trade regime, removed most price controls, eased restrictions on the marketing of food crops, freed interest rates, and initiated a restructuring of the financial sector.
Current GDP per capita of Tanzania grew more than 40 percent between 1998 and 2007. In May 2009, the International Monetary Fund (IMF) approved an Exogenous Shock Facility for Tanzania to help the country cope with the global economic crisis[33] Tanzania is also engaged in a Policy Support Instrument (PSI) with the IMF, which commenced in February 2007 after Tanzania completed its second three-year Poverty Reduction and Growth Facility (PRGF), the first having been completed in August 2003. The PRGF was the successor program to the Enhanced Structural Adjustment Facility, which Tanzania also participated in from 1996 to 1999. The IMF's PSI program provides policy support and signaling to participating low-income countries and is intended for countries that have usually achieved a reasonable growth performance, low underlying inflation, an adequate level of official international reserves, and have begun to establish external and net domestic debt sustainability.
Tanzania also embarked on a major restructuring of state-owned enterprises. The program has so far divested 335 out of some 425 parastatal entities. Overall, real economic growth has averaged about 4 percent a year, much better than the previous 20 years, but not enough to improve the lives of average Tanzanians. Also, the economy remains overwhelmingly donor-dependent. Moreover, Tanzania has an external debt of $7.9 billion. The servicing of this debt absorbs about 40 percent of total government expenditures. Tanzania has qualified for debt relief under the enhanced Heavily Indebted Poor Countries (HIPC) initiative. Debts worth over $6 billion were canceled following implementation of the Paris Club 7 Agreement. Height measure studies for Tanzania show that welfare increased through the years of colonization, with an decline during the 1930s. This is due to epidemics in that period of time.[34]
Macro-economic trend[]
This is a chart of trend of gross domestic product of Tanzania at market prices estimated by the International Monetary Fund with figures in millions of Tanzanian Shillings. See [1]
| Year | Gross Domestic Product | US Dollar Exchange |
|---|---|---|
| 1980 | 45,749 | 8.21 Shillings |
| 1985 | 115,006 | 17.87 Shillings |
| 1990 | 830,693 | 195.04 Shillings |
| 1995 | 3,020,501 | 536.40 Shillings |
| 2000 | 7,267,133 | 800.43 Shillings |
| 2005 | 13,713,477 | 1,127.10 Shillings |
| 2010 | – | 1,515.10 Shillings |
Mean wages were $0.52 per man-hour in 2009.[citation needed] The economy saw continuous real GDP growth of at least 5% since 2007.
The following table shows the main economic indicators in 1980–2017. Inflation below 5% is in green.[35]
| Year | GDP (in bil. US$ PPP) |
GDP per capita (in US$ PPP) |
GDP growth (real) |
Inflation rate (in Percent) |
Government debt (in % of GDP) |
|---|---|---|---|---|---|
| 1980 | 11.0 | 592 | n/a | ||
| 1981 | n/a | ||||
| 1982 | n/a | ||||
| 1983 | n/a | ||||
| 1984 | n/a | ||||
| 1985 | n/a | ||||
| 1986 | n/a | ||||
| 1987 | n/a | ||||
| 1988 | n/a | ||||
| 1989 | n/a | ||||
| 1990 | n/a | ||||
| 1991 | n/a | ||||
| 1992 | n/a | ||||
| 1993 | n/a | ||||
| 1994 | n/a | ||||
| 1995 | n/a | ||||
| 1996 | n/a | ||||
| 1997 | n/a | ||||
| 1998 | n/a | ||||
| 1999 | n/a | ||||
| 2000 | n/a | ||||
| 2001 | 50.2% | ||||
| 2002 | |||||
| 2003 | |||||
| 2004 | |||||
| 2005 | |||||
| 2006 | |||||
| 2007 | |||||
| 2008 | |||||
| 2009 | |||||
| 2010 | |||||
| 2011 | |||||
| 2012 | |||||
| 2013 | |||||
| 2014 | |||||
| 2015 | |||||
| 2016 | |||||
| 2017 |
Agriculture[]

The Tanzanian economy is heavily based on agriculture, which accounts for 28.7 percent of gross domestic product,[15]:page 37 provides 85 percent of exports,[36] and accounts for half of the employed workforce;[15]:page 56 The agricultural sector grew 4.3 percent in 2012, less than half of the Millennium Development Goal target of 10.8 percent.[37] 16.4 percent of the land is arable,[38] with 2.4 percent of the land planted with permanent crops.[39]
This strong dependence on agriculture, makes Tanzania's economy highly vulnerable to weather shocks and fluctuating commodity prices. 76% of Tanzania's population subsist thanks to agriculture and, due to the lack of knowledge and infrastructure to develop and implement some kind of agricultural technology, any droughts, floods, or temperature shocks can severely damage the living standards of those people and create huge increases in unemployment, hunger, and malnutrition rates, as well as, in really severe case, mortality rates due to starvation.[40]
Tanzania produced in 2018:
- 5.9 million tons of maize;
- 5 million tons of cassava (12th largest producer in the world);
- 3.8 million tons of sweet potato (4th largest producer in the world, second only to China, Malawi and Nigeria);
- 3.4 million tons of banana (10th largest producer in the world, 13th adding plantain production);
- 3 million tons of rice;
- 3 million tons of sugarcane;
- 1.7 million tons of potato;
- 1.2 million tons of beans (6th largest producer in the world);
- 940 thousand tons of peanut (7th largest producer in the world);
- 930 thousand tons of sunflower seed (12th largest producer in the world);
- 808 thousand tons of sorghum;
- 561 thousand tons of sesame seed (5th largest producer in the world, losing only to Sudan, Myanmar, India and Nigeria);
- 546 thousand tons of coconut (11th largest producer in the world);
- 454 thousand tons of mango (including mangosteen and guava);
- 389 thousand tons of pineapple;
- 373 thousand tons of orange;
- 356 thousand tons of tomato;
- 238 thousand tons of cotton;
- 171 thousand tons of cashew nuts (6th largest producer in the world);
In addition to smaller productions of other agricultural products, like tobacco (107 thousand tons, 8th largest producer in the world), coffee (55 thousand tons), tea (36 thousand tons) and sisal (33 thousand tons).[41]
Industry[]
Industries are a major and growing component of the Tanzanian economy, contributing 22.2 percent of GDP in 2013.[15]:page 37 This component includes mining and quarrying, manufacturing, electricity and natural gas, water supply, and construction.[15]:page 37
Mining[]
Mining contributed 3.3 percent of GDP in 2013.[15]:page 33 The vast majority of the country's mineral export revenue comes from gold, accounting for 89 percent of the value of those exports in 2013.[15]:page 71 It also exports sizable quantities of gemstones, including diamonds and tanzanite.[42]:page 1250 All of Tanzania's coal production, which totalled 106,000 short tons in 2012, is used domestically.[43]
Minerals[]
Other minerals exploited in Tanzania include;
- Pozzolana
- Salt
- Gypsum
- Kaolinite
- Silver ore
- Copper
- Phosphate
- Tanzanite
- Tin
- Graphite
- Bauxite.[15]:pages 70–71
Modern gold mining in Tanzania started in the German colonial period, beginning with gold discoveries near Lake Victoria in 1894. The first gold mine in what was then Tanganyika, the Sekenke Gold Mine, began operation in 1909, and gold mining in Tanzania experienced a boom between 1930 and World War II. By 1967, gold production in the country had dropped to insignificance but was revived in the mid-1970s, when the gold price rose once more. In the late 1990s, foreign mining companies started investing in the exploration and development of gold deposits in Tanzania, leading to the opening of a number of new mines, like the Golden Pride mine, which opened in 1999 as the first modern gold mine in the country, or the Buzwagi mine, which opened in 2009.[44][45]

Nickel reserves amounting to 290,000 tonnes were discovered in October 2012 by Ngwena Company Limited, a subsidiary of the Australian mining company IMX Resources. An initial investment of around USD $38 million has been made since exploration began in 2006, and nickel should start being mined at the end of 2015.[46]
Chinese firms have been showing major interest in Tanzania's mineral deposits; an announcement was made in late 2011 of a plan by the , to invest about USD3 billion to develop the Mchuchuma coal and Liganga iron ore projects in the south of the country.[47] It was also announced in August 2012 that are in talks to purchase mining assets in Tanzania from African Barrick Gold, in a deal that could be worth more than £2 billion.[47]
In November 2012, the Tanzanian government announced investigations into allegations that mining investors in the country were harassing and on some occasions, killing residents around mining sites.[48]
Electricity[]
The government-owned Tanzania Electric Supply Company Limited (TANESCO) dominates the electric supply industry in Tanzania.[49] The country generated 6.013 billion kilowatt hours (kWh) of electricity in 2013, a 4.2 percent increase over the 5.771 billion kWh generated in 2012.[50]:page 4 Generation increased by 63 percent between 2005 and 2012;[51][52] however, only 15 percent of Tanzanians had access to electric power in 2011.[53] Almost 18 percent of the electricity generated in 2012 was lost because of theft and transmission and distribution problems.[51] The electrical supply varies, particularly when droughts disrupt hydropower electric generation; rolling blackouts are implemented as necessary.[42]:page 1251[49] The unreliability of the electrical supply has hindered the development of Tanzanian industry.[42]:page 1251 In 2013, 49.7 percent of Tanzania's electricity generation came from natural gas, 28.9 percent from hydroelectric sources, 20.4 percent from thermal sources, and 1.0 percent from outside the country.[50]:page 5 The government is building a 532 kilometres (331 mi) gas pipeline from Mnazi Bay to Dar es Salaam, with a scheduled completion in 2015.[54] This pipeline is expected to allow the country to double its electricity generation capacity to 3,000 megawatts by 2016.[55] The government's goal is to increase capacity to at least 10,000 megawatts by 2025.[56]
Natural gas[]

According to PFC Energy, 25 to 30 trillion cubic feet of recoverable natural gas resources have been discovered in Tanzania since 2010.[43] The value of natural gas actually produced in 2013 was US$52.2 million, a 42.7 percent increase over 2012.[15]:page 73
Commercial production of gas from the Songo Songo Island field in the Indian Ocean commenced in 2004, thirty years after it was discovered there.[57][58] Over 35 billion cubic feet of gas was produced from this field in 2013,[15]:page 72 with proven, probable, and possible reserves totalling 1.1 trillion cubic feet.[58] The gas is transported by pipeline to Dar es Salaam.[57] As of 27 August 2014, TANESCO owed the operator of this field, Orca Exploration Group Inc., US$50.4 million, down from US$63.8 million two months earlier.[59]
A newer natural gas field in Mnazi Bay in 2013 produced about one-seventh of the amount produced near Songo Songo Island[15]:page 73 but has proven, probable, and possible reserves of 2.2 trillion cubic feet.[58] Virtually all of that gas is being used for electricity generation in Mtwara.[57]
The Indian Ocean, off the coast of Mozambique and Tanzania, is proving to be a rich hunting ground for natural gas exploration. According to US Geological Survey estimates, the combined gas reserves of Mozambique and Tanzania could be as high as 250 trillion cubic feet. In Mozambique alone, proven gas reserves have increased dramatically from a mere 4.6 trillion cubic feet in 2013 to 98.8 trillion cubic feet as of mid-2015. Given continued offshore discoveries and the size of discoveries to date, continued growth in proven gas reserves is likely to continue into the foreseeable future.[60][61]
New exploration on more frontier blocks, however, will likely be slowed as oil and gas prices fall[62] and companies apply increasing caution to investing in frontier markets with nascent industries, poor infrastructure and long lead times.[63]
External trade and investment[]

Tanzania's history of political stability has encouraged foreign direct investment. The government has committed itself to improve the investment climate including redrawing tax codes, floating the exchange rate, licensing foreign banks, and creating an investment promotion center to cut red tape. Tanzania has mineral resources and a largely untapped tourism sector, which might make it a viable market for foreign investment.
The stock market capitalisation of listed companies in Tanzania was valued at $588 million in 2005 by the World Bank.[64]
Zanzibar[]
Zanzibar's economy is based primarily on the production of cloves (90% grown on the island of Pemba), the principal foreign exchange earner. Exports have suffered from the downturn in the clove market.
The Government of Zanzibar has been more aggressive than its mainland counterpart in instituting economic reforms and has legalized foreign exchange bureaus on the islands. This has loosened up the economy and dramatically increased the availability of consumer commodities. Furthermore, with external funding, the government plans to make the port of Zanzibar a free port. Rehabilitation of current port facilities and plans to extend these facilities will be the precursor to the free port. The island's manufacturing sector is limited mainly to import substitution industries, such as cigarettes, shoes, and process agricultural products. In 1992, the government designated two export-producing zones and encouraged the development of offshore financial services. Zanzibar still imports much of its staple requirements, petroleum products, and manufactured articles.
Literature[]
- Paul Collier: Labour and Poverty in Rural Tanzania. Ujamaa and Rural Development in the United Republic of Tanzania. Oxford University Press, New York 1991, ISBN 0-19-828315-6.
See also[]
- Tanzania and the World Bank
- List of regions of Tanzania by GDP
- List of companies of Tanzania
- Taxation in Tanzania
- Child labour in Tanzania
- Microfinance in Tanzania
- Poverty in Tanzania
- Economy of Africa
- United Nations Economic Commission for Africa
References[]
- ^ "World Economic Outlook Database, April 2019". IMF.org. International Monetary Fund. Retrieved 29 September 2019.
- ^ "World Bank Country and Lending Groups". datahelpdesk.worldbank.org. World Bank. Retrieved 1 July 2020.
- ^ Jump up to: a b c d e f g h "AFRICA :: TANZANIA". CIA.gov. Central Intelligence Agency. Retrieved 16 March 2020.
- ^ Jump up to: a b c "World Economic Outlook Database, October 2019". IMF.org. International Monetary Fund. Retrieved 16 March 2020.
- ^ Jump up to: a b "World Economic Outlook Database, April 2020". IMF.org. International Monetary Fund. Retrieved 1 July 2020.
- ^ "Global Economic Prospects, June 2020". openknowledge.worldbank.org. World Bank. p. 80. Retrieved 1 July 2020.
- ^ "BoT: Weighted Average Interest Rate Structure" (PDF). Bank of Tanzania. 2014. Retrieved 9 December 2014.
- ^ "Poverty headcount ratio at national poverty lines (% of population) - Tanzania". data.worldbank.org. World Bank. Retrieved 21 March 2020.
- ^ "Poverty headcount ratio at $3.20 a day (2011 PPP) (% of population) - Tanzania". data.worldbank.org. World Bank. Retrieved 1 July 2020.
- ^ "GINI index (World Bank estimate) - Tanzania". data.worldbank.org. World Bank. Retrieved 21 March 2020.
- ^ "Human Development Index (HDI)". hdr.undp.org. HDRO (Human Development Report Office) United Nations Development Programme. Retrieved 11 December 2019.
- ^ "Inequality-adjusted HDI (IHDI)". hdr.undp.org. UNDP. Retrieved 22 May 2020.
- ^ "Labor force, total - Tanzania". data.worldbank.org. World Bank & ILO. Retrieved 1 July 2020.
- ^ "Employment to population ratio, 15+, total (%) (national estimate) - Tanzania". data.worldbank.org. World Bank & ILO. Retrieved 17 March 2020.
- ^ Jump up to: a b c d e f g h i j k Statistical Abstract 2013, National Bureau of Statistics, Tanzania Ministry of Finance, July 2014, accessed 22 October 2014 Archived 17 April 2015 at the Wayback Machine
- ^ Human Development Data (1990–2017). (30 January 2019). Human Development Reports. Retrieved from http://hdr.undp.org/en/data#a%7C
- ^ "Ease of Doing Business in Tanzania". Doingbusiness.org. Retrieved 23 January 2017.
- ^ Jump up to: a b c d e "BoT: Monthly Economic Review" (PDF). Bank of Tanzania. November 2015. Retrieved 1 January 2016.
- ^ "Export Partners of Tanzania". CIA World Factbook. 2015. Retrieved 26 July 2016.
- ^ "Import Partners of Tanzania". CIA World Factbook. 2015. Retrieved 26 July 2016.
- ^ "World Investment Report 2014: Investing in the SDGs: An Action Plan" (PDF). UNCTAD. 2014. p. 210. Retrieved 9 December 2014.
- ^ "UK and international donors suspend Tanzania aid after corruption claims". The Guardian. 13 October 2014. Retrieved 9 December 2014.
- ^ "New World Bank country classifications by income level: 2020-2021". World Bank. 1 July 2020.
- ^ "Tanzania joins middle income status ahead of schedule". The Citizen. 2 July 2020.
- ^ Mascarenhas, Adolfo C.; Bryceson, Deborah Fahy; Ingham, Kenneth; Chiteji, Frank Matthew (8 September 2020). "Tanzania". Britannica. Encyclopædia Britannica. Retrieved 1 November 2020.
- ^ "Tanzania: The Story of an African Transition" (PDF). International Monetary Fund. 2009.
- ^ "UPDATE 2-Tanzania's GDP expands by 32 pct after rebasing – officials". Reuters. 19 December 2014. Archived from the original on 19 December 2014. Retrieved 19 December 2014.
- ^ "The Economy of Tanzania - 2021 Update". TanzaniaInvest. Retrieved 26 January 2021.
- ^ "Tanzania's economy on the rise in 2020". Expogr. Retrieved 26 June 2020.
- ^ "Tanzania, Kenya among the top 10 economies in Africa". The Citizen. 12 June 2020.
- ^ "Overview". World Bank. Retrieved 26 January 2021.
- ^ "Tanzania and the IMF". IMF. Retrieved 26 January 2021.
- ^ "Press Release: IMF Executive Board Completes Sixth Review Under the Policy Support Instrument, First Review Under the Exogenous Shock Facility for Tanzania".
- ^ Baten, Jörg (2016). A History of the Global Economy. From 1500 to the Present. Cambridge University Press. p. 337. ISBN 9781107507180.
- ^ "Report for Selected Countries and Subjects". www.imf.org. Retrieved 17 October 2018.
- ^ Central Intelligence Agency (2013). "Tanzania". The World Factbook. Retrieved 12 July 2013.
- ^ "MKUKUTA Annual Implementation Report 2012/13", Tanzania Ministry of Finance, November 2013, page 11, accessed 1 November 2014
- ^ "Arable land (% of land area) – Data".
- ^ "Permanent cropland (% of land area) – Data".
- ^ "Tanzania. Poverty Report" (PDF).
- ^ Tanzania production in 2018, by FAO
- ^ Jump up to: a b c "Annex on the Free Movement of Persons". East African Community. Archived from the original on 22 October 2014. Retrieved 21 October 2014.
- ^ Jump up to: a b "International – U.S. Energy Information Administration (EIA)".
- ^ Tanzania Mining History Archived 14 August 2010 at the Wayback Machine tanzaniagold.com, accessed: 24 July 2010
- ^ •Mineral Sector Overview Ministry of Energy and Minerals website, accessed: 27 July 2010
- ^ Tanzania: Nickel Exploration Bears Fruit, Africa: AllAfrica.com, 2012, retrieved 18 October 2012
- ^ Jump up to: a b Business Week Reporter, "China seeks to venture into gold mining in Tanzania", The Citizen (23 August 2012)
- ^ Tanzania: Govt Vows to Probe Mining Investors' Brutality, Africa: Allafrica.com, 2012, retrieved 30 November 2012
- ^ Jump up to: a b Electricity – Overview, Tanzania Energy and Water Utilities Regulatory Authority, accessed 25 November 2014 Archived 23 October 2014 at the Wayback Machine
- ^ Jump up to: a b "Quarterly Economic Review and Budget Execution Report for Fiscal Year 2013/14: January–March 2014", Tanzania Ministry of Finance, May 2014, accessed 11 November 2014
- ^ Jump up to: a b "IEA – Report". Archived from the original on 28 August 2018. Retrieved 10 December 2014.
- ^ "IEA – Report". Archived from the original on 26 October 2014. Retrieved 10 December 2014.
- ^ "Access to electricity (% of population) – Data".
- ^ "Gas connection to Dar houses faces hurdles", Daily News, reported by Nelly Mtema, 22 September 2014, accessed 23 October 2014 Archived 29 October 2014 at the Wayback Machine
- ^ "Tanzania: Govt Signs Gas Supply Deal to Double Power Generation", Daily News, 17 September 2014, reprinted at allAfrica.com, accessed 23 October 2014 Archived 24 October 2014 at the Wayback Machine
- ^ "Electricity Supply Industry Reform Strategy and Roadmap 2014–2025, Tanzania Ministry of Energy and Minerals, 30 June 2014, page i, accessed 26 October 2014" (PDF). Archived from the original (PDF) on 24 March 2015. Retrieved 10 May 2015.
- ^ Jump up to: a b c "International – U.S. Energy Information Administration (EIA)".
- ^ Jump up to: a b c Natural Gas – Introduction, Tanzania Energy and Water Utilities Regulatory Authority, accessed 25 November 2014 Archived 23 October 2014 at the Wayback Machine
- ^ "2014 Q2 Report for the Quarter Ended June 30 2014 and 2013", Orca Exploration Group Inc., page 3, accessed 24 October 2014
- ^ "Is East Africa's gas asset boom about to go bust?". Mineweb. Archived from the original on 20 October 2015. Retrieved 18 February 2016.
- ^ "Bright Africa | The drivers, enablers and managers of investment on the continent". www.riscura.com. Retrieved 18 February 2016.
- ^ Krauss, Clifford. "Oil Prices: What to Make of the Volatility". Retrieved 16 July 2018.
- ^ "Frontier Markets in Focus | Mark Mobius". Investment Adventures in Emerging Markets. Retrieved 18 February 2016.
- ^ "Data – Finance". Archived from the original on 5 December 2006.
Notes[]
- ^ estimates for this country explicitly take into account the effects of excess mortality due to AIDS; this can result in lower life expectancy, higher infant mortality, higher death rates, lower population growth rates, and changes in the distribution of population by age and sex than would otherwise be expected[3]
External links[]
- Economy of Tanzania at Curlie
- Confederation of Tanzanian Industries
- Tanzania latest trade data on ITC Trade Map
Government ministries, agencies and sites
- Bank of Tanzania
- Ministry of Finance and Economic Affairs
- Economic and Social Research Foundation
- World Bank Summary Trade Statistics Tanzania

| Authority control: National libraries |
|---|
- Economy of Tanzania
- African Union member economies
- World Trade Organization member economies