Metcalfe County, Kentucky
Metcalfe County | |
|---|---|
U.S. county | |
 Metcalfe County Courthouse in Edmonton | |
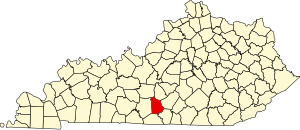 Location within the U.S. state of Kentucky | |
 Kentucky's location within the U.S. | |
| Coordinates: 36°59′N 85°38′W / 36.99°N 85.63°W | |
| Country | |
| State | |
| Founded | 1860 |
| Named for | Thomas Metcalfe |
| Seat | Edmonton |
| Largest city | Edmonton |
| Area | |
| • Total | 291 sq mi (750 km2) |
| • Land | 290 sq mi (800 km2) |
| • Water | 1.5 sq mi (4 km2) 0.5%% |
| Population | |
| • Estimate (2018) | 10,030 |
| • Density | 35/sq mi (14/km2) |
| Time zone | UTC−6 (Central) |
| • Summer (DST) | UTC−5 (CDT) |
| Congressional district | 1st |
| Website | www |

Metcalfe County is a county located in the U.S. state of Kentucky. As of the 2010 census, the population was 10,099.[1] Its county seat is Edmonton.[2] The county was founded in May 1860 and named for Thomas Metcalfe, Governor of Kentucky from 1828 to 1832.[3][4] It is historically a prohibition or dry county, although as of the uncertified vote of June 28, 2016, the county is no longer dry.
Metcalfe County is part of the Glasgow, KY Micropolitan Statistical Area, which is also included in the Bowling Green-Glasgow, KY Combined Statistical Area.
Geography[]
According to the U.S. Census Bureau, the county has a total area of 291 square miles (750 km2), of which 290 square miles (750 km2) is land and 1.5 square miles (3.9 km2) (0.5%) is water.[5]
Adjacent counties[]
- Hart County (northwest)
- Green County (northeast)
- Adair County (east)
- Cumberland County (southeast)
- Monroe County (south)
- Barren County (west)
Demographics[]
| Historical population | |||
|---|---|---|---|
| Census | Pop. | %± | |
| 1870 | 7,934 | — | |
| 1880 | 9,423 | 18.8% | |
| 1890 | 9,871 | 4.8% | |
| 1900 | 9,988 | 1.2% | |
| 1910 | 10,453 | 4.7% | |
| 1920 | 10,075 | −3.6% | |
| 1930 | 9,373 | −7.0% | |
| 1940 | 10,853 | 15.8% | |
| 1950 | 9,851 | −9.2% | |
| 1960 | 8,367 | −15.1% | |
| 1970 | 8,177 | −2.3% | |
| 1980 | 9,484 | 16.0% | |
| 1990 | 8,963 | −5.5% | |
| 2000 | 10,037 | 12.0% | |
| 2010 | 10,099 | 0.6% | |
| 2018 (est.) | 10,030 | [6] | −0.7% |
| U.S. Decennial Census[7] 1790–1960[8] 1900–1990[9] 1990–2000[10] 2010–2013[1] | |||
As of the census[11] of 2000, there were 10,037 people, 4,016 households, and 2,883 families residing in the county. The population density was 34 per square mile (13/km2). There were 4,592 housing units at an average density of 16 per square mile (6.2/km2). The racial makeup of the county was 97.26% White, 1.64% Black or African American, 0.25% Native American, 0.07% Asian, 0.13% from other races, and 0.65% from two or more races. 0.53% of the population were Hispanic or Latino of any race.
There were 4,016 households, out of which 32.30% had children under the age of 18 living with them, 58.10% were married couples living together, 10.00% had a female householder with no husband present, and 28.20% were non-families. 25.20% of all households were made up of individuals, and 12.30% had someone living alone who was 65 years of age or older. The average household size was 2.47 and the average family size was 2.93.
In the county, the population was spread out, with 24.60% under the age of 18, 8.20% from 18 to 24, 28.50% from 25 to 44, 23.60% from 45 to 64, and 15.00% who were 65 years of age or older. The median age was 38 years. For every 100 females, there were 95.20 males. For every 100 females age 18 and over, there were 92.60 males.
The median income for a household in the county was $23,540, and the median income for a family was $29,178. Males had a median income of $22,430 versus $18,591 for females. The per capita income for the county was $13,236. About 18.80% of families and 23.60% of the population were below the poverty line, including 29.20% of those under age 18 and 27.90% of those age 65 or over.
Communities[]
City[]
- Edmonton (county seat)
Census-designated place[]
Other unincorporated communities[]
Landmarks[]
Ghost Towns[]
Politics[]
Metcalfe County lies at the northwestern end of the Unionist bloc of counties that covered the eastern Pennyroyal and the Pottsville Escarpment of the Eastern Coalfield. Metcalfe itself was strongly Unionist during the Civil War,[13] and has been Republican for almost all the period since Reconstruction, though not to the same overwhelming extent as the counties to its east and south: Jimmy Carter even obtained 57 percent of the vote in 1976, and four other Democrats have narrowly carried the county since 1880 – although, as with all of rural Appalachia, the county has become overwhelmingly Republican in the twenty-first century due to views on environmental, social and cultural issues increasingly at odds with the national Democratic party.[14]
See also[]
- Dry counties
- National Register of Historic Places listings in Metcalfe County, Kentucky
- The Kentucky Headhunters, a country music/southern rock act that formed in Metcalfe County
- Black Stone Cherry, an American hard rock/southern rock act that formed in Metcalfe County (Edmonton, KY)
References[]
- ^ Jump up to: a b "State & County QuickFacts". United States Census Bureau. Archived from the original on June 7, 2011. Retrieved March 6, 2014.
- ^ "Find a County". National Association of Counties. Retrieved 2011-06-07.
- ^ E., Kleber, John; Kentucky, University Press of; Policy, Institute for Regional Analysis and Public; Library, Camden-Carroll; University, Morehead State (2000). "The Kentucky Encyclopedia". www.kyenc.org. Retrieved 2018-07-04.
- ^ The Register of the Kentucky State Historical Society, Volume 1. Kentucky State Historical Society. 1903. pp. 36.
- ^ "2010 Census Gazetteer Files". United States Census Bureau. August 22, 2012. Archived from the original on August 12, 2014. Retrieved August 18, 2014.
- ^ "Population and Housing Unit Estimates". Retrieved July 29, 2019.
- ^ "U.S. Decennial Census". United States Census Bureau. Retrieved August 18, 2014.
- ^ "Historical Census Browser". University of Virginia Library. Retrieved August 18, 2014.
- ^ "Population of Counties by Decennial Census: 1900 to 1990". United States Census Bureau. Retrieved August 18, 2014.
- ^ "Census 2000 PHC-T-4. Ranking Tables for Counties: 1990 and 2000" (PDF). United States Census Bureau. Retrieved August 18, 2014.
- ^ "U.S. Census website". United States Census Bureau. Retrieved 2008-01-31.
- ^ Leip, David. "Dave Leip's Atlas of U.S. Presidential Elections". uselectionatlas.org. Retrieved 2018-07-04.
- ^ Copeland, James E.; ‘Where Were the Kentucky Unionists and Secessionists’; The Register of the Kentucky Historical Society, volume 71, no. 4 (October 1973), pp. 344–363
- ^ Cohn, Nate; ‘Demographic Shift: Southern Whites’ Loyalty to G.O.P. Nearing That of Blacks to Democrats’, New York Times, April 24, 2014
| show Municipalities and communities of Metcalfe County, Kentucky, United States |
|---|

Coordinates: 36°59′N 85°38′W / 36.99°N 85.63°W
| show Authority control |
|---|
- Kentucky counties
- Metcalfe County, Kentucky
- Glasgow, Kentucky, micropolitan area
- Counties of Appalachia
- 1860 establishments in Kentucky
- Populated places established in 1860