Federal electoral district in Ontario, Canada
For the provincial electoral district, see Oxford (provincial electoral district) .
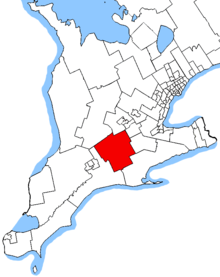
Oxford electoral district Oxford in relation to the southern Ontario ridings
Legislature House of Commons MP Dave MacKenzie Conservative District created 1933 First contested 1935 Last contested 2021 District webpage profile , map Population (2011 )[1] 108,656 Electors (2015)83,003 Area (km²)[2] 2,384 Pop. density (per km²) 45.6 Census division(s) Oxford County Census subdivision(s) Woodstock , Tillsonburg , Ingersoll , Norwich , Zorra , South-West Oxford , East Zorra – Tavistock , Blandford-Blenheim
Oxford is a federal electoral district in Ontario , Canada, that has been represented in the House of Commons of Canada since the 1935 election .
It consists of the County of Oxford and a small portion of the County of Brant .[3]
History [ ] It was created in 1933 when the ridings of Oxford North and Oxford South were merged. It consisted initially of the county of Oxford, including the part of the village of Tavistock that lies in the county of Oxford.
In 1966, it was expanded to include the Town of Tillsonburg and the whole of the Village of Tavistock. In 1976, it was defined as consisting of the County of Oxford. In 1987, it was expanded to include the Township of Burford in the County of Brant. In 1996, it was defined as consisting of the county of Oxford.
This riding gained territory from Brant during the 2012 electoral redistribution .
Members of Parliament [ ]
Parliament
Years
Member
Party
OxfordRiding created from Oxford North and Oxford South
18th
1935–1940 Almon Rennie Liberal 19th
1940–1945 20th
1945–1949 Kenneth Daniel Progressive Conservative 21st
1949–1953 Clark Murray Liberal 22nd
1953–1957 Wally Nesbitt Progressive Conservative 23rd
1957–1958 24th
1958–1962 25th
1962–1963 26th
1963–1965 27th
1965–1968 28th
1968–1972 29th
1972–1974 30th
1974–1979 Bruce Halliday 31st
1979–1980 32nd
1980–1984 33rd
1984–1988 34th
1988–1993 35th
1993–1997 John Baird Finlay Liberal 36th
1997–2000 37th
2000–2004 38th
2004–2006 Dave MacKenzie Conservative 39th
2006–2008 40th
2008–2011 41st
2011–2015 42nd
2015–2019 43rd
2019–present
Election results [ ] Graph of election results in Oxford (minor parties that never got 2% of the vote or didn't run consistently are omitted)
2021 Canadian federal election
Party
Candidate
Votes
%
Expenditures
Conservative Dave MacKenzie 29,146
47.0
-1.1
Liberal Elizabeth Quinto
12,720
20.5
+1.2
New Democratic Matthew Chambers
11,325
18.3
-1.9
People's Wendy Martin
6,595
10.6
+7.7
Green Bob Reid
1,683
2.7
-5.1
Christian Heritage Allen Scovil
479
0.8
-0.8
Total valid votes
61,948 99.4
Total rejected ballots
379 0.6
Turnout
62,327 65.2
Eligible voters
95,662
Conservative hold
Swing
+1.6
Source: Elections Canada [4]
2019 Canadian federal election
Party
Candidate
Votes
%
Expenditures
Conservative Dave MacKenzie 29,310
48.14
+2.46
$49,710.46
New Democratic Matthew Chambers
12,306
20.21
+3.66
none listed
Liberal Brendan Knight
11,745
19.29
-12.90
$3,866.13
Green Lisa Birtch-Carriere
4,770
7.83
+4.31
none listed
People's Wendy Martin
1,774
2.91
-
$6,624.90
Christian Heritage Melody Aldred
986
1.62
-0.45
$3,632.07
Total valid votes/expense limit
60,891 99.14 –
Total rejected ballots
528 0.86 +0.44
Turnout
61,419 65.92 -2.00
Eligible voters
93,166
Conservative hold
Swing
-0.60
Source: Elections Canada [5] [6]
2015 Canadian federal election
Party
Candidate
Votes
%
Expenditures
Conservative Dave MacKenzie 25,966
45.67
-13.30
$75,795.63
Liberal Don McKay
18,299
32.19
+22.55
$36,173.57
New Democratic Zoe Kunschner
9,406
16.55
-8.90
$25,490.22
Green Mike Farlow
2,004
3.53
-0.80
$4,354.32
Christian Heritage Melody Ann Aldred
1,175
2.07
$8,421.76
Total valid votes/Expense limit
56,850 99.58 $220,586.55
Total rejected ballots
241 0.42 –
Turnout
57,041 67.93
Eligible voters
84,045
Conservative hold
Swing
-17.92
Source: Elections Canada [7] [8]
2011 federal election redistributed results[9]
Party
Vote
%
Conservative 28,782
58.97
New Democratic 12,419
25.45
Liberal 4,706
9.64
Green 2,111
4.33
Others
786
1.61
2011 Canadian federal election
Party
Candidate
Votes
%
Expenditures
Conservative Dave MacKenzie 27,973
58.90
+6.23
$56,267
New Democratic Paul Arsenault
12,164
25.61
+7.59
$14,065
Liberal Tim Lobzun
4,521
9.52
-9.86
$13,495
Green Mike Farlow
2,058
4.33
-3.24
$12,611
Christian Heritage John Markus
776
1.63
-0.70
$1,478
Total valid votes/Expense limit
47,492 100.00 $85,881.86
Total rejected ballots
179 0.38 -0.05
Turnout
47,671 62.60 +3.58
Eligible voters
76,149 – –
2008 Canadian federal election
Party
Candidate
Votes
%
Expenditures
Conservative Dave MacKenzie 23,330
52.67
+6.13
$57,473
Liberal Martha Dennis
8,586
19.38
-8.70
$50,017
New Democratic Diane Abbott
7,982
18.02
+0.65
$9,242
Green Cathy Mott
3,355
7.57
+4.43
$2,819
Christian Heritage Shaun MacDonald
1,036
2.33
-0.55
$14,229
Total valid votes/Expense limit
44,289 100.00 $82,866
Total rejected ballots
145 0.33 -
Turnout
44,434 59.02
Conservative hold
Swing
+7.4
2006 Canadian federal election
Party
Candidate
Votes
%
Conservative Dave MacKenzie 23,140
46.54
+1.6
Liberal Greig Mordue
13,961
28.08
-2.4
New Democratic Zoe Kunschner
8,639
17.37
+2.9
Green Ronnee Sykes
1,566
3.14
-1.2
Christian Heritage John Markus
1,434
2.88
-0.4
Marijuana James Bender
771
1.55
-0.1
Libertarian Kaye Sargent
204
0.41
-0.1
Total valid votes
49,715 100.00
Total rejected ballots
164 0.33
Turnout
49,879 67.14
2004 Canadian federal election
Party
Candidate
Votes
%
Conservative Dave MacKenzie 20,606
44.9
-12.5
Liberal Murray Coulter
14,011
30.5
-5.0
New Democratic Zoe Kunschner
6,673
14.5
-5.3
Green Irene Tietz
1,951
4.3
Christian Heritage Leslie Bartley
1,534
3.3
Marijuana James Bender
794
1.7
Libertarian Kaye Sargent
226
0.5
Canadian Action Alex Kreider
108
0.2
-0.3
Total valid votes
45,903 100.0
Note: Conservative vote is compared to the total of the Canadian Alliance vote and Progressive Conservative vote in 2000 election.
2000 Canadian federal election
Party
Candidate
Votes
%
Liberal John Baird Finlay 15,181
35.6
-0.4
Progressive Conservative Dave MacKenzie
13,050
30.6
-1.9
Alliance Patricia Smith
11,455
26.8
+5.8
New Democratic Shawn Rouse
2,254
5.3
-2.2
Independent John Thomas Markus
536
1.3
Canadian Action Alex Kreider
227
0.5
+0.1
Total valid votes
42,703 100.0
Note: Canadian Alliance vote is compared to the Reform vote in 1997 election.
1997 Canadian federal election
Party
Candidate
Votes
%
Liberal John Baird Finlay 16,281
36.0
-4.9
Progressive Conservative Dave MacKenzie
14,706
32.5
+10.1
Reform Bill Irvine
9,533
21.1
-5.7
New Democratic Martin Donlevy
3,406
7.5
+2.5
Christian Heritage John Zekveld
956
2.1
+0.1
Canadian Action Alex Kreider
192
0.4
Natural Law Jim Morris
181
0.4
-0.1
Total valid votes
45,255 100.0
1993 Canadian federal election
Party
Candidate
Votes
%
Liberal John Baird Finlay 18,381
40.9
+3.9
Reform John Mohr
12,009
26.7
Progressive Conservative George Klosler
10,080
22.4
-17.3
New Democratic Martin Donlevy
2,280
5.1
-10.9
Christian Heritage Hans Strikwerda
892
2.0
-4.6
Independent George Moore
458
1.0
National Bryan John Rahn
400
0.9
Libertarian Kaye Sargent
219
0.5
+0.1
Natural Law Peter Leggat
209
0.5
Total valid votes
44,928 100.0
1988 Canadian federal election
Party
Candidate
Votes
%
Progressive Conservative Bruce Halliday 19,367
39.8
-17.3
Liberal Alfred Apps
18,035
37.0
+8.3
New Democratic Brian Donlevy
7,771
16.0
+2.4
Christian Heritage Hans Strikwerda
3,190
6.5
Libertarian Kaye Sargent
187
0.4
-0.3
Commonwealth of Canada Sharon Rounds
166
0.3
Total valid votes
48,716 100.0
1984 Canadian federal election
Party
Candidate
Votes
%
Progressive Conservative Bruce Halliday 25,642
57.1
+11.2
Liberal Alfred Apps
12,884
28.7
-8.1
New Democratic Wayne Colbran
6,077
13.5
-2.8
Libertarian Kaye Sargent
322
0.7
0.0
Total valid votes
44,925 100.0
1980 Canadian federal election
Party
Candidate
Votes
%
Progressive Conservative Bruce Halliday 19,382
45.9
-9.3
Liberal Ken Peers
15,546
36.8
+6.5
New Democratic Marjorie Lanaway
6,885
16.3
+2.3
Libertarian Nancy Hurd
311
0.7
+0.2
Marxist–Leninist Larry Hannant
100
0.2
Total valid votes
42,224 100.0
1979 Canadian federal election
Party
Candidate
Votes
%
Progressive Conservative Bruce Halliday 23,592
55.2
+8.8
Liberal Ron Calhoun
12,935
30.3
-12.6
New Democratic Marjorie Lanaway
5,980
14.0
+3.2
Libertarian Nancy Hurd
227
0.5
Total valid votes
42,734 100.0
1974 Canadian federal election
Party
Candidate
Votes
%
Progressive Conservative Bruce Halliday 18,934
46.4
-16.2
Liberal Charlie Tatham
17,506
42.9
+12.0
New Democratic Peter Klynstra
4,398
10.8
+4.1
Total valid votes
40,838 100.0
1972 Canadian federal election
Party
Candidate
Votes
%
Progressive Conservative Wally Nesbitt 25,438
62.5
+9.0
Liberal Charlie Tatham
12,540
30.8
-5.9
New Democratic Ron Wettlaufer
2,703
6.6
-3.0
Total valid votes
40,681 100.0
1968 Canadian federal election
Party
Candidate
Votes
%
Progressive Conservative Wally Nesbitt 18,504
53.6
-2.1
Liberal Charlie Tatham
12,697
36.8
+4.6
New Democratic John Hilborn
3,335
9.7
-2.5
Total valid votes
34,536 100.0
1965 Canadian federal election
Party
Candidate
Votes
%
Progressive Conservative Wally Nesbitt 17,657
55.6
-4.8
Liberal Leslie MacDonald Ball
10,202
32.2
-0.1
New Democratic Margaret Caffyn
3,870
12.2
+7.4
Total valid votes
31,729 100.0
1963 Canadian federal election
Party
Candidate
Votes
%
Progressive Conservative Wally Nesbitt 19,402
60.4
+2.6
Liberal William Young
10,359
32.3
-1.6
New Democratic Wilf Vale
1,550
4.8
-1.2
Social Credit Margaret Elsom
805
2.5
+0.2
Total valid votes
32,116 100.0
1962 Canadian federal election
Party
Candidate
Votes
%
Progressive Conservative Wally Nesbitt 18,352
57.8
-17.3
Liberal Robert Alan MacDougall
10,731
33.8
+9.0
New Democratic Wilf Vale
1,918
6.0
Social Credit Charles Elsom
735
2.3
Total valid votes
31,736 100.0
1958 Canadian federal election
Party
Candidate
Votes
%
Progressive Conservative Wally Nesbitt 22,079
75.1
+6.3
Liberal Hector Alexander Clark
7,305
24.9
+74.8
Total valid votes
29,384 100.0
1957 Canadian federal election
Party
Candidate
Votes
%
Progressive Conservative Wally Nesbitt 20,404
68.9
+18.8
Liberal Bruce McCall
8,275
27.9
Social Credit Charlie Elsom
944
3.2
Total valid votes
29,623 100.0
1953 Canadian federal election
Party
Candidate
Votes
%
Progressive Conservative Wally Nesbitt 12,693
50.1
+4.8
Liberal Alexander Clark Murray
12,654
49.9
+1.6
Total valid votes
25,347 100.0
1949 Canadian federal election
Party
Candidate
Votes
%
Liberal Alexander Clark Murray 12,581
48.3
+6.6
Progressive Conservative Kenneth Daniel 11,791
45.2
-3.6
Co-operative Commonwealth William Gordon Goodwin
1,688
6.5
Total valid votes
26,060 100.0
1945 Canadian federal election
Party
Candidate
Votes
%
Progressive Conservative Kenneth Daniel 11,916
48.9
+5.8
Liberal Almon Secord Rennie
10,149
41.6
-15.2
Co-operative Commonwealth Ralph Burton
2,310
9.5
Total valid votes
24,375 100.0
Note: Progressive Conservative vote is compared to "National Government" vote in 1940 election.
1940 Canadian federal election
Party
Candidate
Votes
%
Liberal Almon Secord Rennie 10,975
56.9
+9.1
National Government Charles Thomas Milton
8,325
43.1
+7.0
Total valid votes
19,300 100.0
Note: "National Government" vote is compared to Conservative vote in 1935 election.
1935 Canadian federal election
Party
Candidate
Votes
%
Liberal Almon Secord Rennie 11,438
47.8
Conservative Donald Matheson Sutherland
8,655
36.2
Reconstruction Richard Harley Mayberry
2,953
12.3
Co-operative Commonwealth William Andrew MacLeod
886
3.7
Total valid votes
23,932 100.0
See also [ ] References [ ] Notes [ ]
Federal ridings in Midwestern Ontario
Liberal Conservative
Federal ridings in Ontario
Central Eastern S Durham
City of Toronto Suburbs & Downtown )
Cities of Brampton &
Brampton
Brampton Centre Brampton East Brampton North Brampton South Brampton West Mississauga
Southern
Southwestern Halton City of Hamilton Niagara
Niagara Centre Niagara Falls Niagara West St. Catharines
Midwestern Northern Southwestern Ottawa See also : Provincial ridings in Ontario
Until 2015 Until 2006 Until 2004 Until 2000 Until 1997 Until 1993 Until 1988 Until 1984 Until 1979 Until 1974 Until 1972 Until 1968 Until 1953 Until 1949 Until 1935 Until 1925 Until 1917 Until 1904 Until 1896 Until 1882
Coordinates : 43°04′N 80°36′W / 43.06°N 80.6°W / 43.06; -80.6