Saint-Marc-Jaumegarde
show This article may be expanded with text translated from the corresponding article in French. (December 2008) Click [show] for important translation instructions. |
Saint-Marc-Jaumegarde | |
|---|---|
 The centre of the village of Saint-Marc | |
 Coat of arms | |
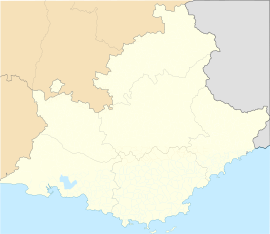
show Location of Saint-Marc-Jaumegarde | |
 Saint-Marc-Jaumegarde | |
| Coordinates: 43°32′55″N 5°31′29″E / 43.5486°N 5.5247°ECoordinates: 43°32′55″N 5°31′29″E / 43.5486°N 5.5247°E | |
| Country | France |
| Region | Provence-Alpes-Côte d'Azur |
| Department | Bouches-du-Rhône |
| Arrondissement | Aix-en-Provence |
| Canton | Trets |
| Intercommunality | Aix-Marseille-Provence |
| Government | |
| • Mayor (2020–2026) | Régis Martin |
| Area 1 | 22.56 km2 (8.71 sq mi) |
| Population (Jan. 2018)[1] | 1,243 |
| • Density | 55/km2 (140/sq mi) |
| Time zone | UTC+01:00 (CET) |
| • Summer (DST) | UTC+02:00 (CEST) |
| INSEE/Postal code | 13095 /13100 |
| Elevation | 241–600 m (791–1,969 ft) (avg. 395 m or 1,296 ft) |
| Website | www |
| 1 French Land Register data, which excludes lakes, ponds, glaciers > 1 km2 (0.386 sq mi or 247 acres) and river estuaries. | |


Saint-Marc-Jaumegarde (French pronunciation: [sɛ̃ maʁk ʒomgaʁd]; Provençal: Sant Marc de Jaumegarda) is a commune in the Bouches-du-Rhône department in southern France.
Location[]
It is located 6 kilometres away from Aix-en-Provence and Vauvenargues, Bouches-du-Rhône, and 3 kilometres away from Le Tholonet, near the Montagne Sainte-Victoire.
The commune includes Bonfillons, Roussillier, Plan de l'Orgue, Savoyards, and Bourg.

There are two man-made lakes, namely Bimont and Zola, and the streamlet, Prignon.
History[]
In 1239, the land was given to the Lord of Esparon by Ramon Berenguer IV, Count of Provence.
By 1490, Jacques Garde had become Lord of Saint-Marc, and twenty years later the land was passed on to Dauphine Garde, wife of Bertrand de Puget.
In 1723, Saint-Marc was sold to the Meyronnets, a family of advisors in the Provence Parliament. In 1784-1785 Philippe de Meyronnet invited Lucien Bonaparte and Joseph Bonaparte to his estate.
Population[]
|
|
See also[]
References[]
- ^ "Populations légales 2018". INSEE. 28 December 2020.
| Wikimedia Commons has media related to Saint-Marc-Jaumegarde. |
This Bouches-du-Rhône geographical article is a stub. You can help Wikipedia by . |
- Communes of Bouches-du-Rhône
- Bouches-du-Rhône geography stubs