Scarborough Southwest
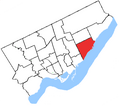
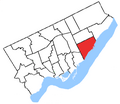
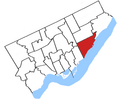
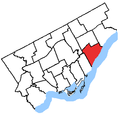
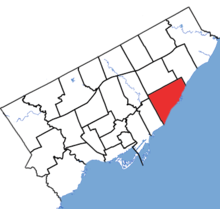 Scarborough Southwest in relation to the other Toronto ridings (2013 boundaries) | |||
| Federal electoral district | |||
| Legislature | House of Commons | ||
| MP |
Liberal | ||
| District created | 1966 | ||
| First contested | 1968 | ||
| Last contested | 2021 | ||
| District webpage | profile, map | ||
| Demographics | |||
| Population (2011)[1] | 106,733 | ||
| Electors (2019) | 78,246 | ||
| Area (km²)[2] | 29 | ||
| Pop. density (per km²) | 3,680.4 | ||
| Census division(s) | Toronto | ||
| Census subdivision(s) | Toronto | ||

Scarborough Southwest is a federal electoral district in Toronto, Ontario, Canada, that has been represented in the House of Commons of Canada since 1968.
Geography[]
It covers the southwestern part of the Scarborough part of Toronto. It stretches from Lake Ontario in the south to Eglinton Avenue in the north.
It consists of the part of the City of Toronto bounded on the west by Victoria Park Avenue, on the south by Lake Ontario, on the north by Eglinton Avenue and on the east by Markham Road.
The riding includes the neighbourhoods of Birch Cliff, Oakridge, Cliffside, Kennedy Park, Clairlea, Cliffcrest and parts of Scarborough Village and the Golden Mile.
History[]

1966 to 1976
1976 to 1987
1987 to 1996
1996 to 2003
2003 to 2013


Scarborough West riding was created in 1966 and from parts of Danforth and York—Scarborough ridings.
It initially consisted of the part of the borough of Scarborough west of a line formed by Midland Avenue the Canadian National Railway line and Brimley Road and south of Eglinton Avenue. It also included the part of the city west of Birchmount Road and south of Lawrence Avenue East.
In 1976, it was redefined to consist of the part of the Borough of Scarborough south Eglinton Avenue East and west of Bellamy Road South, and the part south of Kingston Road and east of Bellamy Ravine Creek.
In 1987, it was redefined to consist of the part of the City of Scarborough south Eglinton Avenue East and west of Markham Road.
The electoral district was abolished in 1996 when it was redistributed when almost all of the riding was transferred to Scarborough Southwest riding.
A new riding named Scarborough Southwest was created out of Scarborough West and a small part of Scarborough East in 1996. It consisted initially of the part of the City of Scarborough lying south and west of a line drawn from the western city limit east along Eglinton Avenue East, north along Markham Road, east along the Canadian National Railway, southwest along Kingston Road, south along Scarborough Golf Club Road, southwest along Hill Crescent, southeast along Bellamy Ravine Creek.
This riding lost territory to Scarborough Centre and gained territory from Scarborough—Guildwood during the 2012 electoral redistribution.
Member of Parliament[]
This riding has elected the following member of the House of Commons of Canada:
| Parliament | Years | Member | Party | |
|---|---|---|---|---|
| Scarborough West Riding created from York—Scarborough and Danforth |
||||
| 28th | 1968–1972 | David Weatherhead | Liberal | |
| 29th | 1972–1974 | John Paul Harney | New Democratic | |
| 30th | 1974–1979 | Alan Gray Martin | Liberal | |
| 31st | 1979–1980 | William Wightman | Progressive Conservative | |
| 32nd | 1980–1984 | David Weatherhead | Liberal | |
| 33rd | 1984–1988 | Reg Stackhouse | Progressive Conservative | |
| 34th | 1988–1993 | Tom Wappel | Liberal | |
| 35th | 1993–1997 | |||
| Scarborough Southwest | ||||
| 36th | 1997–2000 | Tom Wappel | Liberal | |
| 37th | 2000–2004 | |||
| 38th | 2004–2006 | |||
| 39th | 2006–2008 | |||
| 40th | 2008–2011 | Michelle Simson | ||
| 41st | 2011–2015 | Dan Harris | New Democratic | |
| 42nd | 2015–2019 | Bill Blair | Liberal | |
| 43rd | 2019–present | |||
Election results[]
All electoral information is taken from Elections Canada. Italicized expenditures from elections after 1997 refer to candidate submissions, and are presented when the final reviewed totals are not available. Expenditures from 1997 refer to submitted totals. The +/- figures from 1997 and 2004 are adjusted for redistribution.
Scarborough Southwest (1997-present)[]
| 2021 Canadian federal election | ||||||||
|---|---|---|---|---|---|---|---|---|
| Party | Candidate | Votes | % | ±% | Expenditures | |||
| Liberal | Bill Blair | 24,823 | 57.5 | +0.3 | ||||
| Conservative | Mohsin Bhuiyan | 8,981 | 20.8 | +0.1 | ||||
| New Democratic | Guled Arale | 6,924 | 16.0 | +0.5 | ||||
| People's | Ramona Pache | 1,259 | 2.9 | +1.7 | ||||
| Green | Amanda Cain | 1,068 | 2.5 | -2.4 | ||||
| Independent | David Edward-Ooi Poon | 117 | 0.3 | N/A | ||||
| Total valid votes | 43,172 | 99.3 | ||||||
| Total rejected ballots | 325 | 0.7 | ||||||
| Turnout | 43,497 | 56.8 | ||||||
| Eligible voters | 76,559 | |||||||
| Liberal gain | Swing | +0.1 | ||||||
| Source: Elections Canada[3] | ||||||||
| 2019 Canadian federal election | ||||||||
|---|---|---|---|---|---|---|---|---|
| Party | Candidate | Votes | % | ±% | Expenditures | |||
| Liberal | Bill Blair | 28,965 | 57.2 | +4.73 | $59,424.78 | |||
| Conservative | Kimberly Fawcett Smith | 10,502 | 20.7 | -0.52 | $31,378.91 | |||
| New Democratic | Keith McCrady | 7,865 | 15.5 | -8.23 | $32,226.21 | |||
| Green | Amanda Cain | 2,477 | 4.9 | +2.32 | $4,140.81 | |||
| People's | Italo Eratostene | 590 | 1.2 | $5,716.04 | ||||
| Animal Protection | Simon Luisi | 236 | 0.5 | none listed | ||||
| Total valid votes/expense limit | 50,635 | 100.0 | ||||||
| Total rejected ballots | 449 | |||||||
| Turnout | 51,084 | 65.3 | ||||||
| Eligible voters | 78,246 | |||||||
| Liberal hold | Swing | +2.63 | ||||||
| Source: Elections Canada[4][5][6] | ||||||||
| 2015 Canadian federal election | ||||||||
|---|---|---|---|---|---|---|---|---|
| Party | Candidate | Votes | % | ±% | Expenditures | |||
| Liberal | Bill Blair | 25,586 | 52.47 | +23.13 | $153,155.47 | |||
| New Democratic | Dan Harris | 11,574 | 23.73 | -11.14 | $48,940.84 | |||
| Conservative | Roshan Nallaratnam | 10,347 | 21.22 | -10.46 | $64,631.85 | |||
| Green | Tommy Taylor | 1,259 | 2.58 | -1.48 | $5,572.61 | |||
| Total valid votes/expense limit | 48,766 | 100.0 | $205,220.58 | |||||
| Total rejected ballots | 277 | 0.56 | – | |||||
| Turnout | 49,043 | 67.96 | – | |||||
| Eligible voters | 72,164 | |||||||
| Liberal gain from New Democratic | Swing | +17.13 | ||||||
| Source: Elections Canada[7][8] | ||||||||
| 2011 federal election redistributed results[9] | |||
|---|---|---|---|
| Party | Vote | % | |
| New Democratic | 13,731 | 34.87 | |
| Conservative | 12,474 | 31.68 | |
| Liberal | 11,554 | 29.34 | |
| Green | 1,600 | 4.06 | |
| Others | 20 | 0.05 | |
| 2011 Canadian federal election | ||||||||
|---|---|---|---|---|---|---|---|---|
| Party | Candidate | Votes | % | ±% | Expenditures | |||
| New Democratic | Dan Harris | 14,119 | 35.04 | +16.29 | ||||
| Conservative | Gavan Paranchothy | 12,830 | 31.85 | +2.34 | ||||
| Liberal | Michelle Simson | 11,699 | 29.05 | -12.77 | ||||
| Green | Stefan Dixon | 1,635 | 4.06 | -5.43 | ||||
| Total valid votes/Expense limit | 40,283 | 100.00 | – | |||||
| Total rejected ballots | 218 | 0.54 | +0.01 | – | ||||
| Turnout | 40,501 | 59.45 | +4.71 | – | ||||
| Eligible voters | 68,122 | – | – | – | ||||
| 2008 Canadian federal election | ||||||||
|---|---|---|---|---|---|---|---|---|
| Party | Candidate | Votes | % | ±% | Expenditures | |||
| Liberal | Michelle Simson | 15,486 | 41.82 | -6.06 | $61,923 | |||
| Conservative | Greg Crompton | 10,928 | 29.51 | +5.37 | $52,973 | |||
| New Democratic | Alamgir Hussain | 6,943 | 18.75 | -4.15 | $22,985 | |||
| Green | Stefan Dixon | 3,514 | 9.49 | +5.08 | $588 | |||
| Independent | M. H. Fatique Chowdhury Kabir | 151 | 0.40 | – | ||||
| Total valid votes/Expense limit | 37,022 | 100.00 | – | $80,366 | ||||
| Total rejected ballots | 195 | 0.52 | +0.07 | – | ||||
| Turnout | 37,217 | 54.74 | -7.63 | – | ||||
| Eligible voters | 67,988 | – | – | – | ||||
| Liberal hold | Swing | -5.7 | ||||||
| 2006 Canadian federal election | ||||||||
|---|---|---|---|---|---|---|---|---|
| Party | Candidate | Votes | % | ±% | Expenditures | |||
| Liberal | Tom Wappel | 19,930 | 47.83 | −1.63 | $31,803 | |||
| Conservative | Vincent Veerasuntharam | 10,017 | 24.04 | +0.26 | $68,687 | |||
| New Democratic | Dan Harris | 9,626 | 23.10 | +0.79 | $18,101 | |||
| Green | Valerie Philip | 1,827 | 4.38 | +0.38 | ||||
| Independent | Trevor Sutton | 147 | 0.35 | |||||
| Communist | Elizabeth Rowley | 120 | 0.29 | −0.15 | $280 | |||
| Total valid votes | 41,667 | 100.00 | ||||||
| Total rejected ballots | 189 | 0.45 | −0.11 | |||||
| Turnout | 41,856 | 62.37 | +5.21 | |||||
| Electors on the lists | 67,109 | |||||||
| Sources: Official Results, Elections Canada and Financial Returns, Elections Canada. | ||||||||
| 2004 Canadian federal election | ||||||||
|---|---|---|---|---|---|---|---|---|
| Party | Candidate | Votes | % | ±% | Expenditures | |||
| Liberal | Tom Wappel | 18,776 | 49.46 | −10.36 | $47,511 | |||
| Conservative | Heather Jewell | 9,028 | 23.78 | −4.59 | $63,040 | |||
| New Democratic | Dan Harris | 8,471 | 22.31 | +12.05 | $21,397 | |||
| Green | Peter Van Dalen | 1,520 | 4.00 | not listed | ||||
| Communist | Elizabeth Rowley | 168 | 0.44 | $300 | ||||
| Total valid votes | 37,963 | 100.00 | ||||||
| Total rejected ballots | 215 | 0.56 | −0.10 | |||||
| Turnout | 38,178 | 57.16 | +3.73 | |||||
| Electors on the lists | 66,797 | |||||||
| Percentage change figures are factored for redistribution. Conservative Party percentages are contrasted with the combined Canadian Alliance and Progressive Conservative percentages from 2000. | ||||||||
| Sources: Official Results, Elections Canada and Financial Returns, Elections Canada. | ||||||||
| 2000 Canadian federal election | ||||||||
|---|---|---|---|---|---|---|---|---|
| Party | Candidate | Votes | % | ±% | Expenditures | |||
| Liberal | Tom Wappel | 21,466 | 60.01 | +6.61 | $47,146 | |||
| Progressive Conservative | Ellery Hollingsworth | 5,251 | 14.68 | +1.01 | $14,019 | |||
| Alliance | Nabil El-Khazen | 4,912 | 13.73 | −6.72 | $30,429 | |||
| New Democratic | Dan Harris | 3,638 | 10.17 | −1.05 | $10,666 | |||
| Canadian Action | Walter Aolari | 336 | 0.94 | $4,886 | ||||
| Communist | Dora Stewart | 165 | 0.46 | $202 | ||||
| Total valid votes | 35,768 | 100.00 | ||||||
| Total rejected ballots | 237 | 0.66 | −0.04 | |||||
| Turnout | 36,005 | 53.43 | −9.52 | |||||
| Electors on the lists | 67,382 | |||||||
| Sources: Official Results, Elections Canada and Financial Returns, Elections Canada. | ||||||||
| 1997 Canadian federal election | ||||||||
|---|---|---|---|---|---|---|---|---|
| Party | Candidate | Votes | % | ±% | Expenditures | |||
| Liberal | Tom Wappel | 20,675 | 53.40 | −1.34 | $35,520 | |||
| Reform | Tom Ambas | 7,918 | 20.45 | −0.62 | $41,884 | |||
| Progressive Conservative | Brian McCutcheon | 5,294 | 13.67 | −0.70 | $16,872 | |||
| New Democratic | Dave Gracey | 4,345 | 11.22 | +4.28 | $7,984 | |||
| Green | David James Cooper | 482 | 1.25 | $0.00 | ||||
| Total valid votes | 38,714 | 100.00 | ||||||
| Total rejected ballots | 273 | 0.70 | ||||||
| Turnout | 38,987 | 62.95 | ||||||
| Electors on the lists | 61,932 | |||||||
| Percentage change figures are factored for redistribution. | ||||||||
| Sources: Official Results, Elections Canada and Financial Returns, Elections Canada. | ||||||||
Scarborough West (1968-1997)[]
| 1993 Canadian federal election | ||||||||
|---|---|---|---|---|---|---|---|---|
| Party | Candidate | Votes | % | ±% | ||||
| Liberal | Tom Wappel | 21,326 | 54.2 | +17.4 | ||||
| Reform | Aubrey Millard | 8,377 | 21.3 | +21.3 | ||||
| Progressive Conservative | Reg Stackhouse | 5,668 | 14.4 | -21.3 | ||||
| New Democratic | Steve Thomas | 2,859 | 7.3 | -19.1 | ||||
| National | Greg Gogan | 583 | 1.5 | +1.5 | ||||
| Green | Jim MacLeod | 273 | 0.7 | +0.7 | ||||
| Natural Law | Ron Robins | 213 | 0.5 | +0.5 | ||||
| Abolitionist | Alfred Morton | 39 | 0.1 | +0.1 | ||||
| Total valid votes | 39,338 | 100.00 | ||||||
| 1988 Canadian federal election | ||||||||
|---|---|---|---|---|---|---|---|---|
| Party | Candidate | Votes | % | ±% | ||||
| Liberal | Tom Wappel | 15,363 | 36.8 | +7.4 | ||||
| Progressive Conservative | Reg Stackhouse | 14,923 | 35.7 | -5.2 | ||||
| New Democratic | Dave Gracey | 11,000 | 26.4 | -1.1 | ||||
| Libertarian | Anna Young | 459 | 1.1 | +0.3 | ||||
| Total valid votes | 41,745 | 100.00 | ||||||
| 1984 Canadian federal election | ||||||||
|---|---|---|---|---|---|---|---|---|
| Party | Candidate | Votes | % | ±% | ||||
| Progressive Conservative | Reg Stackhouse | 17,028 | 40.9 | +9.6 | ||||
| Liberal | David Weatherhead | 12,230 | 29.4 | -5.7 | ||||
| New Democratic | David Gracey | 11,436 | 27.5 | -4.7 | ||||
| Green | Laurie Gourlay | 364 | 0.9 | +0.9 | ||||
| Libertarian | D'Arcy J. Cain | 330 | 0.8 | -0.2 | ||||
| Commonwealth of Canada | David Harris | 129 | 0.3 | +0.3 | ||||
| Communist | Kerry McCuaig | 99 | 0.2 | 0.0 | ||||
| Total valid votes | 41,616 | 100.00 | ||||||
| 1980 Canadian federal election | ||||||||
|---|---|---|---|---|---|---|---|---|
| Party | Candidate | Votes | % | ±% | ||||
| Liberal | David Weatherhead | 14,316 | 35.1 | +3.7 | ||||
| New Democratic | John Paul Harney | 13,146 | 32.2 | +1.0 | ||||
| Progressive Conservative | William Wightman | 12,744 | 31.3 | -5.1 | ||||
| Libertarian | D'Arcy J. Cain | 401 | 1.0 | +0.4 | ||||
| Communist | John MacLennan | 92 | 0.2 | -0.1 | ||||
| Marxist–Leninist | Brenda Miller | 66 | 0.2 | +0.1 | ||||
| Total valid votes | 40,765 | 100.00 | ||||||
| 1979 Canadian federal election | ||||||||
|---|---|---|---|---|---|---|---|---|
| Party | Candidate | Votes | % | ±% | ||||
| Progressive Conservative | William Wightman | 15,697 | 36.4 | +6.2 | ||||
| Liberal | Alan Gray Martin | 13,523 | 31.4 | -5.2 | ||||
| New Democratic | John Paul Harney | 13,437 | 31.2 | -1.6 | ||||
| Libertarian | D'Arcy J. Cain | 257 | 0.6 | +0.6 | ||||
| Communist | Tom Bull | 114 | 0.3 | +0.3 | ||||
| Marxist–Leninist | Brenda Miller | 56 | 0.1 | -0.1 | ||||
| Total valid votes | 43,084 | 100.00 | ||||||
| 1974 Canadian federal election | ||||||||
|---|---|---|---|---|---|---|---|---|
| Party | Candidate | Votes | % | ±% | ||||
| Liberal | Alan Gray Martin | 13,702 | 36.6 | +3.6 | ||||
| New Democratic | John Paul Harney | 12,298 | 32.8 | -3.6 | ||||
| Progressive Conservative | Basil Clark | 11,339 | 30.2 | -0.2 | ||||
| Marxist–Leninist | Linda Turnbull | 89 | 0.2 | +0.2 | ||||
| Independent | Harold Rowbottom | 61 | 0.2 | +0.2 | ||||
| Total valid votes | 37,489 | 100.00 | ||||||
| 1972 Canadian federal election | ||||||||
|---|---|---|---|---|---|---|---|---|
| Party | Candidate | Votes | % | ±% | ||||
| New Democratic | John Paul Harney | 15,028 | 36.4 | +0.5 | ||||
| Liberal | David Weatherhead | 13,635 | 33.0 | -9.9 | ||||
| Progressive Conservative | Basil Clark | 12,539 | 30.4 | +9.2 | ||||
| Independent | Roger Tentrey | 103 | 0.2 | +0.2 | ||||
| Total valid votes | 41,305 | 100.00 | ||||||
| 1968 Canadian federal election | ||||||||
|---|---|---|---|---|---|---|---|---|
| Party | Candidate | Votes | % | ±% | ||||
| Liberal | David Weatherhead | 14,889 | 42.9 | |||||
| New Democratic | John Paul Harney | 12,473 | 35.9 | |||||
| Progressive Conservative | Herb Crosby | 7,340 | 21.2 | |||||
| Total valid votes | 34,702 | 100.00 | ||||||
See also[]
- List of Canadian federal electoral districts
- Past Canadian electoral districts
References[]
- "(Code 35084) Census Profile". 2011 census. Statistics Canada. 2012. Retrieved March 3, 2011.
- Riding history from the Library of Parliament
- Campaign expense data from Elections Canada
Notes[]
- ^ Statistics Canada: 2011
- ^ Statistics Canada: 2011
- ^ "List of confirmed candidates – September 20, 2021 Federal Election". Elections Canada. Retrieved September 2, 2021.
- ^ "List of confirmed candidates". Elections Canada. Retrieved October 4, 2019.
- ^ "Election Night Results". Elections Canada. Retrieved November 5, 2019.
- ^ "Candidate Campaign Returns". Elections Canada. Retrieved September 7, 2020.
- ^ Elections Canada – Confirmed candidates for Scarborough Southwest, 30 September 2015
- ^ Elections Canada – Final Candidates Election Expenses Limits
- ^ Pundits' Guide to Canadian Elections
Places adjacent to Scarborough Southwest | ||||||||||||||||
|---|---|---|---|---|---|---|---|---|---|---|---|---|---|---|---|---|
| ||||||||||||||||
Federal ridings in Suburban Toronto | ||
|---|---|---|
| Liberal |
| |
Coordinates: 43°41′31″N 79°16′26″W / 43.692°N 79.274°W
- Federal electoral districts of Toronto
- Ontario federal electoral districts
- Scarborough, Toronto
- 1966 establishments in Ontario
- 1996 disestablishments in Ontario
- 1996 establishments in Ontario